

Performance of the LIAISON® SARS-CoV-2 Antigen Assay vs. SARS-CoV-2-RT-PCR
- PMID: 34073618
- PMCID: PMC8228578
- DOI: 10.3390/pathogens10060658
Performance of the LIAISON® SARS-CoV-2 Antigen Assay vs. SARS-CoV-2-RT-PCR
Abstract
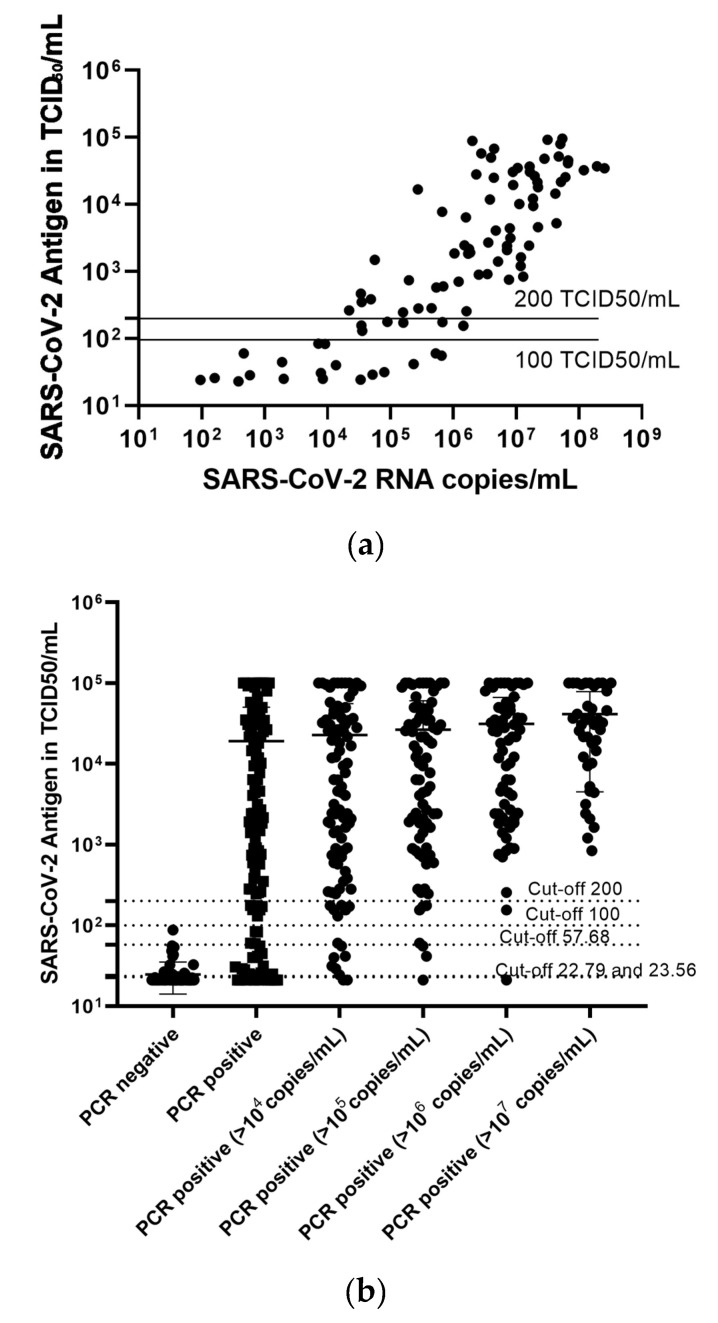
We aimed to evaluate the LIAISON® SARS-CoV-2 antigen assay (DiaSorin), comparing its performance to real-time polymerase chain reaction (RT-PCR) for the detection of SARS-CoV-2 RNA. 182 (110 PCR-positive and 72 PCR-negative) nasopharyngeal swab samples were taken for the detection of SARS-CoV-2. RT-PCR and antigen assay were performed using the same material. The sensitivity and specificity of the antigen assay were calculated for different cut-offs, with RT-PCR serving as the reference method. Stored clinical samples that were positive for other respiratory viruses were tested to evaluate cross-reactivity. One third (33/110, 30%) were falsely classified as negative, while no false positives were found using the 200 TCID50/mL cut-off for the SARS-CoV-2 antigen as proposed by the manufacturer. This corresponded to a sensitivity of 70% (60-78%) and a specificity of 100% (94-100%). Lowering the cut-off for positivity of the antigen assay to 22.79 or 57.68 TCID50/mL increased the sensitivity of the method, reaching a sensitivity of 92% (85-96%) vs. 79% (70-86%) and a specificity of 81% (69-89%) vs. 99% (91-100%), respectively. The antigen assay reliably detected samples with high SARS-CoV-2 viral loads (≥106 copies SARS-CoV-2/mL), while it cannot differentiate between negative and low positive samples. Cross-reactivity toward other respiratory viruses was not detected.
Keywords: COVID-19; LIAISON® SARS-CoV-2 antigen assay; RT-PCR; SARS-CoV-2; antigen.
Conflict of interest statement
The authors declare no conflict of interest.
Figures
Similar articles
-
Comparison of performance of LIAISON SARS-CoV-2 antigen assay with RT-PCR during the Omicron wave.Acta Microbiol Immunol Hung. 2023 Jan 9;70(1):1-6. doi: 10.1556/030.2022.01863. Print 2023 Mar 2. Acta Microbiol Immunol Hung. 2023. PMID: 36622645
-
Evaluation of the DiaSorin LIAISON SARS-CoV-2 antigen assay on nasopharyngeal swabs in two different SARS-CoV-2 pandemic waves in Switzerland: The impact of the Omicron variant on its performance.J Clin Virol Plus. 2022 Aug;2(3):100095. doi: 10.1016/j.jcvp.2022.100095. Epub 2022 Jun 26. J Clin Virol Plus. 2022. PMID: 35789900 Free PMC article.
-
Diagnostic Performance of Automated SARS-CoV-2 Antigen Assay in Nasal Swab during COVID-19 Vaccination Campaign.Diagnostics (Basel). 2021 Nov 15;11(11):2110. doi: 10.3390/diagnostics11112110. Diagnostics (Basel). 2021. PMID: 34829457 Free PMC article.
-
Analytical Performance of Quantitative DiaSorin Liaison SARS-COV-2 Antigen Test for the Asymptomatic Population.Front Public Health. 2022 Jan 7;9:788581. doi: 10.3389/fpubh.2021.788581. eCollection 2021. Front Public Health. 2022. PMID: 35071169 Free PMC article.
-
Systematic Review of Diagnostic Accuracy of DiaSorin Liaison SARS-CoV-2 Antigen Immunoassay.EJIFCC. 2022 Aug 8;33(2):94-104. eCollection 2022 Aug. EJIFCC. 2022. PMID: 36313904 Free PMC article. Review.
Cited by
-
Performance of Antigen Detection Tests for SARS-CoV-2: A Systematic Review and Meta-Analysis.Diagnostics (Basel). 2022 Jun 4;12(6):1388. doi: 10.3390/diagnostics12061388. Diagnostics (Basel). 2022. PMID: 35741198 Free PMC article. Review.
-
Performance of Rapid Antigen Tests for COVID-19 Diagnosis: A Systematic Review and Meta-Analysis.Diagnostics (Basel). 2022 Jan 4;12(1):110. doi: 10.3390/diagnostics12010110. Diagnostics (Basel). 2022. PMID: 35054277 Free PMC article. Review.
-
Optimizing COVID-19 control with asymptomatic surveillance testing in a university environment.medRxiv [Preprint]. 2021 Oct 27:2020.11.12.20230870. doi: 10.1101/2020.11.12.20230870. medRxiv. 2021. Update in: Epidemics. 2021 Dec;37:100527. doi: 10.1016/j.epidem.2021.100527. PMID: 33442708 Free PMC article. Updated. Preprint.
-
COVID-19 in Elderly, Immunocompromised or Diabetic Patients-From Immune Monitoring to Clinical Management in the Hospital.Viruses. 2022 Apr 1;14(4):746. doi: 10.3390/v14040746. Viruses. 2022. PMID: 35458476 Free PMC article.
-
Optimizing COVID-19 control with asymptomatic surveillance testing in a university environment.Epidemics. 2021 Dec;37:100527. doi: 10.1016/j.epidem.2021.100527. Epub 2021 Nov 15. Epidemics. 2021. PMID: 34814094 Free PMC article.
References
-
- WHO Laboratory Testing for Coronavirus Disease 2019 (COVID-19) in Suspected Human Cases: Interim Guidance. 2 March 2020. [(accessed on 23 March 2021)]; Available online: https://apps.who.int/iris/handle/10665/331329.
-
- Corman V.M., Haage V.C., Bleicker T., Schmidt M.L., Mühlemann B., Zuchowski M., Jo W.K., Tscheak P., Möncke-Buchner E., Müller M.A., et al. Comparison of seven commercial SARS-CoV-2 rapid point-of-care antigen tests: A single-centre laboratory evaluation study. Lancet Microbe. 2021 doi: 10.1016/S2666-5247(21)00056-2. - DOI - PMC - PubMed
-
- Brümmer L.E., Katzenschlager S., Gaeddert M., Erdmann C., Schmitz S., Bota M., Grilli M., Larmann J., Weigand M.A., Pollock N.R., et al. The accuracy of novel antigen rapid diagnostics for SARS-CoV-2: A living systematic review and meta-analysis. medRxiv. 2021 doi: 10.1101/2021.02.26.21252546. - DOI - PMC - PubMed
LinkOut - more resources
Full Text Sources
Miscellaneous
