

High Doses of D-Chiro-Inositol Alone Induce a PCO-Like Syndrome and Other Alterations in Mouse Ovaries
- PMID: 34073634
- PMCID: PMC8198710
- DOI: 10.3390/ijms22115691
High Doses of D-Chiro-Inositol Alone Induce a PCO-Like Syndrome and Other Alterations in Mouse Ovaries
Abstract
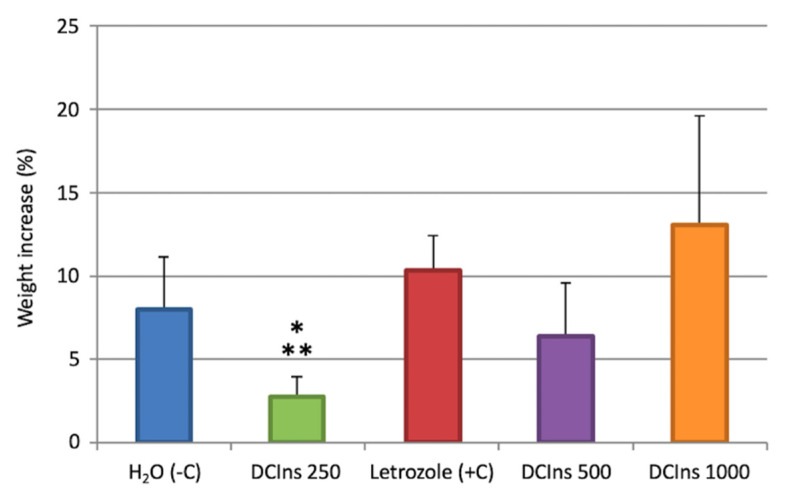
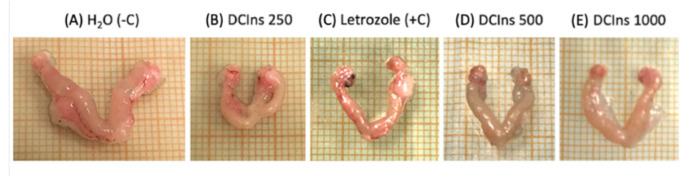
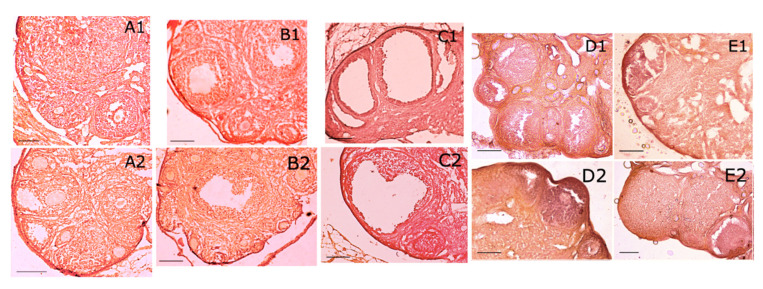
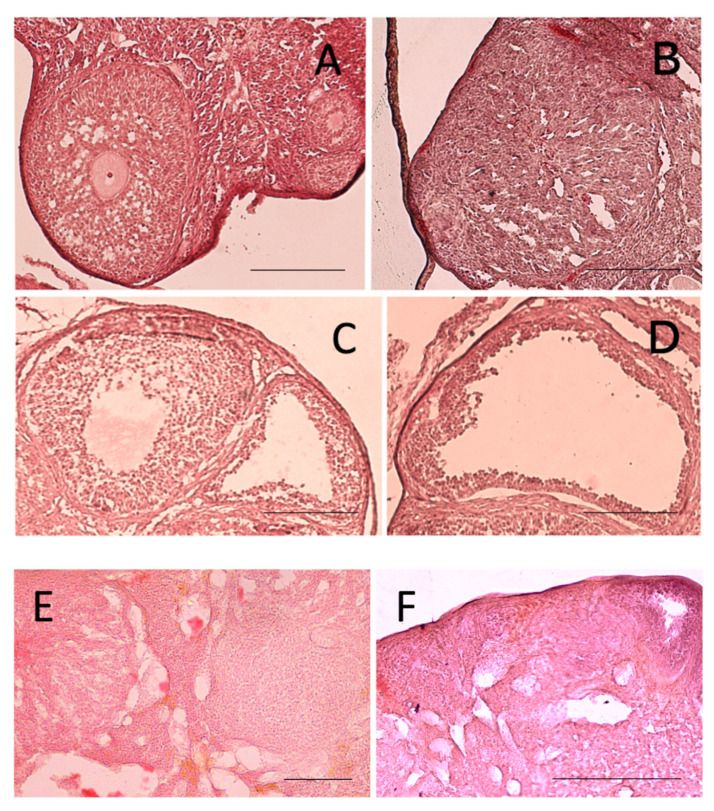
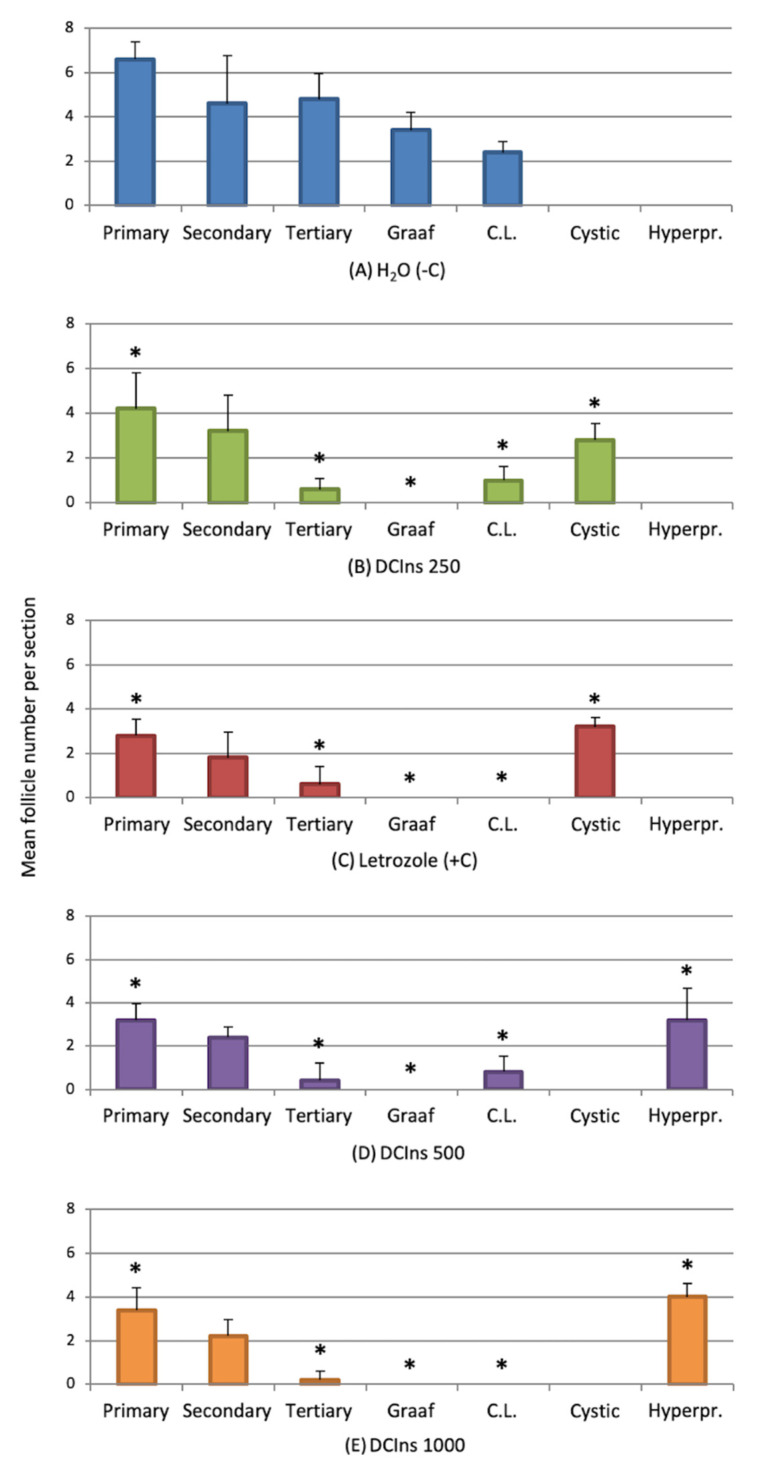
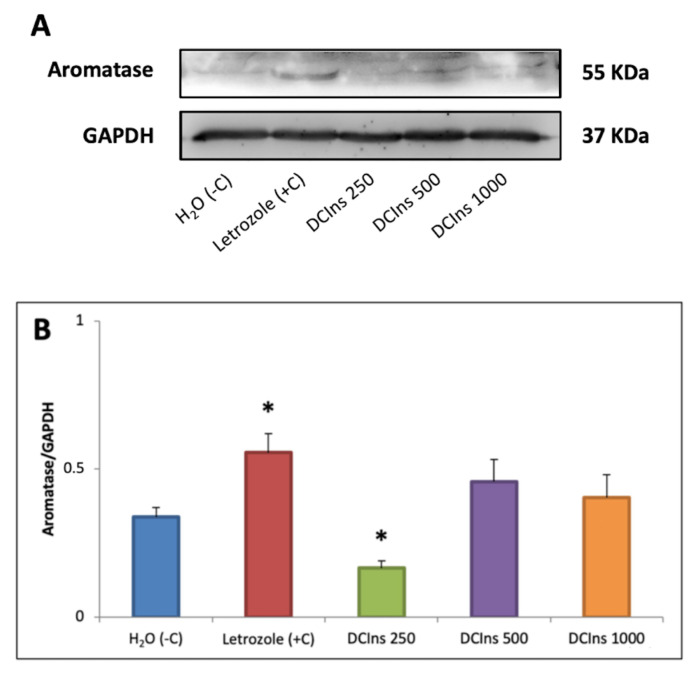
Administration of 1000-1500 mg/day D-Chiro-Inositol (DCIns) or a combination of Myo-Inositol (MyoIns) and DCIns in their plasma molar ratio (40:1) for three or more months are among recommended treatments for metabolic syndrome and/or Polycystic Ovary Syndrome (PCOS). We previously confirmed the efficacy of this formulation (8.2 mg/day MyoIns and 0.2 mg/day DCIns for 10 days) in a mouse PCOS model, but also observed negative effects on ovarian histology and function of formulations containing 0.4-1.6 mg/day DCIns. We therefore analyzed effects of higher doses of DCIns, 5, 10 and 20 mg/day, administered to young adult female mice for 21 days, on ovarian histology, serum testosterone levels and expression of the ovarian enzyme aromatase. Five mg/day DCIns (human correspondence: 1200 mg/day) altered ovarian histology, increased serum testosterone levels and reduced the amount of aromatase of negative controls, suggesting the induction of an androgenic PCOS model. In contrast, 10-20 mg/day DCIns (human correspondence: 2400-4800 mg/day) produced ovarian lesions resembling those typical of aged mice, and reduced serum testosterone levels without affecting aromatase amounts, suggesting a failure in steroidogenic gonadal activity. Notwithstanding physiological/biochemical differences between mice and humans, the observed pictures of toxicity for ovarian histology and function recommend caution when administering DCIns to PCOS patients at high doses and/or for periods spanning several ovulatory cycles.
Keywords: PCOS model; androgenic phenotype; aromatase; inositol; letrozole; menopause; mouse ovary; testosterone.
Conflict of interest statement
The authors declare that there is no conflict of interests.
Figures
Similar articles
-
The Role of Inositols in the Hyperandrogenic Phenotypes of PCOS: A Re-Reading of Larner's Results.Int J Mol Sci. 2023 Mar 27;24(7):6296. doi: 10.3390/ijms24076296. Int J Mol Sci. 2023. PMID: 37047265 Free PMC article. Review.
-
Myo-inositol and D-chiro-inositol (40:1) reverse histological and functional features of polycystic ovary syndrome in a mouse model.J Cell Physiol. 2019 Jun;234(6):9387-9398. doi: 10.1002/jcp.27623. Epub 2018 Oct 14. J Cell Physiol. 2019. PMID: 30317628
-
Inositol Restores Appropriate Steroidogenesis in PCOS Ovaries Both In Vitro and In Vivo Experimental Mouse Models.Cells. 2024 Jul 9;13(14):1171. doi: 10.3390/cells13141171. Cells. 2024. PMID: 39056753 Free PMC article.
-
D-Chiro-Inositol Treatment Affects Oocyte and Embryo Quality and Improves Glucose Intolerance in Both Aged Mice and Mouse Models of Polycystic Ovarian Syndrome.Int J Mol Sci. 2020 Aug 22;21(17):6049. doi: 10.3390/ijms21176049. Int J Mol Sci. 2020. PMID: 32842637 Free PMC article.
-
Inositols: From Established Knowledge to Novel Approaches.Int J Mol Sci. 2021 Sep 30;22(19):10575. doi: 10.3390/ijms221910575. Int J Mol Sci. 2021. PMID: 34638926 Free PMC article. Review.
Cited by
-
Long-Lasting Therapies with High Doses of D-chiro-inositol: The Downside.J Clin Med. 2023 Jan 3;12(1):390. doi: 10.3390/jcm12010390. J Clin Med. 2023. PMID: 36615188 Free PMC article.
-
<sc>d</sc>-Chiro-Inositol in Clinical Practice: A Perspective from the Experts Group on Inositol in Basic and Clinical Research (EGOI).Gynecol Obstet Invest. 2024;89(4):284-294. doi: 10.1159/000536081. Epub 2024 Feb 19. Gynecol Obstet Invest. 2024. PMID: 38373412 Free PMC article. Review.
-
Unexpected effects of treating insulin-resistant obese women with high-dose D-chiro-inositol: opening Pandora's box.Front Endocrinol (Lausanne). 2025 Apr 1;16:1399308. doi: 10.3389/fendo.2025.1399308. eCollection 2025. Front Endocrinol (Lausanne). 2025. PMID: 40235665 Free PMC article.
-
The Effects of Myo-Inositol and D-Chiro-Inositol in a Ratio 40:1 on Hormonal and Metabolic Profile in Women with Polycystic Ovary Syndrome Classified as Phenotype A by the Rotterdam Criteria and EMS-Type 1 by the EGOI Criteria.Gynecol Obstet Invest. 2024;89(2):131-139. doi: 10.1159/000536163. Epub 2024 Jan 31. Gynecol Obstet Invest. 2024. PMID: 38295772 Free PMC article.
-
The Role of Inositols in the Hyperandrogenic Phenotypes of PCOS: A Re-Reading of Larner's Results.Int J Mol Sci. 2023 Mar 27;24(7):6296. doi: 10.3390/ijms24076296. Int J Mol Sci. 2023. PMID: 37047265 Free PMC article. Review.
References
-
- Oakley O., Lin P.C., Bridges P., Ko C. Animal models for the study of polycystic ovarian syndrome. Endocrinol. Metab. 2011;26:193–202. doi: 10.3803/EnM.2011.26.3.193. - DOI
MeSH terms
Substances
Grants and funding
LinkOut - more resources
Full Text Sources
Medical
