

A Circulating Exosome RNA Signature Is a Potential Diagnostic Marker for Pancreatic Cancer, a Systematic Study
- PMID: 34073722
- PMCID: PMC8197236
- DOI: 10.3390/cancers13112565
A Circulating Exosome RNA Signature Is a Potential Diagnostic Marker for Pancreatic Cancer, a Systematic Study
Abstract
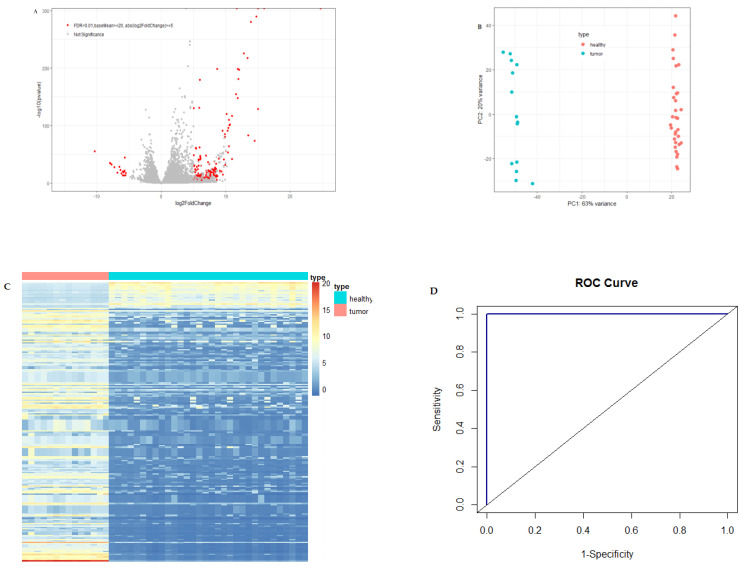
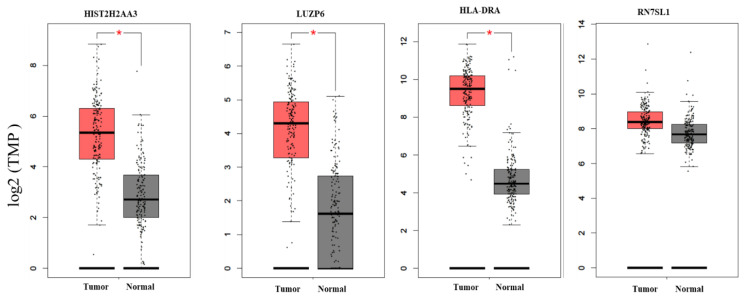
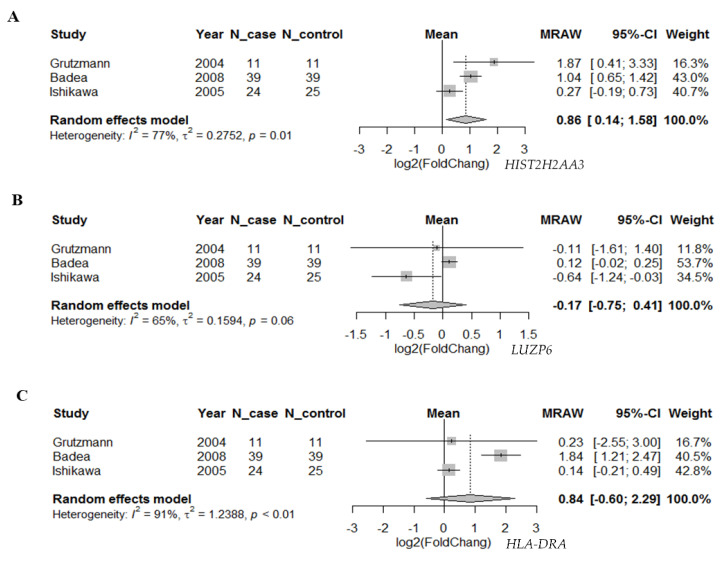
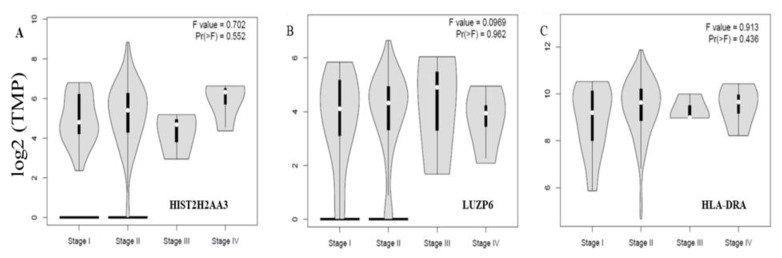
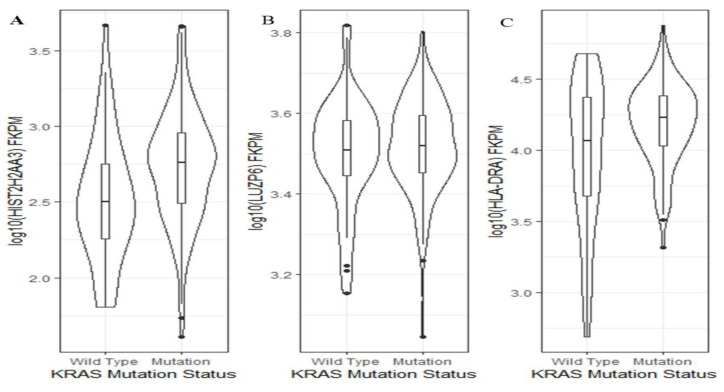
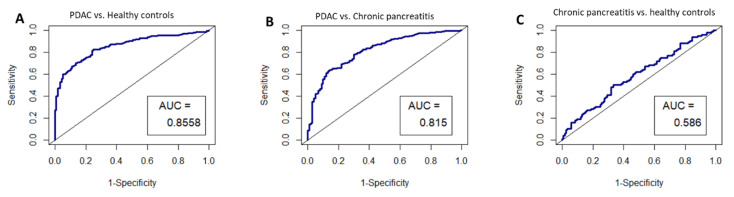
Several exosome proteins, miRNAs and KRAS mutations have been investigated in the hope of carrying out the early detection of pancreatic cancer with high sensitivity and specificity, but they have proven to be insufficient. Exosome RNAs, however, have not been extensively evaluated in the diagnosis of pancreatic cancer. The purpose of this study was to investigate the potential of circulating exosome RNAs in pancreatic cancer detection. By retrieving RNA-seq data from publicly accessed databases, differential expression and random-effects meta-analyses were performed. The results showed that pancreatic cancer had a distinct circulating exosome RNA signature in healthy individuals, and that the top 10 candidate exosome RNAs could distinguish patients from healthy individuals with an area under the curve (AUC) of 1.0. Three (HIST2H2AA3, LUZP6 and HLA-DRA) of the 10 genes in exosomes had similar differential patterns to those in tumor tissues based on RNA-seq data. In the validation dataset, the levels of these three genes in exosomes displayed good performance in distinguishing cancer from both chronic pancreatitis (AUC = 0.815) and healthy controls (AUC = 0.8558), whereas a slight difference existed between chronic pancreatitis and healthy controls (AUC = 0.586). Of the three genes, the level of HIST2H2AA3 was positively associated with KRAS status. However, there was no significant difference in the levels of the three genes across the disease stages (stages I-IV). These findings indicate that circulating exosome RNAs have a potential early detection value in pancreatic cancer, and that a distinct exosome RNA signature exists in distinguishing pancreatic cancer from healthy individuals.
Keywords: KRAS mutation; RNA signature; early detection; exosome; pancreatic cancer.
Conflict of interest statement
The authors declare no conflict of interest.
Figures
Similar articles
-
Detection of mutant KRAS and TP53 DNA in circulating exosomes from healthy individuals and patients with pancreatic cancer.Cancer Biol Ther. 2017 Mar 4;18(3):158-165. doi: 10.1080/15384047.2017.1281499. Epub 2017 Jan 25. Cancer Biol Ther. 2017. PMID: 28121262 Free PMC article.
-
Circulating pancreatic cancer exosomal RNAs for detection of pancreatic cancer.Mol Oncol. 2019 Feb;13(2):212-227. doi: 10.1002/1878-0261.12398. Epub 2018 Nov 15. Mol Oncol. 2019. PMID: 30358104 Free PMC article.
-
The diagnostic and prognostic value of exosome-derived long non-coding RNAs in cancer patients: a meta-analysis.Clin Exp Med. 2020 Aug;20(3):339-348. doi: 10.1007/s10238-020-00638-z. Epub 2020 Jun 5. Clin Exp Med. 2020. PMID: 32504320 Review.
-
Plasma extracellular vesicle long RNA profiling identifies a diagnostic signature for the detection of pancreatic ductal adenocarcinoma.Gut. 2020 Mar;69(3):540-550. doi: 10.1136/gutjnl-2019-318860. Epub 2019 Sep 27. Gut. 2020. PMID: 31562239
-
Circulating RNAs as new biomarkers for detecting pancreatic cancer.World J Gastroenterol. 2015 Jul 28;21(28):8527-40. doi: 10.3748/wjg.v21.i28.8527. World J Gastroenterol. 2015. PMID: 26229396 Free PMC article. Review.
Cited by
-
Extracellular vesicle biomarkers for pancreatic cancer diagnosis: a systematic review and meta-analysis.BMC Cancer. 2022 May 23;22(1):573. doi: 10.1186/s12885-022-09463-x. BMC Cancer. 2022. PMID: 35606727 Free PMC article.
-
Small extracellular vesicles (sEVs) in pancreatic cancer progression and diagnosis.J Control Release. 2025 Apr 10;380:269-282. doi: 10.1016/j.jconrel.2025.01.072. Epub 2025 Feb 6. J Control Release. 2025. PMID: 39889882 Review.
-
Functions and clinical applications of exosomes in pancreatic cancer.Mol Biol Rep. 2022 Nov;49(11):11037-11048. doi: 10.1007/s11033-022-07765-8. Epub 2022 Sep 12. Mol Biol Rep. 2022. PMID: 36097109 Free PMC article. Review.
-
Recent advances in exosome-based immunotherapy applied to cancer.Front Immunol. 2023 Nov 7;14:1296857. doi: 10.3389/fimmu.2023.1296857. eCollection 2023. Front Immunol. 2023. PMID: 38022585 Free PMC article. Review.
-
Fighting Fire with Fire: Exosomes and Acute Pancreatitis-Associated Acute Lung Injury.Bioengineering (Basel). 2022 Oct 26;9(11):615. doi: 10.3390/bioengineering9110615. Bioengineering (Basel). 2022. PMID: 36354526 Free PMC article. Review.
References
-
- Skog J., Wurdinger T., van Rijn S., Meijer D.H., Gainche L., Sena-Esteves M., Curry W.T., Jr., Carter B.S., Krichevsky A.M., Breakefield X.O. Glioblastoma microvesicles transport RNA and proteins that promote tumour growth and provide diagnostic biomarkers. Nat. Cell Biol. 2008;10:1470–1476. doi: 10.1038/ncb1800. - DOI - PMC - PubMed
Grants and funding
LinkOut - more resources
Full Text Sources
Research Materials
Miscellaneous
