Review
. 2021 May 24;8(6):441.
doi: 10.3390/children8060441.

Single Ventricle-A Comprehensive Review

Affiliations
Review

Single Ventricle-A Comprehensive Review

P Syamasundar Rao. Children (Basel). .

Abstract

In this paper, the author enumerates cardiac defects with a functionally single ventricle, summarizes single ventricle physiology, presents a summary of management strategies to address the single ventricle defects, goes over the steps of staged total cavo-pulmonary connection, cites the prevalence of inter-stage mortality, names the causes of inter-stage mortality, discusses strategies to address the inter-stage mortality, reviews post-Fontan issues, and introduces alternative approaches to Fontan circulation.

Keywords: Down syndrome; Fontan circulation; biventricular repair; double-inlet left ventricle; heterotaxy syndromes; hypoplastic left heart syndrome; mitral atresia with normal aortic root; single ventricle; tricuspid atresia; unbalanced atrioventricular septal defect.


Conflict of interest statement

The author declares no conflict of interest.

Figures
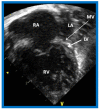
Figure 1
Figure 1
Echocardiogram in an apical 4-chamber view of a baby with hypoplastic left heart syndrome, showing a strikingly small, slit-like (thick arrow) left ventricle (LV), obviously enlarged and hypertrophied right ventricle (RV), and a dilated right atrium (RA). The atretic mitral valve (MV) (thin arrow) and hypoplastic left atrium (LA) are also seen.
Figure 2
Figure 2
Echocardiogram in a parasternal long short axis view of a baby with hypoplastic left heart syndrome illustrates a small left ventricle (LV), a severely hypoplastic aorta (Ao) (arrow), and an enlarged right ventricle (RV). LA, left atrium.
Figure 3
Figure 3
Echocardiograms in apical four-chamber views of an infant with tricuspid atresia demonstrating a dilated left ventricle (LV), a small right ventricle (RV), and a dense band of echoes at the site where the tricuspid valve echo should be (ATV; thick arrow). Images with closed (A) and open (B) mitral valve are shown; the tricuspid valve remains closed in both situations. A ventricular septal defect (VSD; thin arrow) is also shown. LA, Left atrium; RA, Right atrium.
Figure 4
Figure 4
Echocardiograms in apical four-chamber views of a baby with double inlet left ventricle (DILV) with closed (A) and open (B) atrioventricular valves (arrows). The outlet chamber is not visualized in this view. LA, left atrium; RA, right atrium. Reproduced from Reference [15].
Figure 5
Figure 5
Echocardiograms in apical four-chamber views of an infant with complete atrioventricular septal defect with marked hypoplasia of the left ventricle (LV). LV in diastole (A) and in systole (B) are shown. LA, left atrium; RA, right atrium; RV, right ventricle.
Figure 6
Figure 6
Echocardiograms in modified four-chamber views of two infants with mitral atresia, demonstrating atretic mitral valves (AMV), indicated by thick arrows. A small left atrium (LA) and left ventricle (LV) and a large right ventricle (RV) are also seen. The thin arrow in (B) shows a restrictive patent foramen ovale (PFO). All four chambers were shown in (A) while (B) focuses on the atria. Reproduced from Reference [15].
Figure 7
Figure 7
Diagram illustrating normal circulation in series (see the text) resulting systemic arterial oxygen saturation of ≥96%.
Figure 8
Figure 8
Diagrammatic portrayal of single ventricle circulation; the blood from both the lungs and body return to the single ventricle; this mixed blood is redistributed to the lungs (Qp) and body (Qs). Reproduced with permission from Reference [30].
Figure 9
Figure 9
Cine-angiograms demonstrating patent Gore-Tex grafts (GG) following modified Blalock-Taussig (BT) shunt surgery in two patients. Note wide-open BT shunts with good visualization of the pulmonary artery (PA) in (A) of the right (RPA) and left (LPA) pulmonary arteries in (B).
Figure 10
Figure 10
(A) Diagrammatic portrayal of pulmonary artery banding (PB) for infants with markedly elevated pulmonary blood flow and congestive heart failure. (B) Selected cine frame form pulmonary artery cineangiogram in straight lateral view demonstrating constriction of the pulmonary artery (PB; arrow) in an infant who had the banding procedure. C, catheter; LPA, left pulmonary artery; NG, nasogastric tube; PG, pigtail catheter; RPA, right pulmonary artery.
Figure 11
Figure 11
Cineangiogrames demonstrating the Norwood procedure, showing the neoaorta (NAo) and hypoplastic old aorta (HAo). The latter supplies the coronary arteries (CAs) as shown in (a). A Blalock-Taussig (BT) shunt in seen in (b) and a Sano shunt in (c) from two other babies are also shown. This is Stage I of the Fontan procedure for infants with hypoplastic left heart syndrome. LPA, left pulmonary artery; RPA, right pulmonary artery. Reproduced from Reference [33].
Figure 12
Figure 12
Cinfluroscopic frames demonstrating the procedure of Rashkind’s balloon septostomy. Initially the balloon is inflated in the left atrium (A). The balloon septostomy catheter (BSC) is rapidly and forcefully pulled into the right atrium (B) and inferior vena cava (C,D) and quickly advanced back into the right atrium (E,F). The entire procedure is done as one single motion. Rapid advancement of the BSC into the right atrium (E,F) is done in order to avoid inadvertent occlusion of the inferior vena cava if failure to deflate the balloon occurs (this is quite rare). At about the same time the balloon is deflated. ET, endotracheal tube; NG, nasogastric tube; UAC, umbilical arterial catheter; UVC, umbilical venous catheter.
Figure 13
Figure 13
A Line drawing illustrating Damus-Kaye-Stansel procedure. The left ventricular (LV) blood flows via the ventricular septal defect (circle) and right ventricle (RV) into the aorta (Ao). If the VSD is small and restrictive, causing “subaortic” obstruction, this obstruction may be circumvented by connecting the proximal stump of the divided pulmonary artery to the Ao directly or a via a non-valved conduit. The pulmonary arteries are supplied with a Blalock-Taussig shunt. Concept derived from References [13,14].
Figure 14
Figure 14
Cineangiographic frames illustrating bidirectional Glenn procedure, i.e., anastomosis of the superior vena cava (SVC) to the right pulmonary artery (RPA)] in two different children is shown in (a,b) (Stage II). Unobstructed blood flow from the SVC to the right (RPA) and left (LPA) pulmonary arteries is seen. Reproduced from Reference [33].
Figure 15
Figure 15
Cineangiographic frames demonstrating a bilateral bidirectional Glenn procedure (Stage II). In (a), angiogram of the superior vena cava (SVC) illustrates opacification of the right pulmonary artery (RPA). The arrow in (a) shows the unopacified blood from a persistent left superior vena cava (PLSVC). In (b), an injection into the PLSVC illustrates opacification of the left pulmonary artery (LPA). The arrow in (b) shows the unopacified blood from the right SVC. Unobstructed flow from the respective SVCs into the pulmonary arteries is clearly seen. Reproduced from Reference [33].
Figure 16
Figure 16
Cineangiographic frames in postero-anterior (a) and lateral (b) projections, illustrating Stage IIIA of the Fontan procedure in which the inferior vena caval (IVC) blood flow is diverted into the pulmonary arteries via a non-valve conduit (Cond). The flow via the fenestration (Fen) is shown by the arrows in a and b. HV, hepatic veins; LPA, left pulmonary artery; PG, pigtail catheter in the descending aorta; RPA, right pulmonary artery. Modified from Reference [33].
Figure 17
Figure 17
(a). Cineangiogram in antero-posterior view, illustrating Stage IIIA of the Fontan operation, diverting the inferior vena caval (IVC) blood flow into the pulmonary arteries via a non-valve conduit (Cond). Fenestration (Fen) is shown by the arrow in (a). The Fen is occluded with an Amplatzer device (D), shown by the arrow in (b) (Stage IIIB). HV, hepatic veins; LPA, left pulmonary artery; RPA, right pulmonary artery. Reproduced from Reference [33].
Figure 18
Figure 18
Cineradiographic frames demonstrating balloon angioplasty procedures to widen the patent foramen ovale. Inflated balloons in lateral (A,B) and posterior-anterior (C,D) projections in two different neonates, illustrating the waisting of the balloons (arrows in A,C) during the initial phases of balloon angioplasty. The waisting was fully abolished on further inflation of the balloons (B,D). Reproduced from Reference [89].
Figure 19
Figure 19
Selected cine (A) and video (B) frames demonstrating the location of the stent (St) across the atrial septum following St deployment. LA, left atrium; RA, right atrium; PG, pigtail catheter in the descending aorta. Reproduced from Reference [89].
Figure 20
Figure 20
Video frame of the stent (St) (short arrows) demonstrates laminar flow (LF) (long arrow) across it. LA, left atrium; RA, right atrium. Reproduced from Reference [89].
Figure 21
Figure 21
Cineradiographic frames in 20° left anterior oblique view demonstrating a balloon angioplasty catheter placed across the aortic coarctation. Note waisting (arrow) of the balloon (A) during the initial phases of balloon inflation, which was abolished (B) on further inflation of the balloon. AAo, ascending aorta; DAo, descending aorta; ET, endotracheal tube; GW, guide wire; NG, nasogastric tube. Modified from Reference [90].
Figure 22
Figure 22
Bar graph illustrating the fall (p < 0.001) of the peak-to peak systolic pressure gradients (in mmHg) across the aortic coarctation following balloon angioplasty. The reduction in the gradients was seen for all the infant group (left panel) and for all the three subgroups: Balloon angioplasty via trans-umbilical arterial (UA), trans-femoral arterial (FA), and trans-femoral venous anterograde (FVA) routes. The mean and standard deviation (SD) are marked. N represents the number of subjects in each group. Modified from Reference [70].
Figure 23
Figure 23
Cineangiographic frames from aortic arch angiograms in a 20° left anterior oblique views, illustrating a narrowed (coarcted) aortic segment (arrow) priot to balloon angioplasty (A) which improved following balloon angioplasty (B). Note mild hypoplasia of the distal transverse aortic arch and isthmus. AAo, ascending aorta; DAo, descending aorta; LCC, left common carotid artery; LSA, left subclavian artery; NG, nasogastric tube; PG, pigtail catheter; RInn. right innominate artery. Modified from Reference [90].
Figure 24
Figure 24
Cineangiographic frames from aortic arch angiograms in 20° left anterior oblique projection, illustrating a coarcted aortic segment (white arrow) prior to balloon angioplasty (A) which widened (black arrow) following balloon angioplasty (B) in a neonate who had had the Norwood procedure earlier. DAo, descending aorta; LCC, left common carotid artery; LSA, left subclavian artery; PG, pigtail catheter; RCC, right common carotid artery; RInn, right innominate artery. Reproduced from Reference [58].
Figure 25
Figure 25
Cineangiographic frames from aortic arch angiograms in straight lateral projection showing a post-surgical recoarcted aortic segment (arrow) priot to balloon angioplasty (A) which improved (arrow) following balloon dilatation (B), in a neonate who developed recoarctation at three weeks of age after neonatal surgical repair of coarctation. DAo, descending aorta; LSA, left subclavian artery; NG, nasogastric tube. Reproduced from Reference [58].
Figure 26
Figure 26
(A). Cineangiographic frames in a 30° right anterior oblique view illustrating long-segment right pulmonary artery (RPA) stenosis (arrow) before implantation of stent (St). The position of the St prior to (B) and following (C) balloon inflation to implant the St are shown. (D). Angiography following St implantation shows improvement. Note trivial residual narrowing (top arrow) in (D). C, catheter; LPA St, left pulmonary artery stent implanted just prior to RPA stent implantation. Sh, sheath; PIG, pigtail catheter. Reproduced from Reference [98].
Figure 27
Figure 27
Selected cineangiographic frame demonstrating clotted Blalock-Taussig (CBT) shunt (A). After unsuccessful recanalization with mechanical thrombolysis and balloon angioplasty, a stent (St) was implanted (B). Angiography with tip of the catheter (C) in the proximal portion of the stent showed complete opening of the BT shunt with visualization of right (RPA) and left (LPA) pulmonary arteries. LSA, left subclavian artery. Reproduced from Reference [61].
Figure 28
Figure 28
(A) Selected cine frame in a postero-anterior view, demonstrating discrete narrowing (arrow) of a modified Blalock-Taussig (MBT) shunt. (B). Following stent implantation, this site is wide open (arrow in (B)). DAo, descending aorta; LPA, left pulmonary artery; RPA, right pulmonary artery. Reproduced from Reference [58].
Figure 29
Figure 29
(A). Cineangiographic frame in a caudal angulation, demonstrating a narrowed (arrow) Sano shunt in a baby with hypoplastic left heart syndrome. (B). A stent (St) catheter is placed across the narrowed site with the guide wire positioned deep into the right pulmonary artery (RPA). (C). Note the wide-open (arrow) Sano shunt after the stent was implanted across the narrowed segment. LPA, left pulmonary artery; PG, pigtail catheter. Reproduced from Reference [58].
Figure 30
Figure 30
Selected cine frames in postero-anterior (A), lateral (B) and sitting-up (C) views, showing the position of a stent (St) placed within the ductus via a purse-string suture in the pulmonary artery in a premature neonate with hypoplastic left heart syndrome during a hybrid procedure. NG, naso-gastric tube; RHC, right heart catheter. Sternal wires are seen. Reproduced from Reference [58].
Figure 31
Figure 31
Selected cine frames in sitting-up (A) and right anterior oblique (B) views from a right ventricular (RV) angiogram, demonstrating the position of a stent (STENT) placed within the ductus via a purse-string suture in the pulmonary artery during a hybrid procedure, in a premature infant with hypoplastic left heart syndrome shown in Figure 30. Note the opacification of the descending aorta (DAo) via the stent. Bands placed during the hybrid procedure around the right (RPA) (in B) and left (LPA) (in A) pulmonary arteries are seen. ARCH, aortic arch opacified retrogradely via the STENT. NG, naso-gastric tube.

References

    1. Rao P.S. Diagnosis and management of cyanotic congenital heart disease: Part II. Indian. J. Pediatr. 2009;76:297–308. doi: 10.1007/s12098-009-0030-4. - DOI - PubMed
    1. Noonan J.A., Nadas A.S. The hypoplastic left heart syndrome. Pediat. Clin. N. Am. 1958;5:1029–1056. doi: 10.1016/S0031-3955(16)30727-1. - DOI - PubMed
    1. Rao P.S., Striepe V., Kambam J. Hypoplastic left heart syndrome. In: Kambam J., editor. Cardiac Anesthesia for Infants and Children. Mosby-Year Book; St. Louis, MO, USA: 1994. pp. 296–309.
    1. Alapati S., Rao P.S. Hypoplastic Left Heart Syndrome in the Neonate. Neonatol. Today. 2011;6:1–9.
    1. Rao P.S., Alapati S. Hypoplastic left heart syndrome. In: Vijayalakshmi I.B., Rao P.S., Chugh R., editors. A Comprehensive Approach to Management of Congenital Heart Diseases. Jaypee Publications; New Delhi, India: 2013. pp. 662–678.

LinkOut - more resources