. 2021 May 24;13(11):2567.
doi: 10.3390/cancers13112567.

Mathematical Modelling Based on In Vivo Imaging Suggests CD137-Stimulated Cytotoxic T Lymphocytes Exert Superior Tumour Control Due to an Enhanced Antimitotic Effect on Tumour Cells

Affiliations

Mathematical Modelling Based on In Vivo Imaging Suggests CD137-Stimulated Cytotoxic T Lymphocytes Exert Superior Tumour Control Due to an Enhanced Antimitotic Effect on Tumour Cells

Richard J Beck et al. Cancers (Basel). .

Abstract

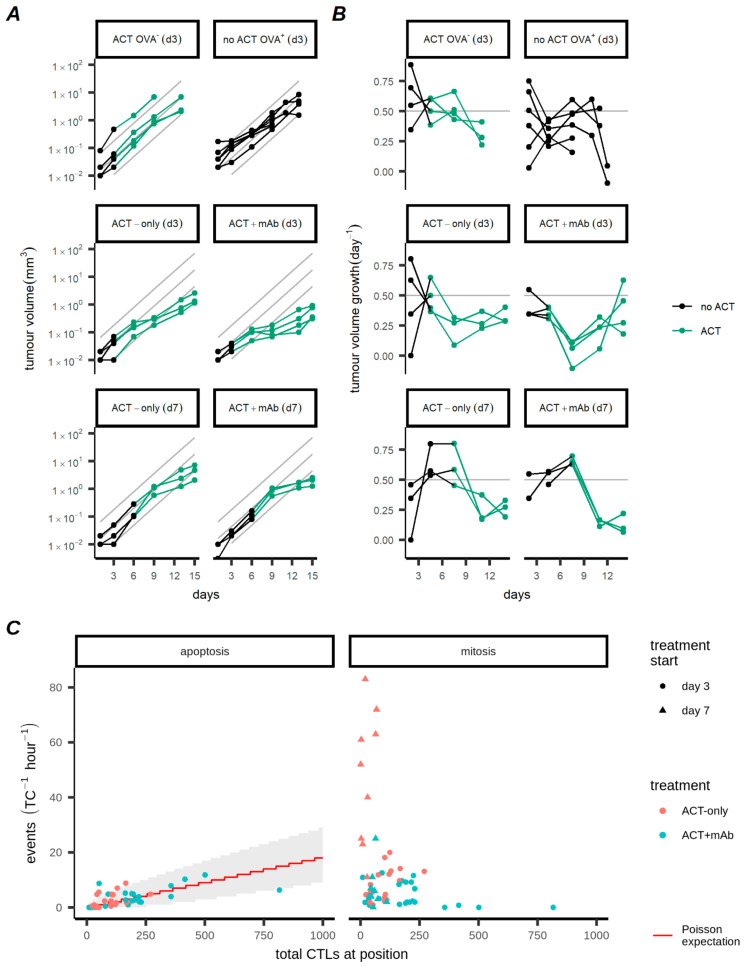
Several immunotherapeutic strategies for the treatment of cancer are under development. Two prominent strategies are adoptive cell transfer (ACT) of CTLs and modulation of CTL function with immune checkpoint inhibitors or with costimulatory antibodies. Despite some success with these approaches, there remains a lack of detailed and quantitative descriptions of the events following CTL transfer and the impact of immunomodulation. Here, we have applied ordinary differential equation models to two photon imaging data derived from a B16F10 murine melanoma. Models were parameterised with data from two different treatment conditions: either ACT-only, or ACT with intratumoural costimulation using a CD137 targeted antibody. Model dynamics and best fitting parameters were compared, in order to assess the mode of action of the CTLs and examine how the CD137 antibody influenced their activities. We found that the cytolytic activity of the transferred CTLs was minimal without CD137 costimulation, and that the CD137 targeted antibody did not enhance the per-capita killing ability of the transferred CTLs. Instead, the results of our modelling study suggest that an antiproliferative effect of CTLs exerted upon the tumour likely accounted for the majority of the reduction in tumour growth after CTL transfer. Moreover, we found that CD137 most likely improved tumour control via enhancement of this antiproliferative effect, as well as prolonging the period in which CTLs were inside the tumour, leading to a sustained duration of their antitumour effects following CD137 stimulation.

Keywords: CD137; T cells; cytotoxic T lymphocytes; immunotherapy; mathematical modelling; ordinary differential equations; tumour.


Conflict of interest statement

The authors declare no conflict of interest.

Figures

Figure 1
Figure 1
Comparison of apoptosis and mitosis rates for tumour cells and CTLs. (A,B) Apoptosis and mitosis rates of tumour cells (A) or CTLs (B) with or without anti-CD137 (columns). Each small point represents two simultaneous apoptosis (x-axis) and mitosis (y-axis) rates measured at one site within a tumour. Points are coloured based on the day of measurement, and different mice are indicated by shape. Large points are the mean values per position/day; these are connected by solid black lines for cases where we have intravital measurements on both days 6 and 9 from the same mouse. The red dashed line marks net zero population growth. (C,D) Apoptosis and mitosis rates of tumour cells (C) or CTLs (D) where point size indicates the total number of cells recorded per site. Segments connect all points from the same mouse imaged on the same day. Each colour represents a different mouse. (E,F) Change in the apoptosis and mitosis rates of tumour cells (E) or CTLs (F) based on intravital data for two mice per condition (constructed via linear translation of the mean values in A,B such that the day 6 measurement lies at the origin). Points are coloured based on the day of measurement, and different mice are indicated by shape.
Figure 2
Figure 2
Impact of CTLs on the population dynamics of tumour cells. (A) Tumour volume measurements over time. Row 1: control tumours, either treated with ACT 3 days after inoculation but not expressing OVA (top left), or OVA expressing tumours not treated with ACT (top right). Rows 2 and 3: OVA expressing tumours treated with ACT 3 days (row 2) or 7 days (row 3) after inoculation, without anti-CD137 (left) or with anti-CD137 (right). (B) Volumetric growth rates of tumours corresponding to (A). Estimates of tumour growth rate are made over the interval between two successive volume measurements. Points representing estimates are displayed at the midpoint of the interval. Treatments for conditions are indicated in facet labels. Points in (A,B) are connected with straight lines visualizing the trajectories for individual mice. Points/lines corresponding to mice that had not (yet) received ACT are black, and green indicates that mice have received ACT. Grey lines in (A,B) represent the estimated growth rate of 0.5 day−1. (C) Relationship between the number of TC apoptosis events (left panel) or mitosis events (right panel) vs. number of CTLs per position. TC apoptosis and mitosis events are normalised (hour−1) to account for differences in imaging time between positions. The expected number of kills per hour (red line) and 5–95% confidence interval (shaded region) are shown for a Poisson process where individual CTLs kill at a constant rate (0.44 CTL−1 day−1). See also Figure S3 for day 7 mitosis data.
Figure 3
Figure 3
ODE model linking intravital and volumetric measurements from ACT treated tumours. (A) Examples of imaged positions with varying numbers of tumour cells, shown with their presumed location inside the tumour (circle). (B) Schematic of ODE model. (C) Best fitting parameters for the ODE model. Each point represents 1 of 5 fits using the stochastic evolutionary algorithm. Horizontal lines represent the mean fitted parameter for either ACT-only (red) or ACT+mAb (blue) conditions.
Figure 4
Figure 4
Relative impacts of antiproliferative and killing effects of adoptively transferred CTLs. (A,B) Impact of varying the killing rate (ke; A) and the rate parameter for induction of antiproliferative effect (kq; B). Using the best fitting parameter sets, both rates were multiplied by a factor of 0, 1, 3 or 4 (indicated by columns). Parameters with hats represent best fitting values.
Figure 5
Figure 5
Enhanced antiproliferative effect and extended effector window of CD137 stimulated CTLs. (AF) Results of parameter estimation. Model output represented by lines, data plotted as mean and s.d. Shown are observed and fitted process rates (A,B), effector:target ratio (C,D) and net tumour growth (E,F) for either tumours treated on day 3 (A,C,E) or day 7 (B,D,F). Process rates considered in (A,B) are: TCm (Tumour Cell mitosis); killing (of tumour cells by CTLs); CTLm (CTL mitosis); CTLa (CTL apoptosis).

Similar articles

Cited by

References

    1. Tang J., Pearce L., O’Donnell-Tormey J., Hubbard-Lucey V.M. Trends in the global immuno-oncology landscape. Nat. Rev. Drug Discov. 2018;17:783–784. doi: 10.1038/nrd.2018.167. - DOI - PubMed
    1. Tang J., Shalabi A., Hubbard-Lucey V.M. Comprehensive analysis of the clinical immuno-oncology landscape. Ann. Oncol. 2018;29:84–91. doi: 10.1093/annonc/mdx755. - DOI - PubMed
    1. Hegde U.P., Mukherji B. Current status of chimeric antigen receptor engineered T cell-based and immune checkpoint blockade-based cancer immunotherapies. Cancer Immunol. Immunother. 2017;66:1113–1121. doi: 10.1007/s00262-017-2007-x. - DOI - PMC - PubMed
    1. Sun L., Zhang L., Yu J., Zhang Y., Pang X., Ma C. Clinical efficacy and safety of anti-PD-1/PD-L1 inhibitors for the treatment of advanced or metastatic cancer: A systematic review and meta-analysis. Sci. Rep. 2020;10:2083. doi: 10.1038/s41598-020-58674-4. - DOI - PMC - PubMed
    1. Rotte A. Combination of CTLA-4 and PD-1 blockers for treatment of cancer. J. Exp. Clin. Cancer Res. 2019;38:255. doi: 10.1186/s13046-019-1259-z. - DOI - PMC - PubMed