

Disease or drought: environmental fluctuations release zebra from a potential pathogen-triggered ecological trap
- PMID: 34074118
- PMCID: PMC8170208
- DOI: 10.1098/rspb.2021.0582
Disease or drought: environmental fluctuations release zebra from a potential pathogen-triggered ecological trap
Abstract
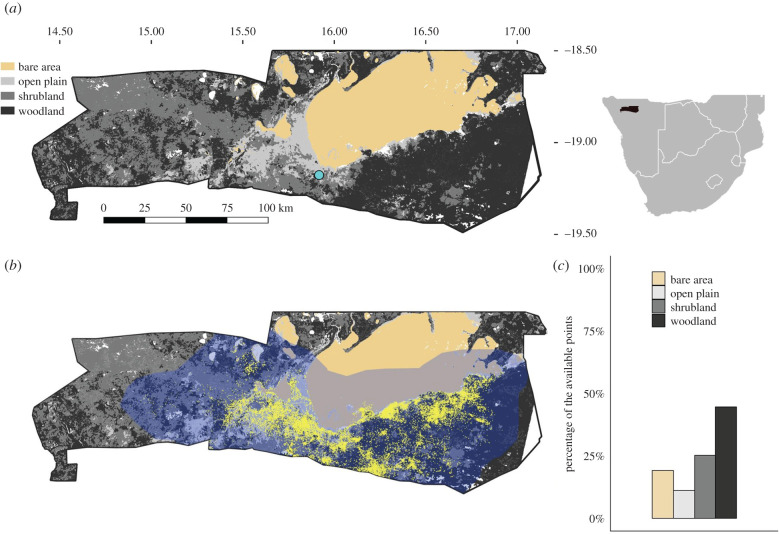
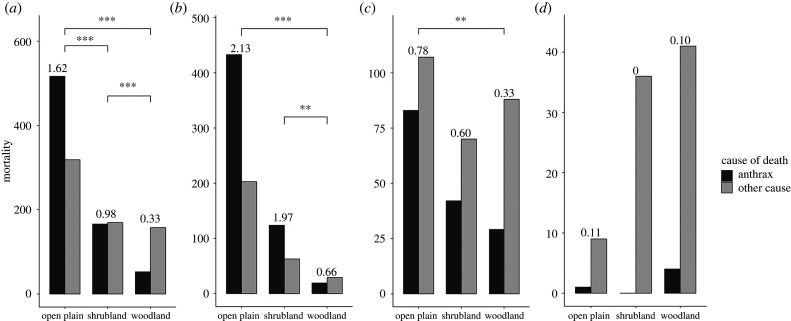
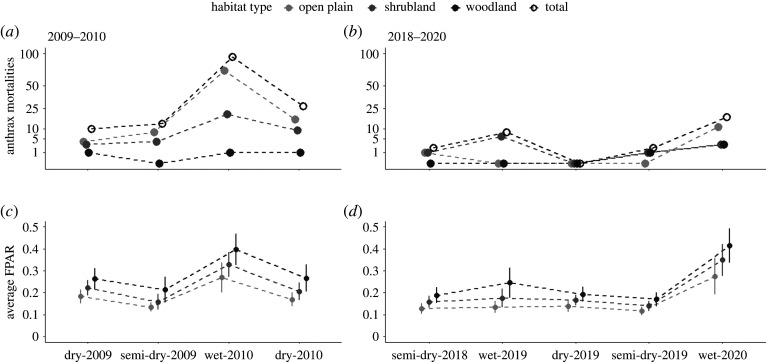
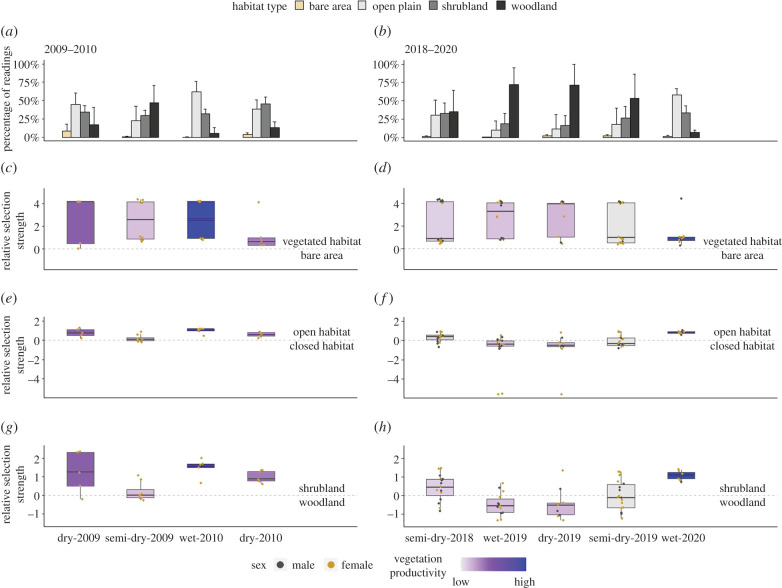
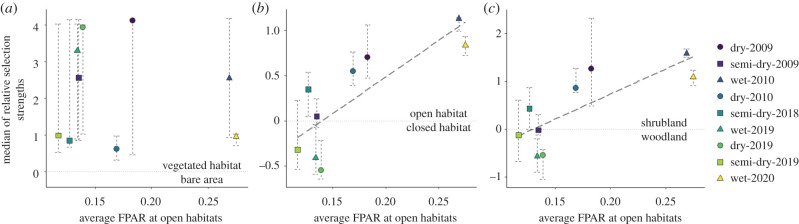
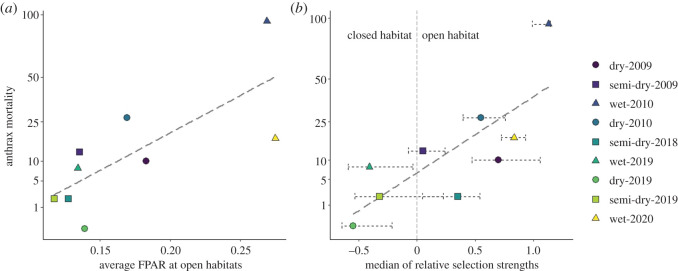
When a transmission hotspot for an environmentally persistent pathogen establishes in otherwise high-quality habitat, the disease may exert a strong impact on a host population. However, fluctuating environmental conditions lead to heterogeneity in habitat quality and animal habitat preference, which may interrupt the overlap between selected and risky habitats. We evaluated spatio-temporal patterns in anthrax mortalities in a plains zebra (Equus quagga) population in Etosha National Park, Namibia, incorporating remote-sensing and host telemetry data. A higher proportion of anthrax mortalities of herbivores was detected in open habitats than in other habitat types. Resource selection functions showed that the zebra population shifted habitat selection in response to changes in rainfall and vegetation productivity. Average to high rainfall years supported larger anthrax outbreaks, with animals congregating in preferred open habitats, while a severe drought forced animals into otherwise less preferred habitats, leading to few anthrax mortalities. Thus, the timing of anthrax outbreaks was congruent with preference for open plains habitats and a corresponding increase in pathogen exposure. Given shifts in habitat preference, the overlap in high-quality habitat and high-risk habitat is intermittent, reducing the adverse consequences for the population.
Keywords: anthrax; disease dynamics; ecological trap; environmental transmission; habitat selection; transmission hotspot.
Figures
Similar articles
-
Immunological Evidence of Variation in Exposure and Immune Response to Bacillus anthracis in Herbivores of Kruger and Etosha National Parks.Front Immunol. 2022 Feb 14;13:814031. doi: 10.3389/fimmu.2022.814031. eCollection 2022. Front Immunol. 2022. PMID: 35237267 Free PMC article.
-
Gastrointestinal helminths may affect host susceptibility to anthrax through seasonal immune trade-offs.BMC Ecol. 2014 Nov 12;14:27. doi: 10.1186/s12898-014-0027-3. BMC Ecol. 2014. PMID: 25388877 Free PMC article.
-
DUST-BATHING BEHAVIORS OF AFRICAN HERBIVORES AND THE POTENTIAL RISK OF INHALATIONAL ANTHRAX.J Wildl Dis. 2018 Jan;54(1):34-44. doi: 10.7589/2017-04-069. Epub 2017 Oct 20. J Wildl Dis. 2018. PMID: 29053428
-
Spores and soil from six sides: interdisciplinarity and the environmental biology of anthrax (Bacillus anthracis).Biol Rev Camb Philos Soc. 2018 Nov;93(4):1813-1831. doi: 10.1111/brv.12420. Epub 2018 May 6. Biol Rev Camb Philos Soc. 2018. PMID: 29732670 Review.
-
Impacts of human-induced environmental change in wetlands on aquatic animals.Biol Rev Camb Philos Soc. 2018 Feb;93(1):529-554. doi: 10.1111/brv.12358. Epub 2017 Sep 19. Biol Rev Camb Philos Soc. 2018. PMID: 28929570 Review.
Cited by
-
Immunological Evidence of Variation in Exposure and Immune Response to Bacillus anthracis in Herbivores of Kruger and Etosha National Parks.Front Immunol. 2022 Feb 14;13:814031. doi: 10.3389/fimmu.2022.814031. eCollection 2022. Front Immunol. 2022. PMID: 35237267 Free PMC article.
-
Seasonal changes in network connectivity and consequences for pathogen transmission in a solitary carnivore.Sci Rep. 2023 Oct 18;13(1):17802. doi: 10.1038/s41598-023-44815-y. Sci Rep. 2023. PMID: 37853051 Free PMC article.
-
Season of death, pathogen persistence and wildlife behaviour alter number of anthrax secondary infections from environmental reservoirs.Proc Biol Sci. 2024 Feb 14;291(2016):20232568. doi: 10.1098/rspb.2023.2568. Epub 2024 Feb 7. Proc Biol Sci. 2024. PMID: 38320613 Free PMC article.
-
The importance of peripheral populations in the face of novel environmental change.Proc Biol Sci. 2025 Jan;292(2038):20242331. doi: 10.1098/rspb.2024.2331. Epub 2025 Jan 8. Proc Biol Sci. 2025. PMID: 39772955 Free PMC article.
-
Variation in herbivore space use: comparing two savanna ecosystems with different anthrax outbreak patterns in southern Africa.Mov Ecol. 2023 Jul 31;11(1):46. doi: 10.1186/s40462-023-00385-2. Mov Ecol. 2023. PMID: 37525286 Free PMC article.
References
-
- Johnson MD. 2007. Measuring habitat quality: a review. Condor 109, 489-504. (10.1093/condor/109.3.489) - DOI
-
- Skagen SK, Knopf FL. 1994. Migrating shorebirds and habitat dynamics at a prairie wetland complex. Wilson Bull. 106, 91-105.
-
- Nielsen SE, McDermid G, Stenhouse GB, Boyce MS. 2010. Dynamic wildlife habitat models: seasonal foods and mortality risk predict occupancy-abundance and habitat selection in grizzly bears. Biol. Conserv. 143, 1623-1634. (10.1016/j.biocon.2010.04.007) - DOI
-
- Betts MG, Rodenhouse NL, Scott Sillett T, Doran PJ, Holmes RT. 2008. Dynamic occupancy models reveal within-breeding season movement up a habitat quality gradient by a migratory songbird. Ecography 31, 592-600. (10.1111/j.0906-7590.2008.05490.x) - DOI
-
- McGarigal K, Wan HY, Zeller KA, Timm BC, Cushman SA. 2016. Multi-scale habitat selection modeling: a review and outlook. Landsc. Ecol. 31, 1161-1175. (10.1007/s10980-016-0374-x) - DOI
