Comparative Study
. 2021 Jun 1;9(2):E592-E601.
doi: 10.9778/cmajo.20200313. Print 2021 Apr-Jun.

Changes in presentation, presenting severity and disposition among patients accessing emergency services during the first months of the COVID-19 pandemic in Calgary, Alberta: a descriptive study

Affiliations
Comparative Study

Changes in presentation, presenting severity and disposition among patients accessing emergency services during the first months of the COVID-19 pandemic in Calgary, Alberta: a descriptive study

Daniel J Lane et al. CMAJ Open. .

Abstract

Background: The COVID-19 pandemic has resulted in unique pressures on the emergency services system. This study describes changes in the presentation, presenting severity and disposition of patients accessing emergency services in Calgary, Alberta, during the first wave of the pandemic.

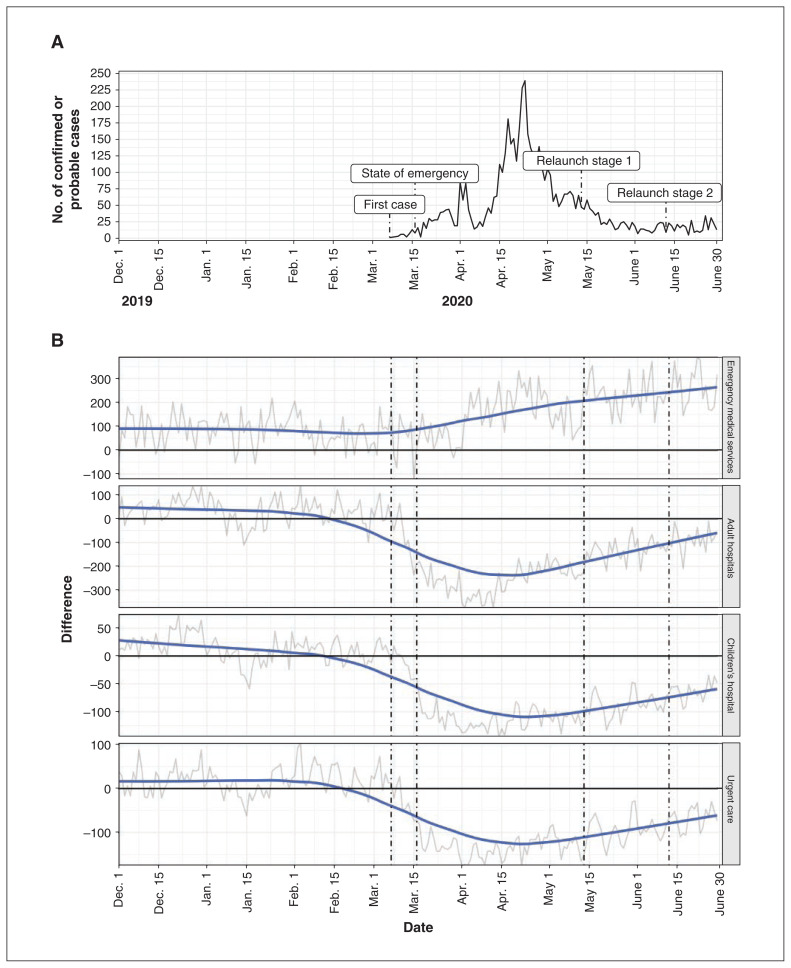
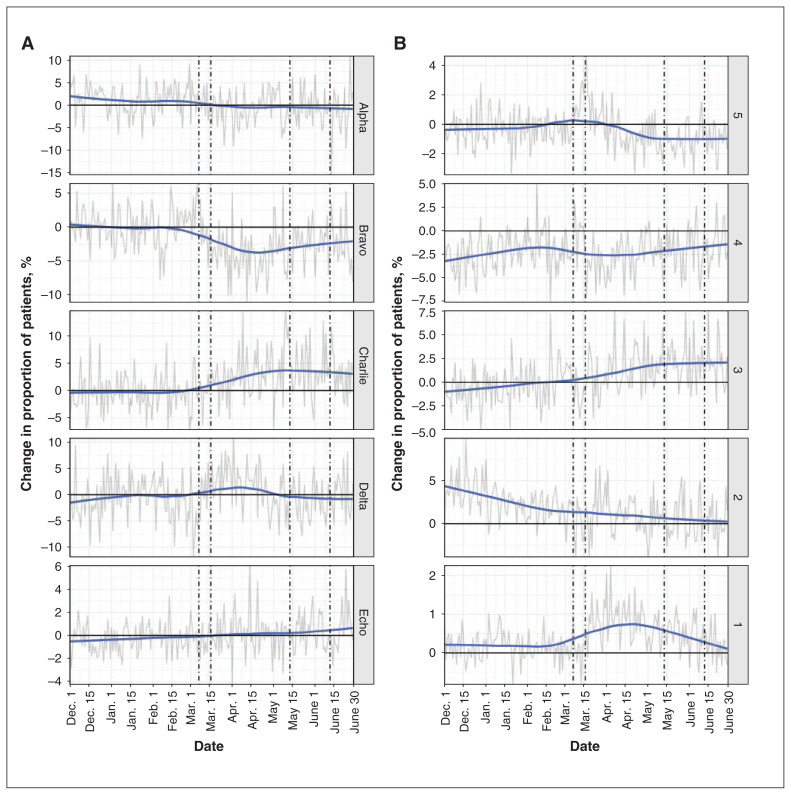
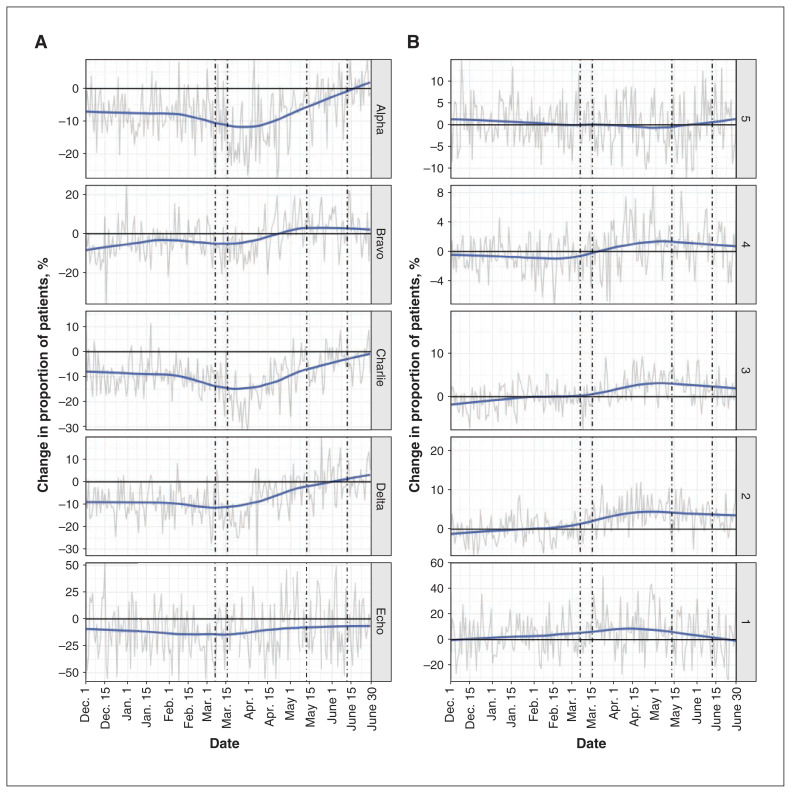
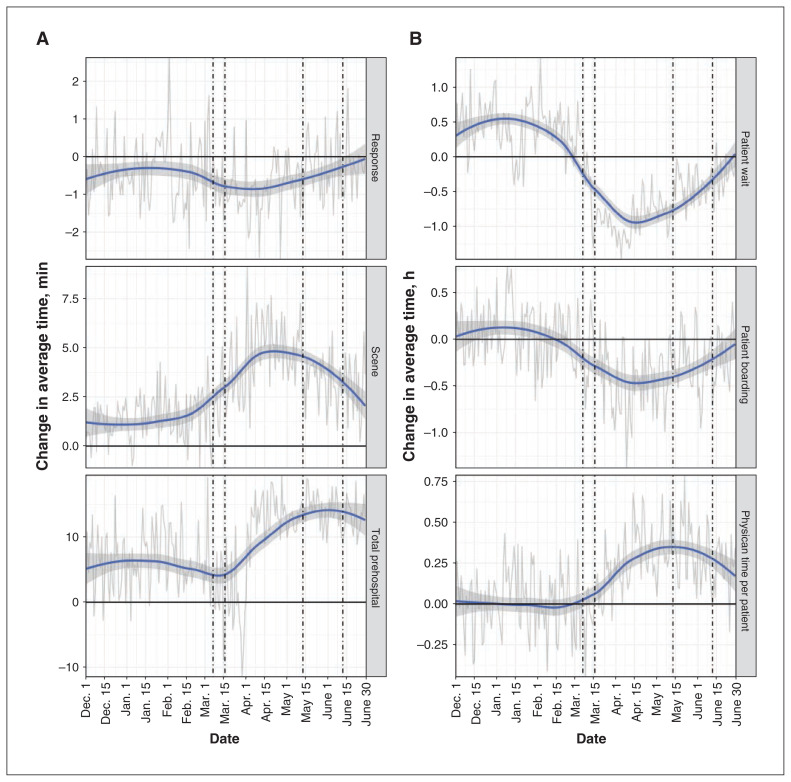
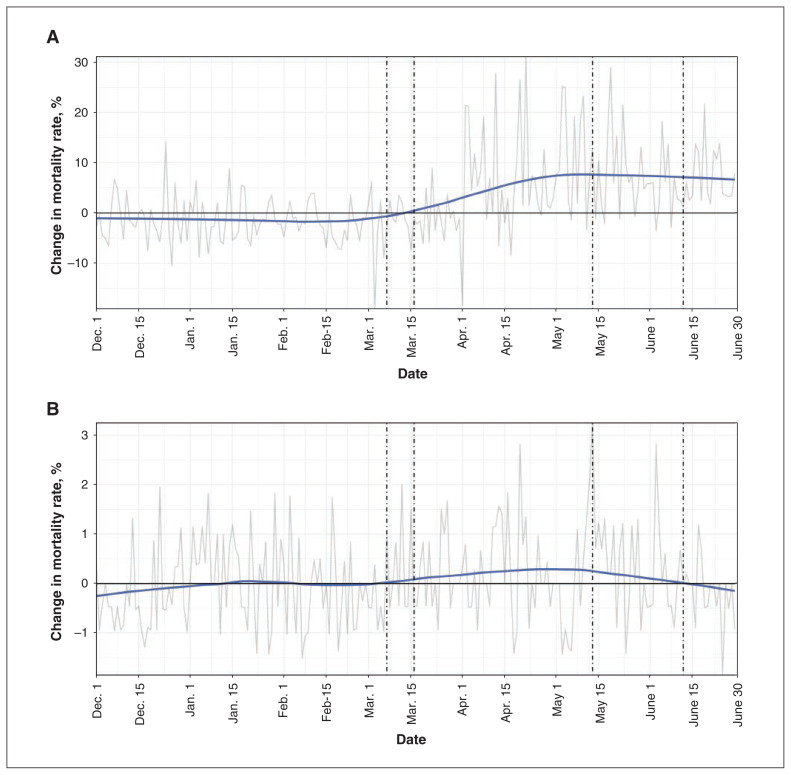
Methods: In this descriptive study, we constructed a population cohort of all patients who accessed emergency services by calling emergency medical services (EMS) (ambulance service that provides prehospital treatment and transport to medical facilities) or presenting directly to an emergency department (4 adult and 1 pediatric) or 2 urgent care centres in Calgary during the exposure period (December 2019 to June 2020) compared to 2 historical control periods (December to June, 2017-2018 and 2018-2019) combined. Outcomes included frequency of presentation, system flow indicators, patient severity, disposition and mortality. We used a locally estimated scatterplot smoothing function to visualize trends. We described differences at the maximum and minimum point of the exposure period compared to the control period.

Results: A total of 1 127 014 patient encounters were included. Compared to the control period, there was a 61% increase in the number of patients accessing EMS and a 35% decrease in the number of those presenting to an adult emergency department or urgent care centre in the COVID-19 period. The proportion of EMS calls for the highest-priority patients remained stable, whereas the proportion of patients presenting to an emergency department or urgent care centre with the highest-priority triage classification increased transiently by 0.9 percentage points (increase of 89%). A smaller proportion of patients were transported by EMS (decrease of 21%), and a greater proportion of emergency department patients were admitted to hospital (increase of 25%). After the first case was reported, the mortality rate among EMS patients increased by 265% (3.4 v. 12.4 per 1000 patient encounters).

Interpretation: The first wave of the COVID-19 pandemic was associated with substantial changes in the frequency and disposition of patients accessing emergency services. Further research examining the mechanism of these observations is important for mitigating the impact of future pandemics.


Conflict of interest statement

Competing interests: None declared.

Figures

Figure 1:
Figure 1:
(A) Frequency of COVID-19 cases, March–June 2020. (B) Change in frequency of patient encounters with emergency services from the control period (December 2017–June 2018 and December 2018–June 2019) to the COVID-19 period (December 2019–June 2020).
Figure 2:
Figure 2:
Absolute change from the control period to the COVID-19 period in severity of presentation based on (A) emergency medical services (EMS) dispatch priority (Alpha = lowest, Echo = highest) and (B) emergency department and urgent care centre Canadian Triage Acuity Scale level (5 = lowest, 1 = highest). Dashed lines indicate important events as per Figure 1. Y-axis differs between EMS and emergency department/urgent care centre cohorts; these were modified to improve clarity of trends rather than allow direct comparison.
Figure 3:
Figure 3:
Absolute change from the control period to the COVID-19 period in severity of presentation for patients (A) transported by emergency medical services (EMS) (dispatch priority: Alpha = lowest, Echo = highest) and (B) admitted from the emergency department (Canadian Triage Acuity Scale level: 5 = lowest, 1 = highest). Dashed lines indicate important events as per Figure 1. Y-axis differs between EMS and emergency department cohorts; these were modified to improve clarity of trends rather than allow direct comparison.
Figure 4:
Figure 4:
Absolute change in average operational times for (A) emergency medical services (EMS) and (B) emergency departments and urgent care centres from the control period to the COVID-19 period. Shaded regions represent 95% confidence intervals for average estimates. Dashed lines indicate important events as per Figure 1. Y-axis differs between EMS and emergency department/urgent care centre cohorts; these were modified to improve clarity of trends rather than allow direct comparison.
Figure 5:
Figure 5:
Absolute change in mortality rate per 1000 patient encounters for (A) emergency medical services (EMS) and (B) emergency departments from the control period to the COVID-19 period. Dashed lines indicate important events as per Figure 1. Y-axis differs between EMS and emergency department cohorts; these were modified to improve clarity of trends rather than allow direct comparison.

Similar articles

Cited by

References

    1. Munster VJ, Koopmans M, van Doremalen N, et al. A novel coronavirus emerging in China: key questions for impact assessment. N Engl J Med. 2020;382:692–4. - PubMed
    1. Pandemic influenza preparedness and response: a WHO guidance document. Geneva: World Health Organization; 2009. - PubMed
    1. Lerner EB, Newgard CD, Mann NC. Effect of the coronavirus disease 2019 (COVID-19) pandemic on the U.S. emergency medical services system: a preliminary report. Acad Emerg Med. 2020;27:693–9. - PMC - PubMed
    1. Jeffery MM, D’Onofrio G, Paek H, et al. Trends in emergency department visits and hospital admissions in health care systems in 5 states in the first months of the COVID-19 pandemic in the US. JAMA Intern Med. 2020;180:1328–33. - PMC - PubMed
    1. Chaiyachati BH, Agawu A, Zorc JJ, et al. Trends in pediatric emergency department utilization after institution of coronavirus disease 19 mandatory social distancing. J Pediatr. 2020;226:274–7.e1. - PMC - PubMed

Publication types