. 2021 Jun 1;14(685):eabc1983.
doi: 10.1126/scisignal.abc1983.

Respiratory syncytial virus induces β2-adrenergic receptor dysfunction in human airway smooth muscle cells

Affiliations

Respiratory syncytial virus induces β2-adrenergic receptor dysfunction in human airway smooth muscle cells

Terri J Harford et al. Sci Signal. .

Abstract

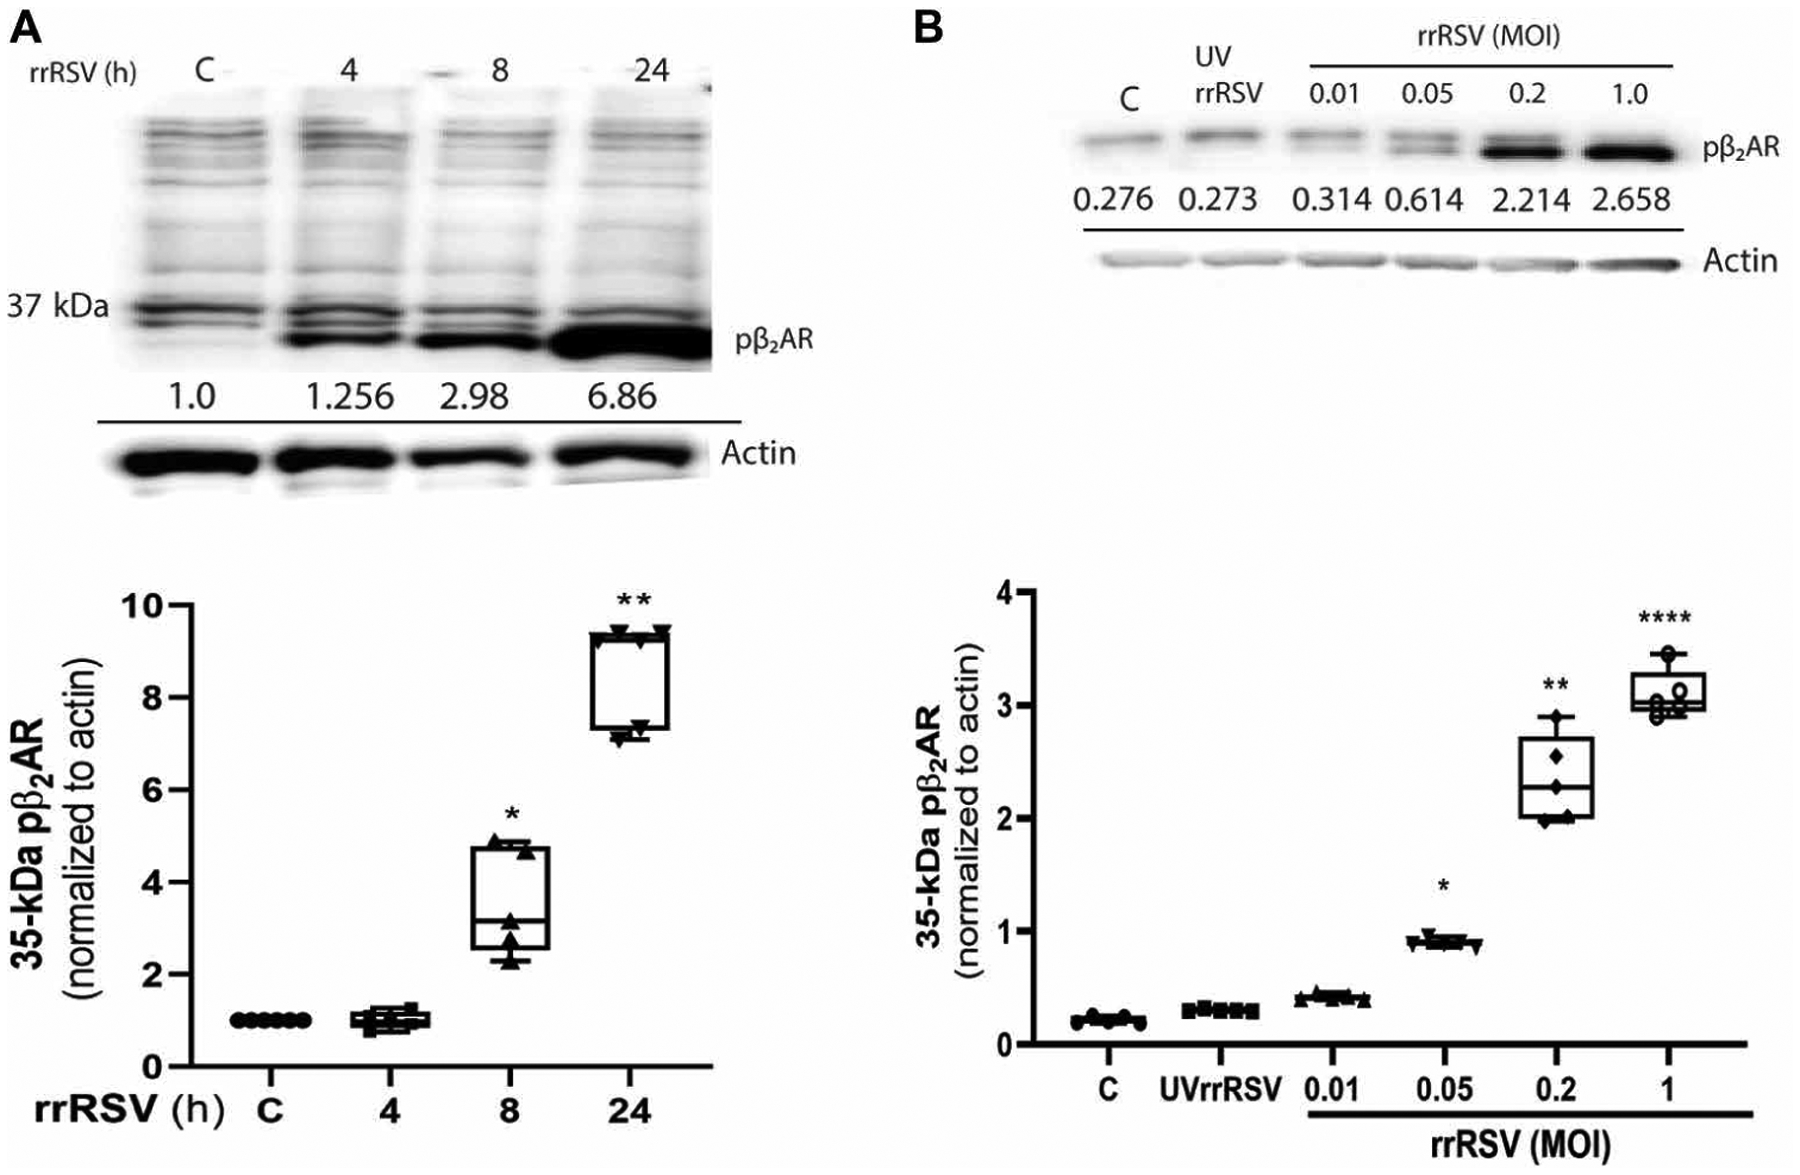
Pharmacologic agonism of the β2-adrenergic receptor (β2AR) induces bronchodilation by activating the enzyme adenylyl cyclase to generate cyclic adenosine monophosphate (cAMP). β2AR agonists are generally the most effective strategy to relieve acute airway obstruction in asthmatic patients, but they are much less effective when airway obstruction in young patients is triggered by infection with respiratory syncytial virus (RSV). Here, we investigated the effects of RSV infection on the abundance and function of β2AR in primary human airway smooth muscle cells (HASMCs) derived from pediatric lung tissue. We showed that RSV infection of HASMCs resulted in proteolytic cleavage of β2AR mediated by the proteasome. RSV infection also resulted in β2AR ligand-independent activation of adenylyl cyclase, leading to reduced cAMP synthesis compared to that in uninfected control cells. Last, RSV infection caused stronger airway smooth muscle cell contraction in vitro due to increased cytosolic Ca2+ concentrations. Thus, our results suggest that RSV infection simultaneously induces loss of functional β2ARs and activation of multiple pathways favoring airway obstruction in young patients, with the net effect of counteracting β2AR agonist-induced bronchodilation. These findings not only provide a potential mechanism for the reported lack of clinical efficacy of β2AR agonists for treating virus-induced wheezing but also open the path to developing more precise therapeutic strategies.


Conflict of interest statement

Competing interests: The authors declare that they have no competing interests.

Figures

Fig. 1.
Fig. 1.. Analysis of β2AR expression in uninfected and rrRSV-infected HASMCs.
(A and B) Cultured HASMCs were incubated with sterile medium, UV-inactivated rrRSV (UVrrRSV), or replicating rrRSV at an MOI of 1 for 24 hours as indicated, and β2AR expression was visualized by immunocytochemistry. (A) Representative confocal microscopy images showing DAPI-stained nuclei (blue), β2AR (green), and rrRSV replication (red). Magnification, ×63. Scale bar, 20 μm. (B) Quantitation of β2AR mean fluorescence as measured with ImageJ software. Measurements from multiple fields are presented as box-and-whisker plots (N = 5 donors per group; all experiments were performed with HASMCs from three to eight donors). Data are means ± SEM and were analyzed by Kruskal-Wallis test with Dunn’s correction for multiple comparisons.
Fig. 2.
Fig. 2.. Analysis of β2AR phosphorylation in response to RSV infection.
(A and B) Cultured HASMCs were incubated with sterile medium, UVrrRSV, or rrRSV at an MOI of 1 for 24 hours before pβ2AR expression was visualized by immunocytochemistry. (A) Representative confocal microscopy images showing DAPI-stained nuclei (blue), pβ2AR (green), and rrRSV replication (red). Magnification, ×63. Scale bar, 20 μm. (B) Quantitation of pβ2AR mean fluorescence as measured with ImageJ software. Measurements from multiple fields are presented as box-and-whisker plots (N = 4 per group; all experiments were performed with HASMCs from three to eight donors). Data are means ± SEM and were analyzed by Kruskal-Wallis test with Dunn’s correction for multiple comparisons. ***P < 0.01 compared to untreated cells.
Fig. 3.
Fig. 3.. Analysis of the effects of RSV infection on pβ2AR protein.
(A) HASMCs were incubated for 24 hours with sterile medium, UVrrRSV, or rrRSV at an MOI of 1. Left: Cell lysates were analyzed by Western blotting with antibody against pβ2AR. Actin was used as a loading control. Western blot is representative of five experiments. Arrow indicates the position of the 35-kDa fragment reactive to anti-pβ2AR. The black horizontal bar indicates that the blots are not contiguous. Middle: Analysis of the fold change in the pβ2AR band intensity normalized to that of actin under the indicated conditions. Results from five individual blots are presented as box-and-whisker plots. Data are means ± SEM and were analyzed by Kruskal-Wallis test with Dunn’s correction for multiple comparisons. **P < 0.01. Right: Analysis of the fold change in the 35-kDa pβ2AR band intensity normalized to that of actin under the indicated conditions. Results from five individual blots are presented as box-and-whisker plots. Data are means ± SEM and were analyzed by Kruskal-Wallis test with Dunn’s correction for multiple comparisons. **P < 0.01. (B) HASMCs that were left uninfected or were infected with rrRSV for 24 hours, as indicated, were lysed, and 0.4 mg of cleared lysate was subjected to immunoprecipitation (IP) with an anti-β2AR antibody. Left: The immunoprecipitated samples were analyzed by Western blotting with an anti-pβ2AR antibody. Arrows indicate anti-pβ2AR–reactive proteins. Right: The SDS-PAGE gel was stained with Coomassie to ensure equal loading of lanes. Western blots are representative of three experiments. MW, molecular weight.
Fig. 4.
Fig. 4.. Time- and dose-dependent increase in the amount of the 35-kDa protein fragment in response to RSV infection.
(A) Cultured HASMCs were incubated with sterile control medium (C) or were infected for the indicated times with rrRSV at an MOI of 1. Top: Cell samples were analyzed by Western blotting with an antibody against pβ2AR. Actin was used as a loading control. The black horizontal bar indicates that the blots are not contiguous. Bottom: The relative abundance of the 35-kDa protein fragment detected by anti-pβ2AR normalized to that of actin was determined with ImageJ software. Normalized amounts are shown below each band. (B) HASMCs were incubated with sterile control medium (C) or were infected with UVrrRSV or rrRSV at the indicated MOIs for 24 hours. Top: Cell samples were analyzed by Western blotting with antibody against pβ2AR. Actin was used as a loading control. The black horizontal bar indicates that the blots are not contiguous. Bottom: The relative abundance of the 35-kDa protein fragment detected by anti-pβ2AR normalized to that of actin was determined with ImageJ software. Normalized amounts are shown below each band. For the graphs in (A) and (B), results from three individual blots are presented as box-and-whisker plots. Data are means ± SEM and were analyzed by Kruskal-Wallis test with Dunn’s correction for multiple comparisons. P values were calculated by two-tailed test. *P < 0.05, **P < 0.01, and ****P < 0.0001 compared to control.
Fig. 5.
Fig. 5.. Loss of β2AR in response to RSV infection.
(A) Cultured HASMCs were treated with sterile control medium or were infected with rrRSV at an MOI of 1. Twenty-four hours later, isolated plasma membranes were subjected to [125]I-CYP (cyanopindolol, a β2AR agonist) β2AR binding at a saturation concentration of 250 pM. A Wilcoxon matched-pair signed-rank test was performed, with P values calculated by two-tailed test. *P < 0.05; N = 3 experiments. CPM, counts per minute. (B) pβ2AR-reactive protein expression was analyzed by Western blotting in HASMCs pretreated with vehicle, 100 nM MG-132, or 2.5 μM batimastat (Bat) before being treated with sterile medium or being infected with rrRSV at an MOI of 1 for 24 hours. Top: The cells were then analyzed by Western blotting with antibody against pβ2AR. Actin was used as a loading control. Bottom: The bar graph shows the intensity of the band corresponding to the 35-kDa anti-pβ2AR–reactive band normalized to that of the actin band. Results from five individual blots are presented as box-and-whisker plots. Data are means ± SEM and were analyzed by Kruskal-Wallis test with Dunn’s correction for multiple comparisons. P values were calculated by two-tailed test. **P < 0.01 and ****P < 0.0001 compared to the RSV only treatment. (C and D) Cultured HASMCs were pretreated with the indicated concentrations of propranolol with or without albuterol (Alb), as indicated, for 1 hour before being incubated with sterile control medium (C), UVrrRSV, or rrRSV (MOI of 1) for 24 hours. Top: The cells were lysed and analyzed by Western blotting with antibodies against pβ2AR (C) and RSV-G protein (D). Actin was used as a loading control. Bottom: The graphs show the relative band intensities, normalized to that of actin, for pβ2AR (C) and RSV-G protein (D). Results from three individual blots are presented as box-and-whisker plots (N = 3). Data are means ± SEM and were analyzed by Kruskal-Wallis test with Dunn’s correction for multiple comparisons. P values were calculated by two-tailed test. *P < 0.05 and **P < 0.01 compared to the RSV only treatment. (E) HASMCs embedded in a 1.5% collagen matrix were incubated with sterile medium or rrRSV for 48 hours before being subjected to a 30-min treatment with vehicle or 200 μM albuterol followed by 200 μM methacholine. Images of the collagen gels were taken at 10-min intervals for 30 min. Data are from three independent experiments and are expressed as the percentage change in gel contraction from time zero. Data are means ± SEM and were analyzed by one-way analysis of variance (ANOVA) using Bonferroni’s multiple comparison test. *P < 0.05 and ***P < 0.001 compared to the methacholine treatment only. The black horizontal bars in the Western blots indicate that the blots are not contiguous.
Fig. 6.
Fig. 6.. Activation of AC in response to RSV infection.
(A) Cultured HASMCs were left uninfected or were infected with rrRSV (MOI of 1) for the indicated times before being left untreated or treated with the indicated concentrations of propranolol (Prop). The amounts of cAMP generated in the cells were determined as indicated in Materials and Methods. Data were analyzed using the mixed-effects model with Geisser-Greenhouse correction. *P < 0.05, **P < 0.01, ***P < 0.001, and ****P < 0.0001 compared to the corresponding zero time point for each treatment. #P < 0.05 and ##P < 0.01 compared to the control zero time point. (B) Cultured HASMCs were left uninfected or were infected with rrRSV for the indicated times. Top: The cells were then analyzed by Western blotting with antibodies against total and phosphorylated CREB (pCREB) protein. Forskolin was used as a positive control for CREB phosphorylation. Bottom: Relative abundance of pCREB to total CREB normalized to that of GAPDH. Results from three individual blots are presented as box-and-whisker plots. Data are means ± SEM and were analyzed by Kruskal-Wallis test with Dunn’s correction for multiple comparisons. P values were calculated by two-tailed test. ***P < 0.001 and ****P < 0.0001 between uninfected and infected cells. (C) HASMCs were left uninfected or were infected with rrRSV for the indicated times. Top: The cells were analyzed by Western blotting with antibody against AC5/6. Actin was used as a loading control. Bottom: The relative abundance of AC5/6, normalized to that of actin, was determined. Results from eight individual blots are presented as box-and-whisker plots. Data are means ± SEM and were analyzed by Kruskal-Wallis test with Dunn’s correction for multiple comparisons. (D) HASMCs were left uninfected or were infected with rrRSV. Cell-free membranes were prepared and treated with vehicle control (C) or 4 mM NaF, and AC activity was assessed using radioactive [γ-32P]ATP to measure cAMP generation. Data are means ± SEM of three independent experiments and were analyzed by one-way ANOVA with Dunnett T3 correction for multiple comparisons. **P < 0.01 and ****P < 0.0001, compared to the uninfected control. The black horizontal bars in the Western blots indicate that the blots are not contiguous.
Fig. 7.
Fig. 7.. RSV infection increases the intracellular Ca2+ concentration.
Cultured HASMCs were incubated with sterile medium or rrRSV at an MOI of 1 for 6 or 24 hours before being assessed for changes in cytoplasmic free Ca2+ concentration. HASMCs were treated with Calcium-6 reagent for 3 hours before they were incubated with vehicle or the indicated concentrations of carbachol (Cch) (100 nM to 100 μM). Readings were taken every 7 s for 2 min and are expressed as the area under the curve (AUC; N = 4 donors each with three experimental replicates; error bars indicate the SEM). Dose-response curve fitting was performed with three-parameter, nonlinear regression.

Similar articles

Cited by

References

    1. Kobilka BK, Dixon RA, Frielle T, Dohlman HG, Bolanowski MA, Sigal IS, Yang-Feng TL, Francke U, Caron MG, Lefkowitz RJ, cDNA for the human β2-adrenergic receptor: A protein with multiple membrane-spanning domains and encoded by a gene whose chromosomal location is shared with that of the receptor for platelet-derived growth factor. Proc. Natl. Acad. Sci. U.S.A 84, 46–50 (1987). - PMC - PubMed
    1. Barnes PJ, Basbaum CB, Nadel JA, Roberts JM, Localization of β-adrenoreceptors in mammalian lung by light microscopic autoradiography. Nature 299, 444–447 (1982). - PubMed
    1. Hamid QA, Mak JCW, Sheppard MN, Corrin B, Craig Venter J, Barnes PJ, Localization of β2-adrenoceptor messenger RNA in human and rat lung using in situ hybridization: Correlation with receptor autoradiography. Eur. J. Pharmacol 206, 133–138 (1991). - PubMed
    1. Shore SA, Drazen JM, β-agonists and asthma: Too much of a good thing? J. Clin. Invest 112, 495–497 (2003). - PMC - PubMed
    1. Shore SA, Moore PE, Regulation of β-adrenergic responses in airway smooth muscle. Respir. Physiol. Neurobiol 137, 179–195 (2003). - PubMed

Publication types