. 2021 Jun 1;11(1):11408.
doi: 10.1038/s41598-021-90997-8.

Fine scale analysis of malaria incidence in under-5: hierarchical Bayesian spatio-temporal modelling of routinely collected malaria data between 2012-2018 in Cameroon

Affiliations

Fine scale analysis of malaria incidence in under-5: hierarchical Bayesian spatio-temporal modelling of routinely collected malaria data between 2012-2018 in Cameroon

Celestin Danwang et al. Sci Rep. .

Abstract

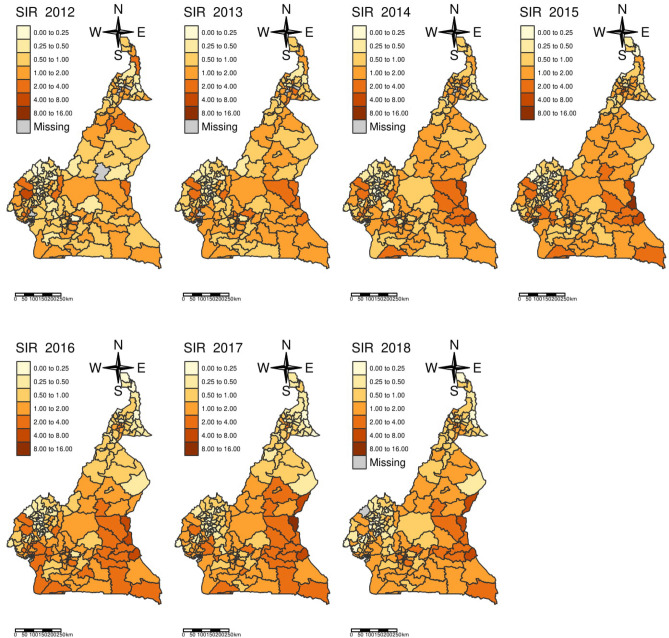
The current study aims to provide a fine-scale spatiotemporal estimate of malaria incidence among Cameroonian under-5, and to determine its associated environmental factors, to set up preventive interventions that are adapted to each health district of Cameroon. Routine data on symptomatic malaria in children under-5 collected in health facilities, between 2012 and 2018 were used. The trend of malaria cases was assessed by the Mann-Kendall (M-K) test. A time series decomposition was applied to malaria incidence to extract the seasonal component. Malaria risk was estimated by the standardised incidence ratio (SIR) and smoothed by a hierarchical Bayesian spatiotemporal model. In total, 4,052,216 cases of malaria were diagnosed between 2012 and 2018. There was a gradual increase per year, from 369,178 in 2012 to 652,661 in 2018. After adjusting the data for completeness, the national incidence ranged from 489‰ in 2012 to 603‰ in 2018, with an upward trend (M-K test p-value < 0.001). At the regional level, an upward trend was observed in Adamaoua, Centre without Yaoundé, East, and South regions. There was a positive spatial autocorrelation of the number of malaria incident-cases per district per year as suggested by the Moran's I test (statistic range between 0.11 and 0.53). The crude SIR showed a heterogeneous malaria risk with values ranging from 0.00 to 8.90, meaning that some health districts have a risk 8.9 times higher than the national annual level. The incidence and risk of malaria among under-5 in Cameroon are heterogeneous and vary significantly across health districts and seasons. It is crucial to adapt malaria prevention measures to the specificities of each health district, in order to reduce its burden in health districts where the trend is upward.


Conflict of interest statement

The authors declare no competing interests.

Figures

Figure 1
Figure 1
Malaria incidence rate in under-fives by region between 2012–2018. Each panel represents the trend in U-5 malaria incidence in one of the country's regions between the years 2012 and 2018. The two largest cities in the country (Douala and Yaoundé) are shown separately, outside the regions where they are located. The names of the regions are mentioned at the top of each panel and the map in the middle gives the geographical location of each region. The map was generated with QGIS version 3.4.8 (URL: https://qgis.org/en/site), and the graphics with the ggplot2 package of R software version 4.0.2 (URL: https://cran.r-project.org/web/packages/ggplot2/index.html).
Figure 2
Figure 2
Seasonal-trend decomposition of malaria incidence by region between 2012–2018. Each panel represents the decomposition of malaria incident-cases recorded in health facilities among under-fives in a given region of Cameroon between the years 2012 and 2018. The two largest cities of the country (Douala and Yaoundé) are presented separately, outside the regions where they are located. The names of the regions are mentioned at the top of each panel and the map in the middle gives the geographical location of each region. On each graph, the first curve on the top (Data) represents the raw data, while the last one at the bottom (trend) represents the trend. The two middle curves represent from top to bottom: the remainder and the seasonal component of the seasonal-trend decomposition based on Loess. The map was generated with QGIS version 3.4.8 (URL: https://qgis.org/en/site), and the graphics with the ggplot2 package of R software version 4.0.2 (URL: https://cran.r-project.org/web/packages/ggplot2/index.html).
Figure 3
Figure 3
Map of malaria standardized incidence ratio in under-fives between 2012–2018. The SIRs are presented by year and by health districts for the years 2012 to 2018. The map was generated with tmap package of R software version 4.0.2 (URL: https://cran.r-project.org/web/packages/tmap/vignettes/tmap-getstarted.html).
Figure 4
Figure 4
Modelled malaria risk map. The spatial risk map shown here is the result of the Bayesian model with the lowest DIC. The map was generated with tmap package of R software version 4.0.2 (URL: https://cran.r-project.org/web/packages/tmap/vignettes/tmap-getstarted.html).

References

    1. Bhatt S, Weiss DJ, Cameron E, Bisanzio D, Mappin B, Dalrymple U, et al. The effect of malaria control on Plasmodiumfalciparum in Africa between 2000 and 2015. Nature. 2015;526(7572):207–211. doi: 10.1038/nature15535. - DOI - PMC - PubMed
    1. Gething PW, Casey DC, Weiss DJ, Bisanzio D, Bhatt S, Cameron E, et al. Mapping Plasmodiumfalciparum mortality in Africa between 1990 and 2015. N. Engl. J. Med. 2016;375(25):2435–2445. doi: 10.1056/NEJMoa1606701. - DOI - PMC - PubMed
    1. Weiss DJ, Lucas TCD, Nguyen M, Nandi AK, Bisanzio D, Battle KE, et al. Mapping the global prevalence, incidence, and mortality of Plasmodium falciparum, 2000–17: A spatial and temporal modelling study. Lancet. 2019;394(10195):322–331. doi: 10.1016/S0140-6736(19)31097-9. - DOI - PMC - PubMed
    1. World Malaria Report 2019 [Internet] [cited 2020 Jan 31]. https://www.who.int/publications-detail/world-malaria-report-2019.
    1. Trampuz A, Jereb M, Muzlovic I, Prabhu RM. Clinical review: Severe malaria. Crit. Care. 2003;7(4):315. doi: 10.1186/cc2183. - DOI - PMC - PubMed

Publication types