. 2021 Nov;26(11):6789-6805.
doi: 10.1038/s41380-021-01164-4. Epub 2021 Jun 1.

Lithium increases mitochondrial respiration in iPSC-derived neural precursor cells from lithium responders

Affiliations

Lithium increases mitochondrial respiration in iPSC-derived neural precursor cells from lithium responders

Jordi Requena Osete et al. Mol Psychiatry. 2021 Nov.

Abstract

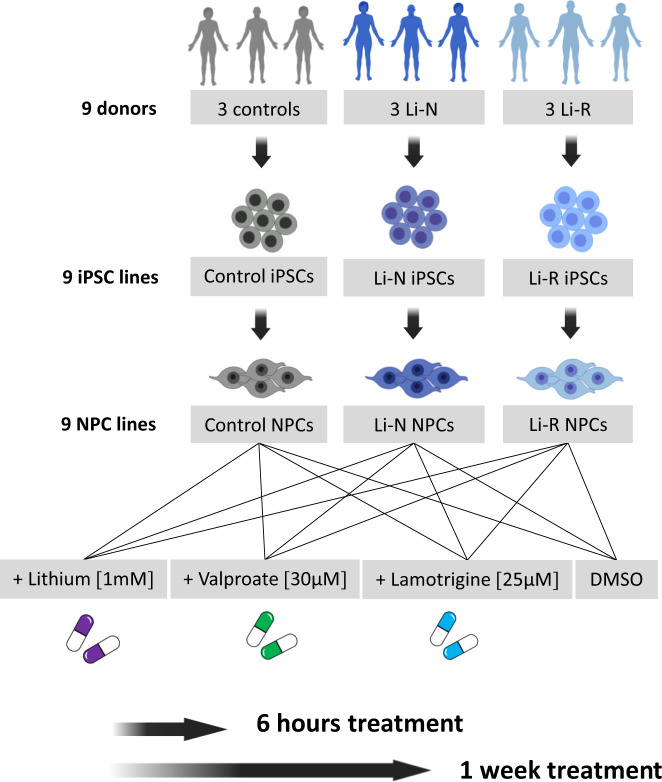
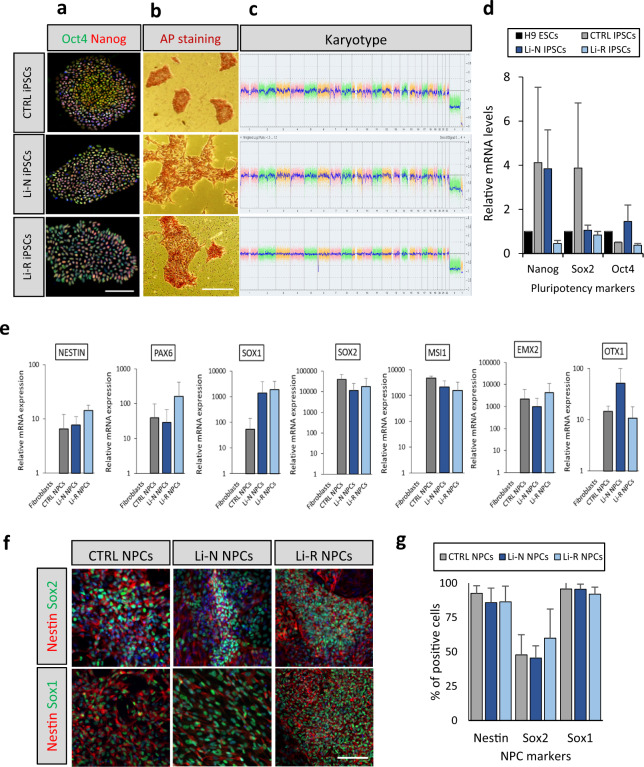
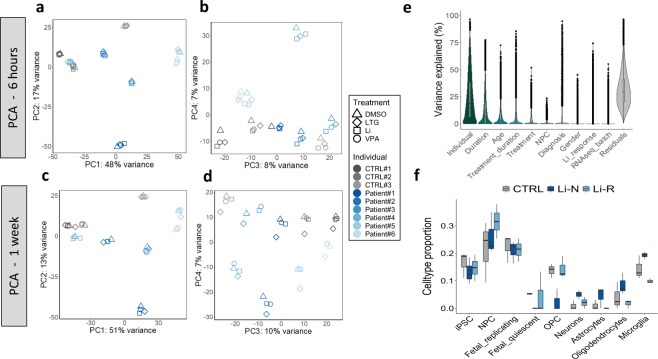
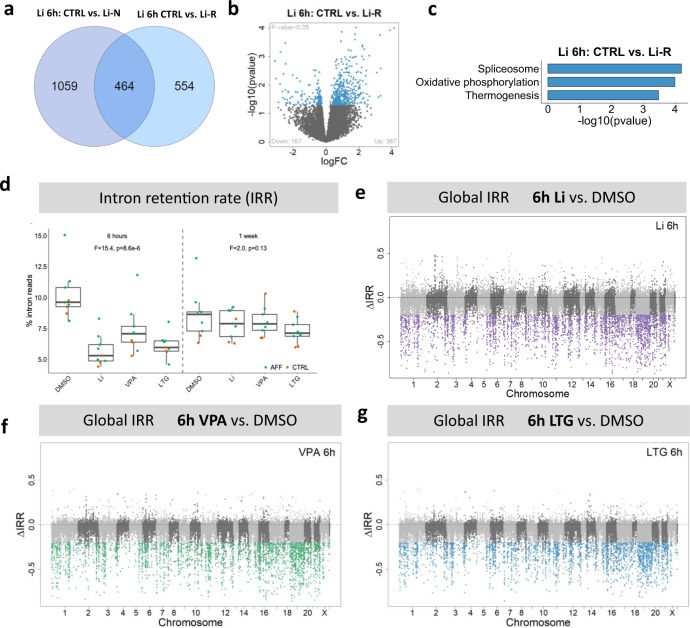
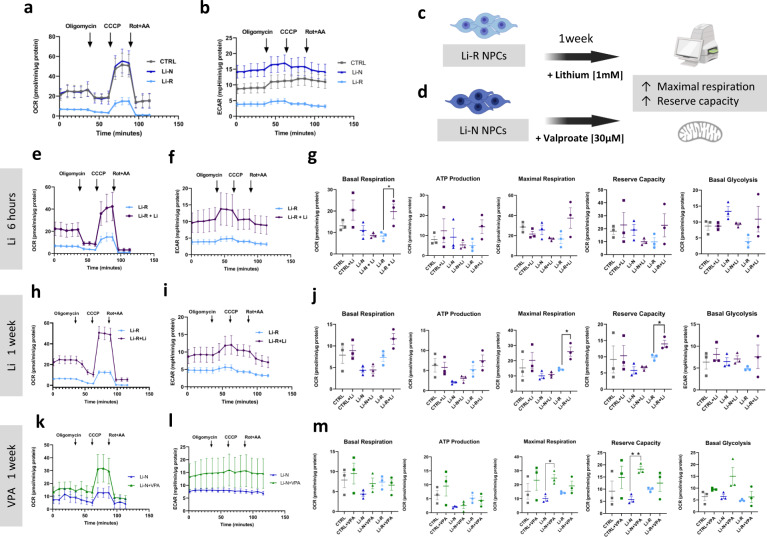
Lithium (Li), valproate (VPA) and lamotrigine (LTG) are commonly used to treat bipolar disorder (BD). While their clinical efficacy is well established, the mechanisms of action at the molecular level are still incompletely understood. Here we investigated the molecular effects of Li, LTG and VPA treatment in induced pluripotent stem cell (iPSC)-derived neural precursor cells (NPCs) generated from 3 healthy controls (CTRL), 3 affective disorder Li responsive patients (Li-R) and 3 Li non-treated patients (Li-N) after 6 h and 1 week of exposure. Differential expression (DE) analysis after 6 h of treatment revealed a transcriptional signature that was associated with all three drugs and most significantly enriched for ribosome and oxidative phosphorylation (OXPHOS) pathways. In addition to the shared DE genes, we found that Li exposure was associated with 554 genes uniquely regulated in Li-R NPCs and enriched for spliceosome, OXPHOS and thermogenesis pathways. In-depth analysis of the treatment-associated transcripts uncovered a significant decrease in intron retention rate, suggesting that the beneficial influence of these drugs might partly be related to splicing. We examined the mitochondrial respiratory function of the NPCs by exploring the drugs' effects on oxygen consumption rate (OCR) and glycolytic rate (ECAR). Li improved OCR levels only in Li-R NPCs by enhancing maximal respiration and reserve capacity, while VPA enhanced maximal respiration and reserve capacity in Li-N NPCs. Overall, our findings further support the involvement of mitochondrial functions in the molecular mechanisms of mood stabilizers and suggest novel mechanisms related to the spliceosome, which warrant further investigation.


Conflict of interest statement

OAA is a consultant to HealthLytix and has received speaker’s honorarium from Lundbeck and Synovion. The other authors declare no conflict of interest.

Figures

Fig. 1
Fig. 1. Schematic representation of the experimental design for the drug treatment of NPCs.
Fibroblasts isolated from 3 CTRLs and 6 affective disorder patients, including 3 Li-N and 3 Li-R, were first reprogrammed into iPSCs and then differentiated into NPCs. All 9 lines were incubated with: 1 mM lithium (Li), 30 µM valproate (VPA), 25 µM lamotrigine (LTG), and DMSO as vehicle control, using the medically recommended therapeutic concentrations. The short-term effect of drug exposure (6 h and 1 week) were assessed through transcriptional profiling and functional analyses. NPCs neural precursor cells, IPSC induced pluripotent stem cells, CTRL control, Li-R lithium responders, Li-N lithium non-treated, DMSO dimethyl sulfoxide.
Fig. 2
Fig. 2. Characterization of iPSCs and NPCs.
a Representative images of iPSC immunofluorescence staining for one line from each group (CTRL, Li-N and Li-R). Nuclear Oct4 and Nanog pluripotency markers are shown in the merged image. Cell nuclei were stained with DAPI. Scale bars: 100 µm. b Key pluripotency marker alkaline phosphatase (AP) staining positively in iPSC colonies from one line representative of each group used in the study. Scale bars: 100 µm. c Karyotype for one representative line from each group assessed by KaryoStat™ analysis. Somatic and sex chromosomes are displayed together. The y-axis shows the log2 ratios depicting the microarray probe’s signal intensities. A CN value of 2 represents a normal copy number state. Chromosomal gains are represented by a value of 3, while chromosomal losses are represented by a value of 1. Pink, green and yellow colors indicate each individual chromosome probe´s raw signal. The blue line represents the normalized probe signal used to identify copy number aberrations. The same ~7000 kb partial chromosomal loss was detected in 2 patient lines (#5 and #6) on chromosome 6 at position q24.3 (see also Supplementary Fig. 1c). d Real-time PCR analysis of the pluripotency marker genes OCT4, SOX2 and NANOG in CTRL and patient-derived iPSCs compared to H9 embryonic stem cells (H9 ESCs) expression levels. Data is presented as mean ± SD. e Real-time PCR characterization of NPC marker genes NESTIN, PAX6, SOX1, SOX2, MSI1, EMX2, and OTX1. Values are given for mRNA expression levels relative to fibroblasts. Data is presented as mean ± SD. f NPC immunofluorescence staining for Nestin, Sox1 and Sox2. Scale bars: 100 µm. g Percentage of cells staining positive for Nestin, Sox2 and Sox1 by counting 300 cells from the immunofluorescence analysis of each line. No differences were found between groups.
Fig. 3
Fig. 3. Transcriptomic characterization of NPC cultures.
ad Principal component analysis (PCA) plots of all samples based on the 1000 most variant genes. Most variation in gene expression is explained by donor effects. Within each cluster, treatment duration per se, i.e., regardless of the type of treatment, has a big effect on gene expression, underscoring the importance of including separate control samples (DMSO) for both duration categories. e Variance partition plot showing the proportion of gene expression variance attributed to different sources. Residuals constitute additional, unknown sources of variation not accounted for. f Cell type proportions estimated by computational deconvolution. NPCs and fetal replicating neurons were the cell populations with largest fractions, but other cell types are also present in the cultures. No significant differences between groups were found for any cell type. Fetal_replicating: Replicating neuronal progenitors (from fetal brain tissue, 16–18 weeks post-conception). Fetal_quiescent: Quiescent newly born neurons (from fetal brain tissue, 16–18 weeks post-conception). OPC oligodendrocytes precursor cells.
Fig. 4
Fig. 4. Treatment-specific DE genes and downstream analyses after 6 h and 1 week of exposure.
a Volcano plots of DE genes for each treatment (Li, VPA and LTG) vs. DMSO after 6 h of exposure. b Venn diagram of DE genes after 6 h of exposure. The majority of DE genes were shared between all three treatments. c Enrichment of 6 h Li-specific genes in human brain structures. d Enrichment of 6 h shared DE genes in human brain structures. e Pathway (KEGG) analysis of DE genes (1670) that were unique to Li treatment (purple) and DE genes (5558) that were shared (gray) between all three treatments. The DE genes uniquely associated with VPA (540) and LTG (1431) were not enriched for any pathways. f Volcano plots of DE genes associated with VPA and LTG treatment vs. DMSO after 1 week of exposure. Li treatment for 1 week did not result in any significant DE gene. g Venn diagram of DE genes associated with 1 week LTG and VPA treatments. h Enrichment of 1 week LTG genes in brain regions. i Pathway (KEGG) analysis of unique LTG genes. No significantly enriched pathway was identified for unique VPA genes. VPA valproate, LTG lamotrigine, DMSO dimethyl sulfoxide, KEGG the Kyoto Encyclopedia of Genes and Genomes, CB cerebellum, MED medulla oblongata, PON pons, SN substantia nigra, CNG anterior cingulate cortex, DFC dorsal frontal cortex, THA thalamus.
Fig. 5
Fig. 5. DE genes associated with Li treatment in responders show enrichment for spliceosome and OXPHOS pathways.
a Venn diagram of DE genes associated with Li response status after Li treatment for 6 h, showing shared DE genes (464) and unique DE genes for Li-N (1059) and Li-R (554) NPCs. b Volcano plot of Li-R unique DE genes (p value < 0.05). c Pathway (KEGG) enrichment analysis of Li-R unique DE genes (554) showing significant enrichment for spliceosome, oxidative phosphorylation (OXPHOS) and thermogenesis pathways. d Initial analysis of overall intron retention rate (IRR), measured as the percentage of sequencing reads mapping to intronic regions, in NPCs after 6 h and 1 week treatment with DMSO, Li, VPA and LTG. 6 h of exposure led to significantly lower levels of intron retention for all treatments, most pronounced for Li. No comparable effect was found for 1 week exposure. F statistic and p value of repeated measures ANOVA tests are shown. Plots displaying transcriptome-wide per-intron IRR by chromosome location for 6 h treatment with Li (e), VPA (f) and LTG (g). Colored dots represent introns with significant (IR change >20% and FDR < 0.05) differences in retention rate in drug-treated samples compared to DMSO samples.
Fig. 6
Fig. 6. Li and VPA enhance mitochondrial OCR in patient-derived NPCs.
Analysis of oxidative phosphorylation using Seahorse Analyzer. a Oxygen consumption rate (OCR) kinetics graph showing that Li-R patient NPCs present a tendency of decreased mitochondrial OCR, which could be indicative of dysfunctional mitochondrial function as compared to CTRL cells. b Extracellular acidification rate (ECAR) kinetics graph displaying glycolysis activity for all three groups. Diagram summarizing the main OCR and ECAR results after Li (c) and VPA (d) treatments. Li treatment of Li-R NPCs lead to an increase in maximal respiration and reserve capacity. VPA treatment of Li-N NPCs lead to an increase in maximal respiration and reserve capacity. e–g OCR (e) and ECAR (f) graphs for Li treatment for 6 h. The ECAR graph shows a tendency to increase basal glycolytic activity, but no statistically significant difference was found. g Basal respiration, ATP production, maximal respiration, reserve capacity and basal glycolysis after 6 h of Li treatment. Basal respiration of Li-R cells was significantly higher after Li treatment. The means of OCR parameters and basal glycolysis from untreated CTRL, Li-N and Li-R cells were compared by one-way ANOVA. The means of OCR parameters and basal glycolysis from untreated vs. treated cells for each experimental group were compared by two-tailed unpaired t-test. h–j OCR (h) and ECAR (i) graphs after Li treatment for 1 week. j Basal respiration, ATP production, maximal respiration, reserve capacity and basal glycolysis after 1 week Li treatment. Maximal respiration and reserve capacity of Li-R cells were significantly higher after Li treatment. k–m OCR (k) and ECAR (l) graphs for VPA treatment for 1 week. m Basal respiration, ATP production, maximal respiration, reserve capacity and basal glycolysis after 1 week VPA treatment. Maximal respiration and reserve capacity of Li-N cells were significantly higher after VPA treatment. Data was analyzed by two-tailed unpaired t-test. All experiments were run in quadruplicates, and values are corrected for total protein levels. Data is presented as mean ± SEM of at least two independent experiments (n = 3 cell lines/group). NPCs neural precursor cells, CTRL control, Li-R lithium responders, Li-N lithium non-treated, ECAR extracellular acidification rate, OCR oxygen consumption rate.

Similar articles

Cited by

References

    1. Rowland TA, Marwaha S. Epidemiology and risk factors for bipolar disorder. Ther Adv Psychopharmacol. 2018;8:251–69. - PMC - PubMed
    1. Schou M. Lithium prophylaxis in recurrent endogenous affective disorders. Arch Invest Med. 1972;3:459–72. - PubMed
    1. Yatham LN, Kennedy SH, Parikh SV, Schaffer A, Bond DJ, Frey BN, et al. Canadian Network for Mood and Anxiety Treatments (CANMAT) and International Society for Bipolar Disorders (ISBD) 2018 guidelines for the management of patients with bipolar disorder. Bipolar Disord. 2018;20:97–170. - PMC - PubMed
    1. Macritchie K, Geddes JR, Scott J, Haslam D, de Lima M, Goodwin G. Valproate for acute mood episodes in bipolar disorder. Cochrane Database Syst Rev. 2003;1:Cd004052. - PubMed
    1. Large CH, Di Daniel E, Li X, George MS. Neural network dysfunction in bipolar depression: clues from the efficacy of lamotrigine. Biochem Soc Trans. 2009;37:1080–4. - PubMed

Publication types