. 2021:24:100597.
doi: 10.1016/j.imu.2021.100597. Epub 2021 May 26.

Structural insights and inhibition mechanism of TMPRSS2 by experimentally known inhibitors Camostat mesylate, Nafamostat and Bromhexine hydrochloride to control SARS-coronavirus-2: A molecular modeling approach

Affiliations

Structural insights and inhibition mechanism of TMPRSS2 by experimentally known inhibitors Camostat mesylate, Nafamostat and Bromhexine hydrochloride to control SARS-coronavirus-2: A molecular modeling approach

Kailas D Sonawane et al. Inform Med Unlocked. 2021.

Abstract

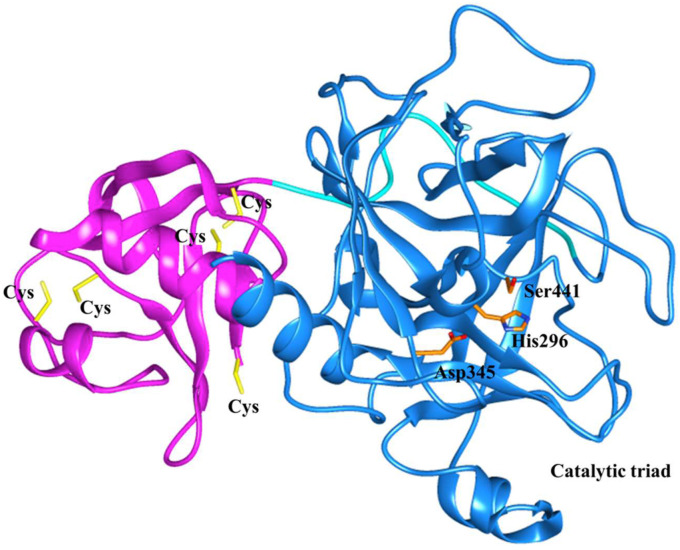
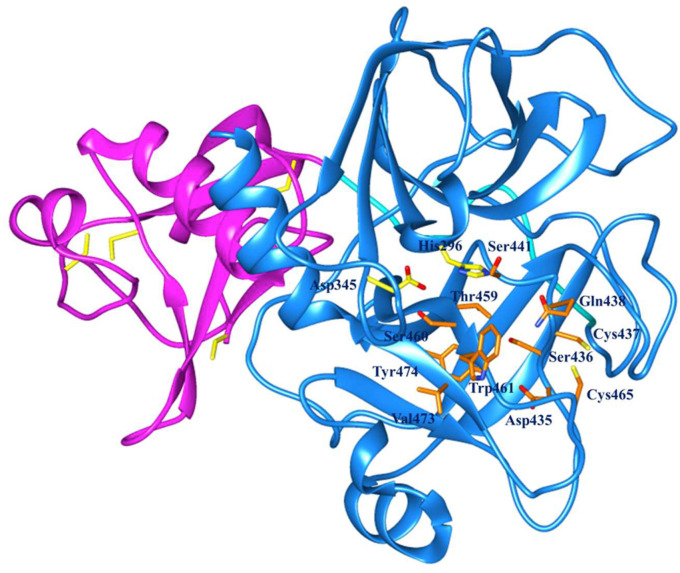
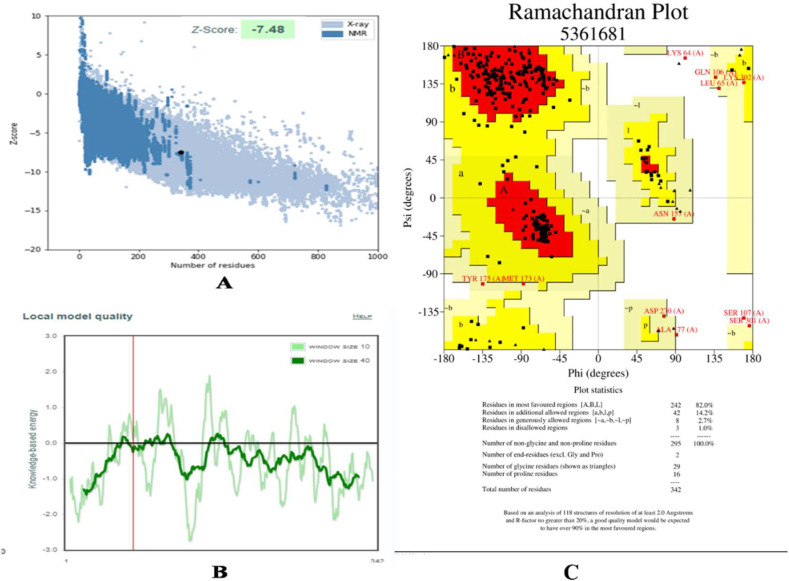
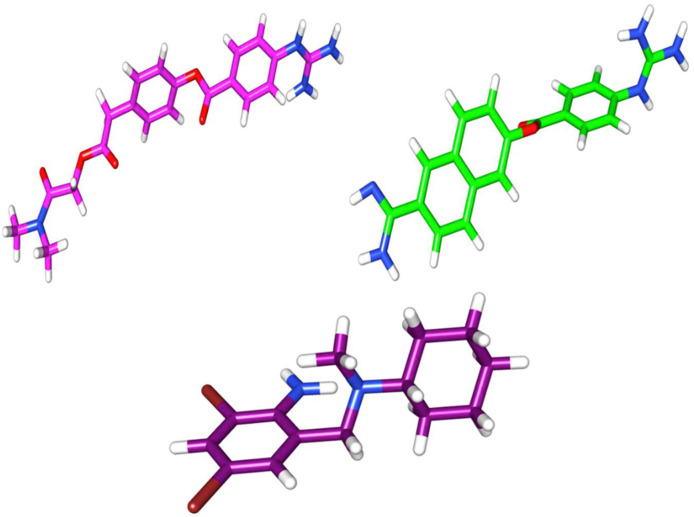
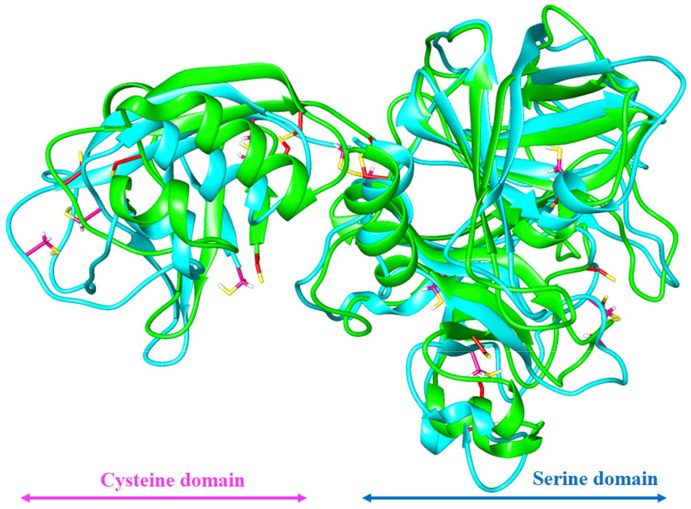
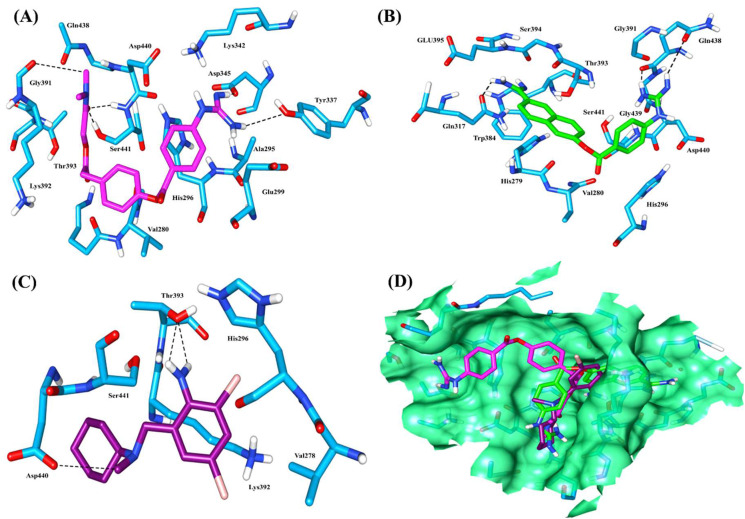
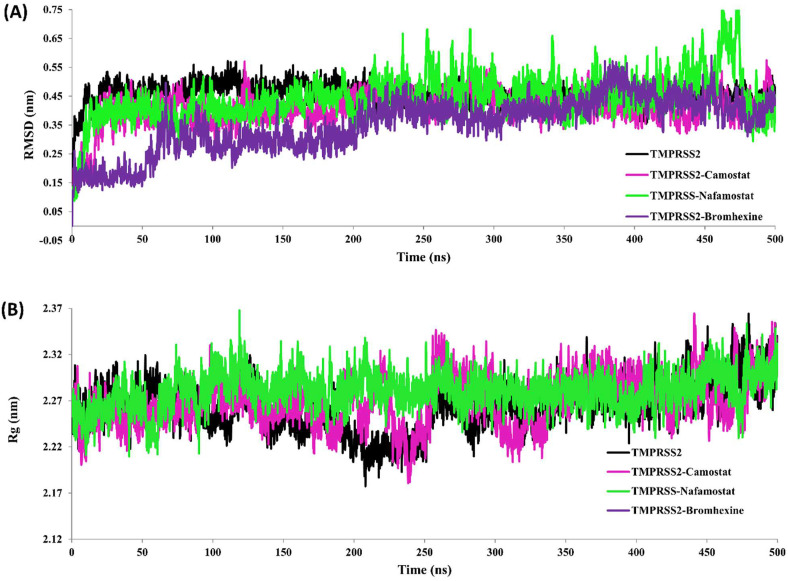
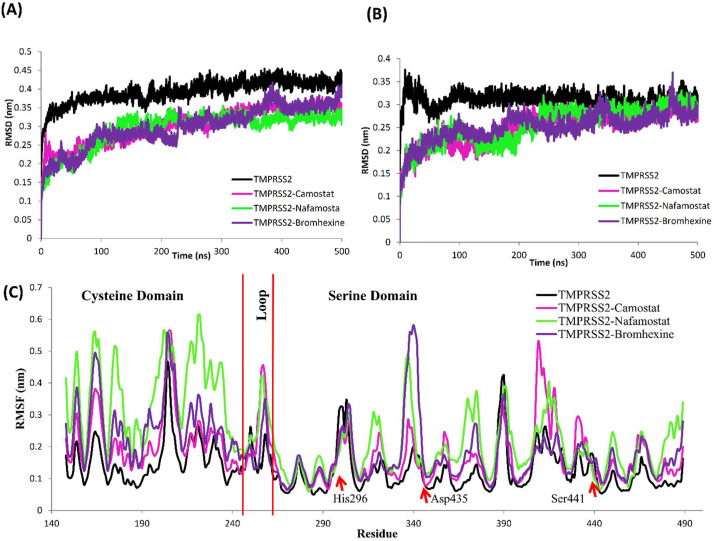
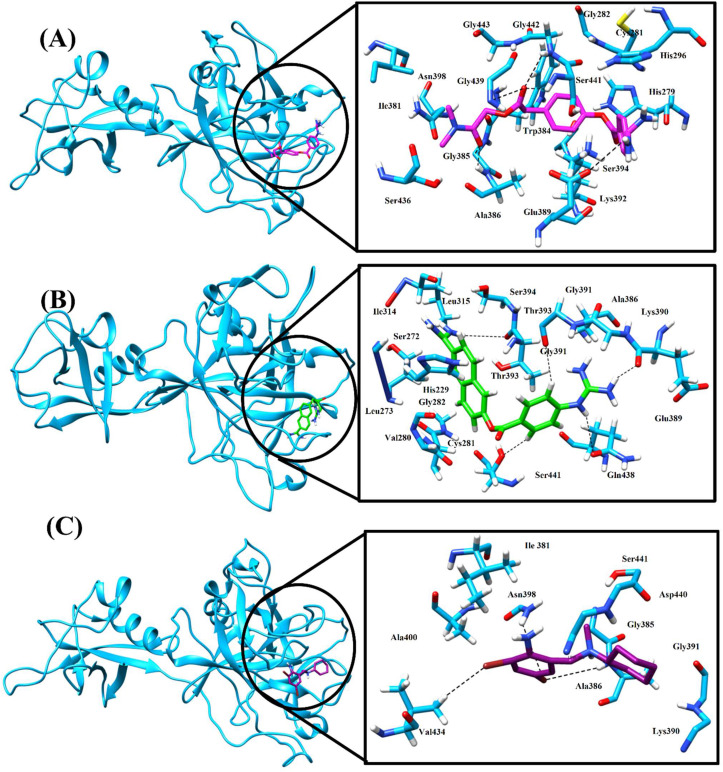
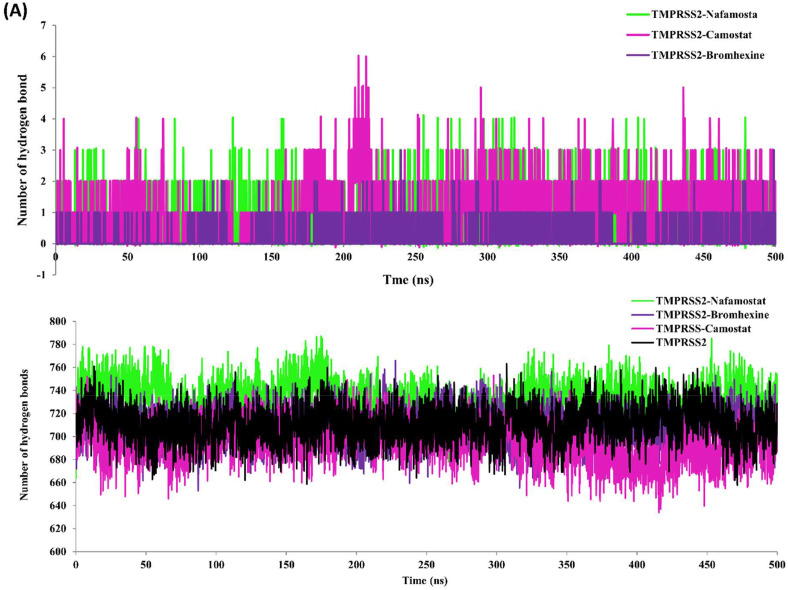
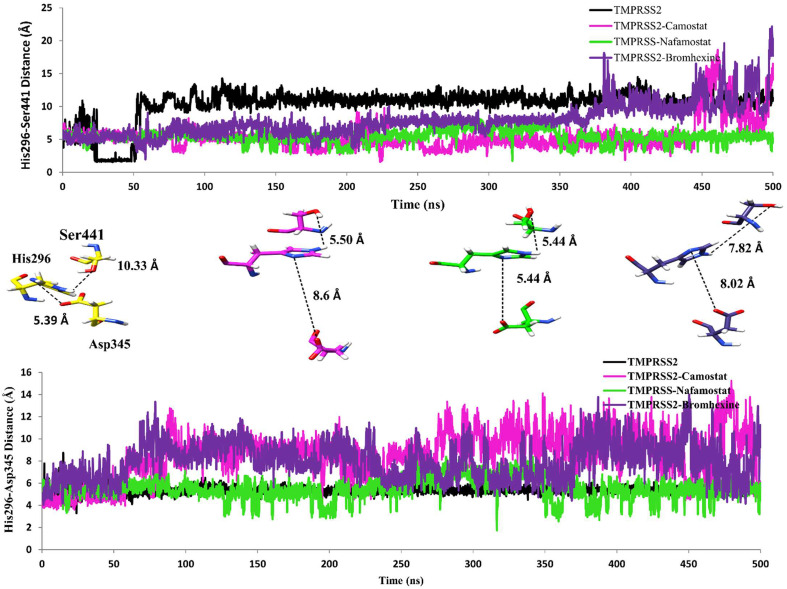
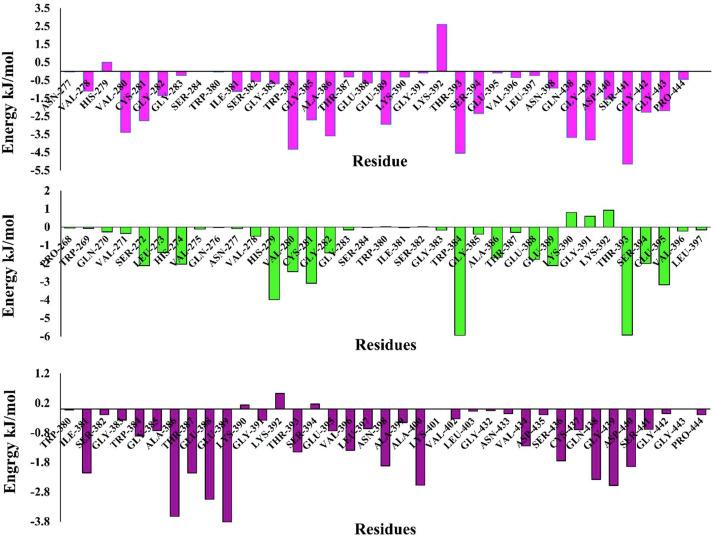
Severe Acute Respiratory Syndrome Coronavirus-2 (SARS-CoV-2) has been responsible for the cause of global pandemic Covid-19 and to date, there is no effective treatment available. The spike 'S' protein of SARS-CoV-2 and ACE2 of the host cell are being targeted to design new drugs to control Covid-19. Similarly, a transmembrane serine protease, TMPRSS2 of the host cell plays a significant role in the proteolytic cleavage of viral 'S' protein helpful for the priming of ACE2 receptors and viral entry into human cells. However, three-dimensional structural information and the inhibition mechanism of TMPRSS2 is yet to be explored experimentally. Hence, we have used a molecular dynamics (MD) simulated homology model of TMPRSS2 to study the inhibition mechanism of experimentally known inhibitors Camostat mesylate, Nafamostat and Bromhexine hydrochloride (BHH) using molecular modeling techniques. Prior to docking, all three inhibitors were geometry optimized by semi-empirical quantum chemical RM1 method. Molecular docking analysis revealed that Camostat mesylate and its structural analogue Nafamostat interact strongly with residues His296 and Ser441 present in the catalytic triad of TMPRSS2, whereas BHH binds with Ala386 along with other residues. Comparative molecular dynamics simulations revealed the stable behavior of all the docked complexes. MM-PBSA calculations also revealed the stronger binding of Camostat mesylate to TMPRSS2 active site residues as compared to Nafamostat and BHH. Thus, this structural information could be useful to understand the mechanistic approach of TMPRSS2 inhibition, which may be helpful to design new lead compounds to prevent the entry of SARS-Coronavirus 2 in human cells.

Keywords: Covid-19; Molecular docking; Molecular dynamics simulation; SARS-CoV-2; TMPRSS2.


Conflict of interest statement

The authors declare that they have no known competing financial interests or personal relationships that could have appeared to influence the work reported in this paper.

Figures

Fig. 1
Fig. 1
Predicted model of TMPRSS2 showing SRCR: Scavenger receptor cysteine rich domain (magenta) and catalytic triad His296, Asp345, and Ssr441 (orange) in serine protease domain (blue). (For interpretation of the references to colour in this figure legend, the reader is referred to the Web version of this article.)
Fig. 2
Fig. 2
Active site residues in orange in binding pocket of TMPRSS2 predicted by CATSp. (For interpretation of the references to colour in this figure legend, the reader is referred to the Web version of this article.)
Fig. 3
Fig. 3
PROSA analysis of TMPRSS2 model A) Z Score, B) Local model quality. C) Ramchandran plot of TMPRSS2 model.
Fig. 4
Fig. 4
Three dimensional structure of TMPRSS2 inhibitors Camostat mesylate (Magenta), Nafamostat (green) and Bromhexine hydrochloride (purple). (For interpretation of the references to colour in this figure legend, the reader is referred to the Web version of this article.)
Fig. 5
Fig. 5
Superimposition of TMPRSS2 model before (green) and after (cyan) MD simulation with disulfide bonds in stick before (red) and after (magenta) MD simulation with cysteine domain (magenta) and Serine domain (blue). (For interpretation of the references to colour in this figure legend, the reader is referred to the Web version of this article.)
Fig. 6
Fig. 6
Docking interaction of active site residues in stick of TMPRSS (cyan) with A) Camostat mesylate (Magenta); B) Nafamostat (green); C) Bromhexine hydrochloride (purple); D) Super imposition of docked complex of all three inhibitor showing Camostat mesylate (Magenta), Nafamostat (green) and Bromhexine hydrochloride (purple) within active site of TMPRSS2 active site residues (cyan). (For interpretation of the references to colour in this figure legend, the reader is referred to the Web version of this article.)
Fig. 7
Fig. 7
MD simulation of TMPRSS2 and TMPRSS2 docked complex. (A) Root mean square deviation (RMSD) during simulation. (B) Radius of gyration (Rg): TMPRSS2 without inhibitor (black) TMPRSS2 in complex TMPRSS2-Camostat mesylate (magenta), TMPRSS2-Nafamostat (green) and TMPRSS2-Bromhexine complex during simulation. (For interpretation of the references to colour in this figure legend, the reader is referred to the Web version of this article.)
Fig. 8
Fig. 8
(A) Root mean square deviation (RMSD) during simulation of serine domain and (B) Cysteine domain (C) Root mean square fluctuation (RMSF) during simulation of TMPRSS2 with both serine domain, loop region and cysteine domain along with catalytic residues RMSF indicated red .TMPRSS2 in absence of inhibitor (black), TMPRSS2 in complex TMPRSS2-Camostat mesylate (magenta), TMPRSS2-Nafamostat (green) and TMPRSS2-Bromhexine complex (purple). (For interpretation of the references to colour in this figure legend, the reader is referred to the Web version of this article.)
Fig. 9
Fig. 9
Molecular interactions of Average structure of TMPRSS2 from top cluster after MD simulation, right side whole TMPRSS2 with Camostat, Nafamostat and Bromhexine (A), (B) and (C) respectively. At left side molecular interaction of TMPRSS2 which contributes for binding of (A) Camostat mesylate (magenta) (B) Nafamostat (green) and (C) Bromhexine(purple). (For interpretation of the references to colour in this figure legend, the reader is referred to the Web version of this article.)
Fig. 10
Fig. 10
Hydrogen bond analysis: (A) Time dependent total hydrogen bond between TMPRSS2 with Camostat mesylate (magenta), Nafamostat (green) and Bromhexine (purple) in respective complex. (B) Time dependent total hydrogen bond between TMPRSS2 and water (black) TMPRSS2 with water in complex with Camostat mesylate (magenta), Nafamostat (green) and Bromhexine (purple) in respective complex. (For interpretation of the references to colour in this figure legend, the reader is referred to the Web version of this article.)
Fig. 11
Fig. 11
Intermolecular distance between (Nitrogen) of His296 and hydroxyl group (-OH) of Ser441 top panel and (-NH) of His296 and carbonyl (=OC) of Asp345 shown bottom panel, at middle residues in stick showing geometry of catalytic triad at active site, TMPRSS2 alone (yellow), in TMPRSS2 complex with Camostat mesylate (magenta), in TMPRSS2 complex with Nafamostat (green) and in TMPRSS2 complex with Bromhexine (purple). (For interpretation of the references to colour in this figure legend, the reader is referred to the Web version of this article.)
Fig. 12
Fig. 12
Energetic contribution of individual residues in (A) TMPRSS2-Camostat, (magenta) (blue) to binding energy in KJ/mol, (B) all residue contribution of TMPRSS2-Nafamostat complex (green) in binding energy (KJ/mol). (C) Residue contribution of TMPRSS2-Bromhexine complex (purple) in binding energy (KJ/mol). (For interpretation of the references to colour in this figure legend, the reader is referred to the Web version of this article.)

References

    1. Zhao S., Lin Q., Ran J. Preliminary estimation of the basic reproduction number of novel coronavirus (2019-nCoV) in China, from 2019 to 2020: a data-driven analysis in the early phase of the outbreak. Int J Infect Dis. 2020;92:214–217. doi: 10.1016/j.ijid.2020.01.050. - DOI - PMC - PubMed
    1. De W.E., Van D.N., Falzarano D., Munster V.J. SARS and MERS: recent insights into emerging coronaviruses. Nat Rev Microbiol. 2016;14(8):523–534. doi: 10.1038/nrmicro.2016.81. - DOI - PMC - PubMed
    1. Song Z., Xu Y., Bao L. From SARS to MERS, thrusting coronaviruses into the spotlight. Viruses. 2019 Jan 14;11(1):59. doi: 10.3390/v11010059. - DOI - PMC - PubMed
    1. WHO WHO Director-General opening remarks at the media briefing on COVID-19-11 March 2020. 2020. https://www.who.int/director-general/speeches/detail/who-director-genera... [Online] Availabble.
    1. Li Q., Guan X., Wu P. Early transmission dynamics in Wuhan, China, of novel coronavirus-infected pneumonia. N Engl J Med. 2020;382(13):1199–1207. doi: 10.1056/NEJMoa2001316. - DOI - PMC - PubMed

LinkOut - more resources