

Chest X-ray Classification Using Deep Learning for Automated COVID-19 Screening
- PMID: 34075355
- PMCID: PMC8152712
- DOI: 10.1007/s42979-021-00695-5
Chest X-ray Classification Using Deep Learning for Automated COVID-19 Screening
Abstract
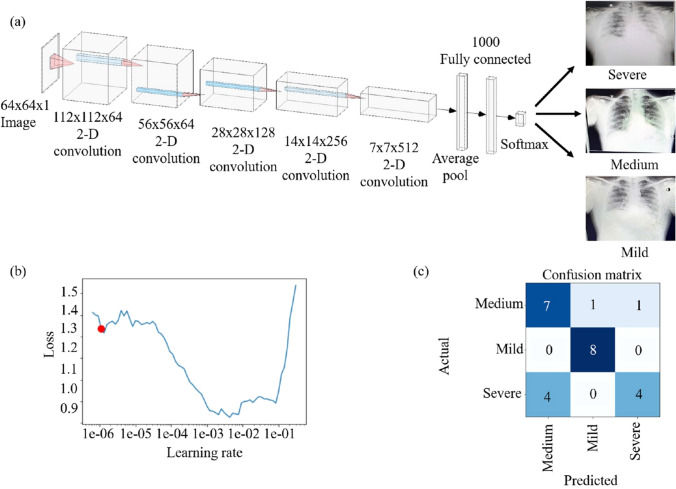
In today's world, we find ourselves struggling to fight one of the worst pandemics in the history of humanity known as COVID-2019 caused by a coronavirus. When the virus reaches the lungs, we observe ground-glass opacity in the chest X-ray due to fibrosis in the lungs. Due to the significant differences between X-ray images of an infected and non-infected person, artificial intelligence techniques can be used to identify the presence and severity of the infection. We propose a classification model that can analyze the chest X-rays and help in the accurate diagnosis of COVID-19. Our methodology classifies the chest X-rays into four classes viz. normal, pneumonia, tuberculosis (TB), and COVID-19. Further, the X-rays indicating COVID-19 are classified on a severity-basis into mild, medium, and severe. The deep learning model used for the classification of pneumonia, TB, and normal is VGG-16 with a test accuracy of 95.9 %. For the segregation of normal pneumonia and COVID-19, the DenseNet-161 was used with a test accuracy of 98.9 %, whereas the ResNet-18 worked best for severity classification achieving a test accuracy up to 76 %. Our approach allows mass screening of the people using X-rays as a primary validation for COVID-19.
Supplementary information: The online version contains supplementary material available at 10.1007/s42979-021-00695-5.
Keywords: COVID-19; Chest X-ray; Severity-based classification.
© The Author(s), under exclusive licence to Springer Nature Singapore Pte Ltd 2021.
Conflict of interest statement
Conflict of InterestAuthors A. Shelke, M. Inamdar, V. Shah, A. Tiwari, A. Hussain, T. Chafekar and N. Mehendale declare that they have no conflict of interest.
Figures


Similar articles
-
COVID-19 diagnosis from chest x-rays: developing a simple, fast, and accurate neural network.Health Inf Sci Syst. 2021 Oct 12;9(1):36. doi: 10.1007/s13755-021-00166-4. eCollection 2021 Dec. Health Inf Sci Syst. 2021. PMID: 34659742 Free PMC article.
-
A novel abnormality annotation database for COVID-19 affected frontal lung X-rays.PLoS One. 2022 Oct 14;17(10):e0271931. doi: 10.1371/journal.pone.0271931. eCollection 2022. PLoS One. 2022. PMID: 36240175 Free PMC article.
-
An artificial intelligence deep learning platform achieves high diagnostic accuracy for Covid-19 pneumonia by reading chest X-ray images.iScience. 2022 Apr 15;25(4):104031. doi: 10.1016/j.isci.2022.104031. Epub 2022 Mar 6. iScience. 2022. PMID: 35280932 Free PMC article.
-
Diagnosis of Coronavirus Disease From Chest X-Ray Images Using DenseNet-169 Architecture.SN Comput Sci. 2023;4(3):214. doi: 10.1007/s42979-022-01627-7. Epub 2023 Feb 17. SN Comput Sci. 2023. PMID: 36811126 Free PMC article. Review.
-
A survey on deep learning models for detection of COVID-19.Neural Comput Appl. 2023 May 27:1-29. doi: 10.1007/s00521-023-08683-x. Online ahead of print. Neural Comput Appl. 2023. PMID: 37362568 Free PMC article. Review.
Cited by
-
Classification of Alzheimer's Disease Using Maximal Information Coefficient-Based Functional Connectivity with an Extreme Learning Machine.Brain Sci. 2023 Jul 8;13(7):1046. doi: 10.3390/brainsci13071046. Brain Sci. 2023. PMID: 37508978 Free PMC article.
-
A stacked ensemble for the detection of COVID-19 with high recall and accuracy.Comput Biol Med. 2021 Aug;135:104608. doi: 10.1016/j.compbiomed.2021.104608. Epub 2021 Jun 30. Comput Biol Med. 2021. PMID: 34247135 Free PMC article.
-
A multi-class classification framework for disease screening and disease diagnosis of COVID-19 from chest X-ray images.Multimed Tools Appl. 2023;82(10):14367-14401. doi: 10.1007/s11042-022-13710-5. Epub 2022 Sep 21. Multimed Tools Appl. 2023. PMID: 36157353 Free PMC article.
-
Explanatory classification of CXR images into COVID-19, Pneumonia and Tuberculosis using deep learning and XAI.Comput Biol Med. 2022 Nov;150:106156. doi: 10.1016/j.compbiomed.2022.106156. Epub 2022 Oct 3. Comput Biol Med. 2022. PMID: 36228463 Free PMC article.
-
A Comprehensive Survey of COVID-19 Detection Using Medical Images.SN Comput Sci. 2021;2(6):434. doi: 10.1007/s42979-021-00823-1. Epub 2021 Aug 28. SN Comput Sci. 2021. PMID: 34485924 Free PMC article.
References
-
- King DE. Dlib-ml: A machine learning toolkit. J Mach Learn Res. 2009 Dec 1;10:1755–8.
-
- Goodfellow I, Bengio Y, Courville A, Bengio Y. Deep learning, vol. 1. Cambridge: MIT Press; 2016.
LinkOut - more resources
Full Text Sources