. 2021 Nov 4;138(18):1740-1756.
doi: 10.1182/blood.2020009903.

Regulation of RNA polymerase II activity is essential for terminal erythroid maturation

Affiliations

Regulation of RNA polymerase II activity is essential for terminal erythroid maturation

Zachary C Murphy et al. Blood. .

Abstract

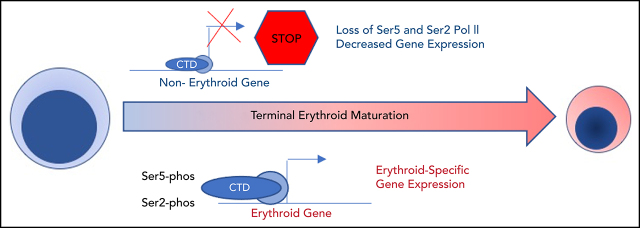
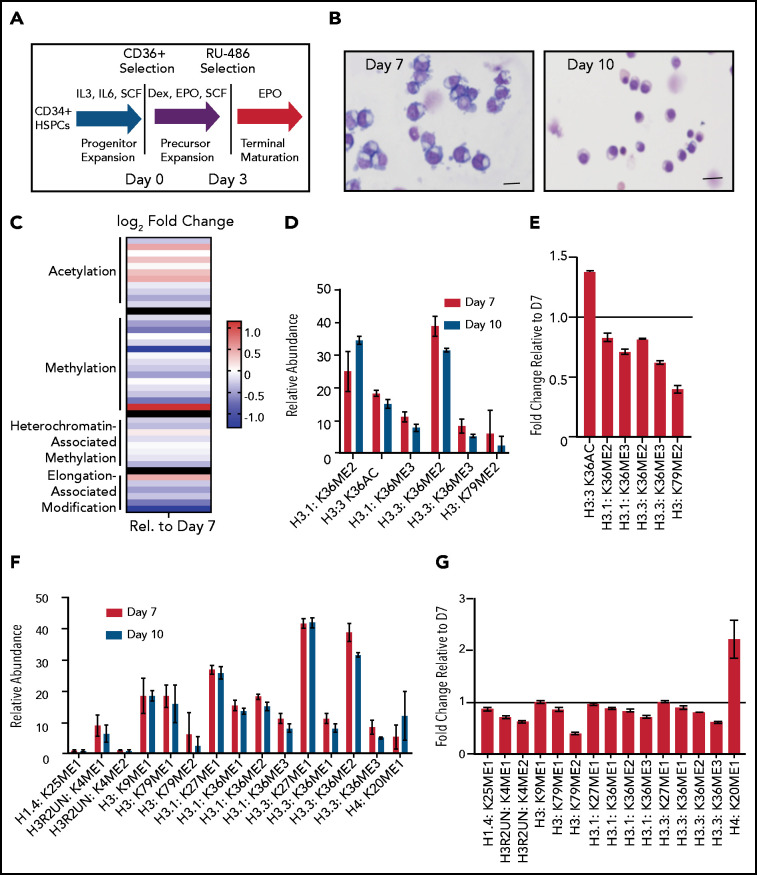
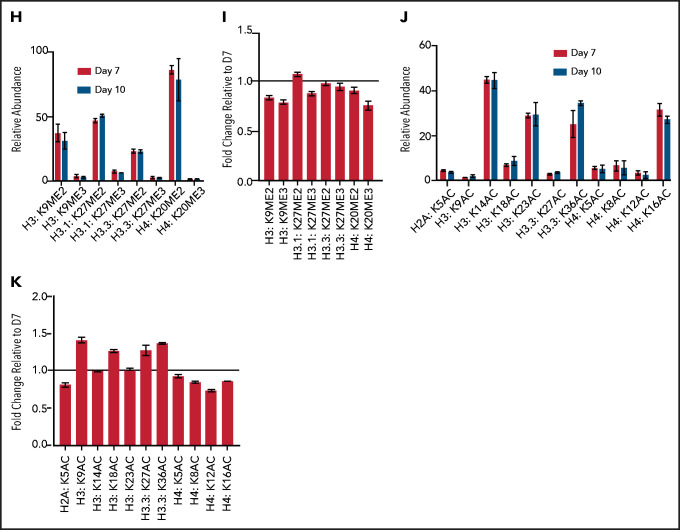
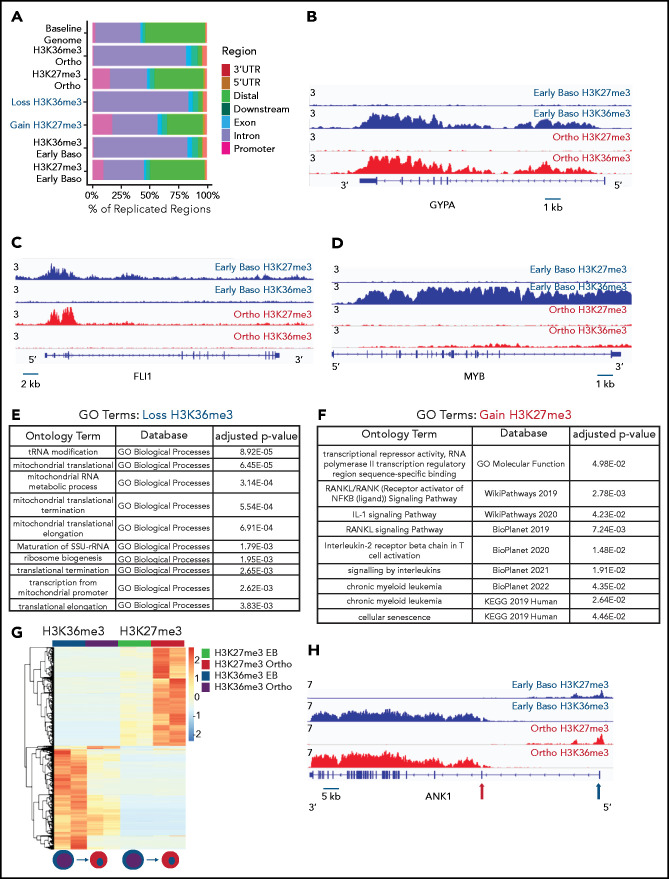
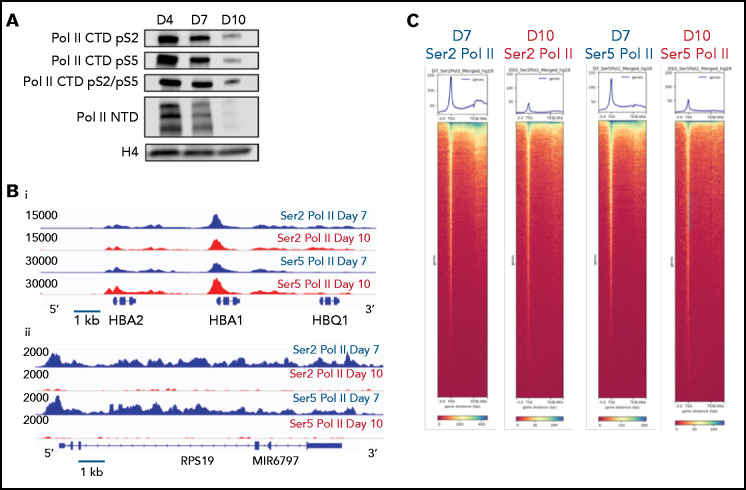
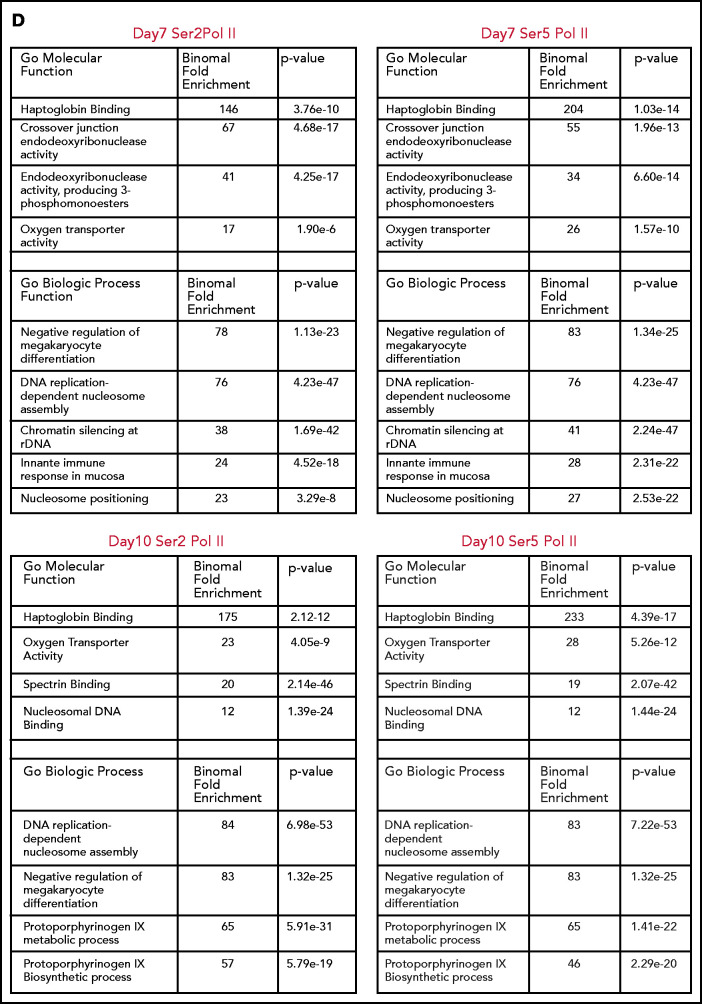
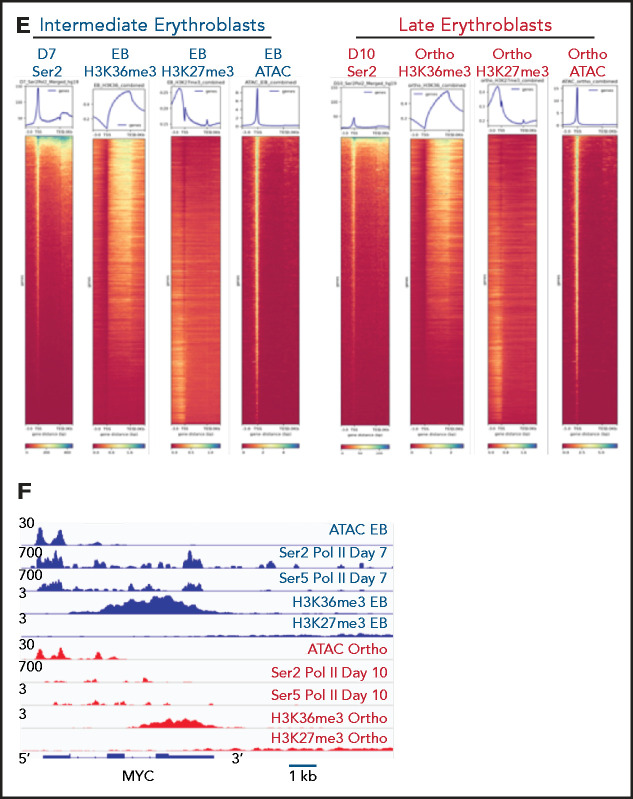
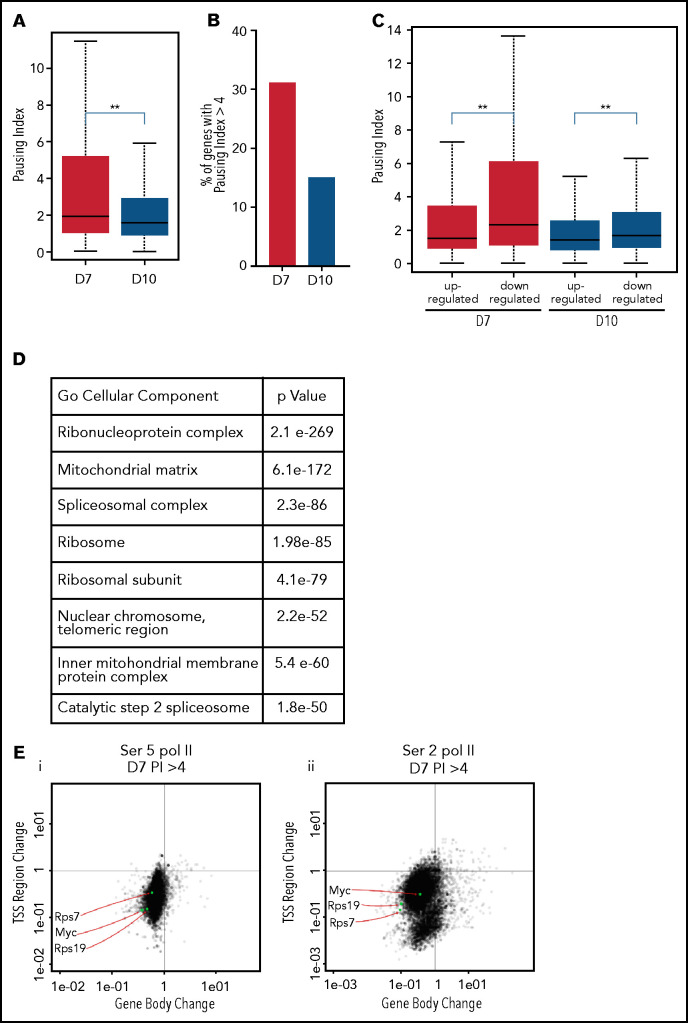
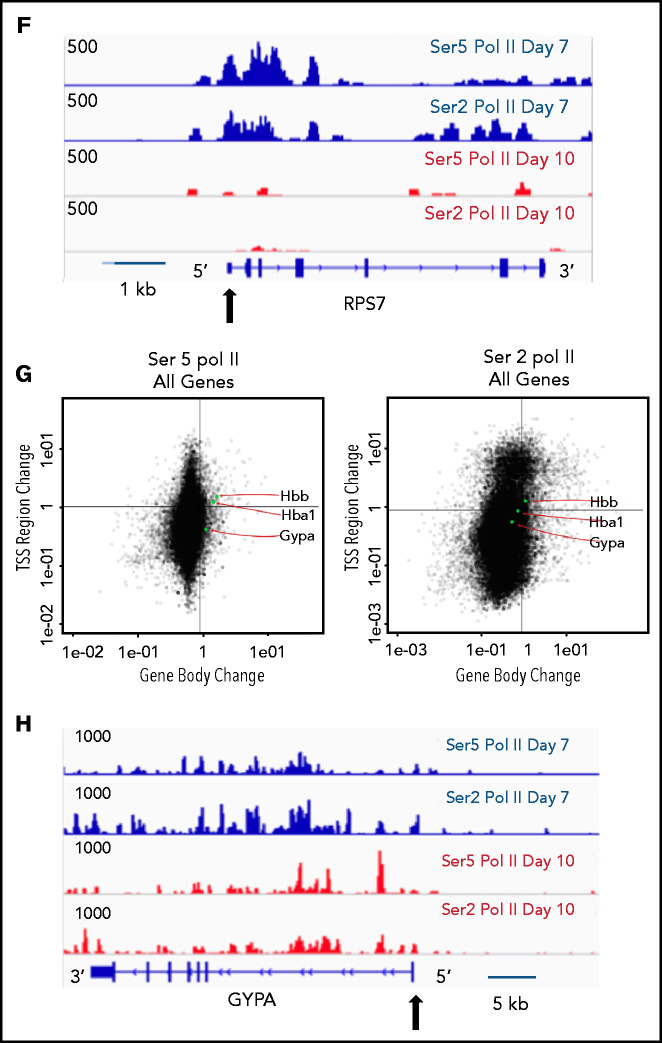
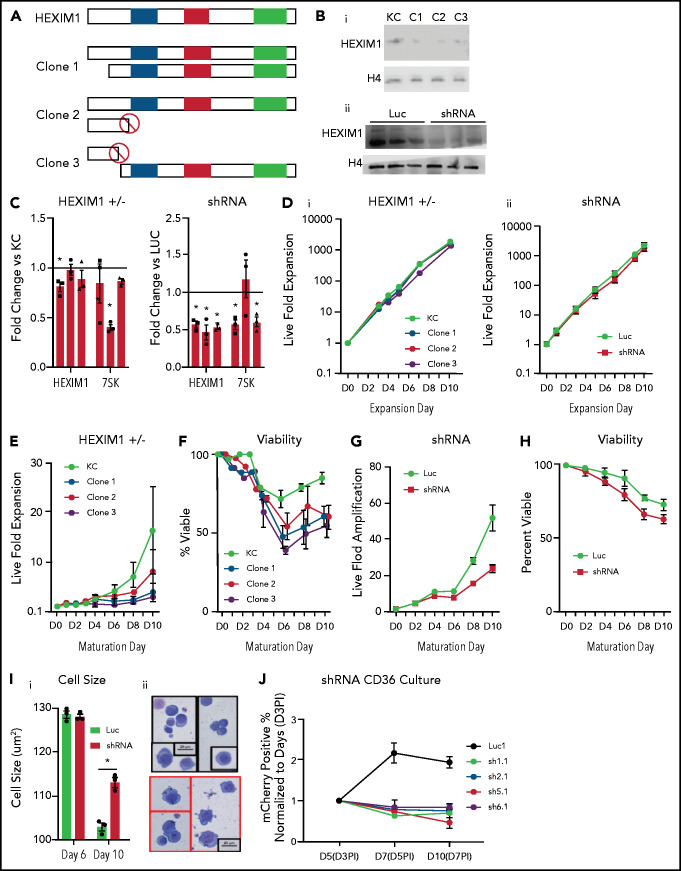
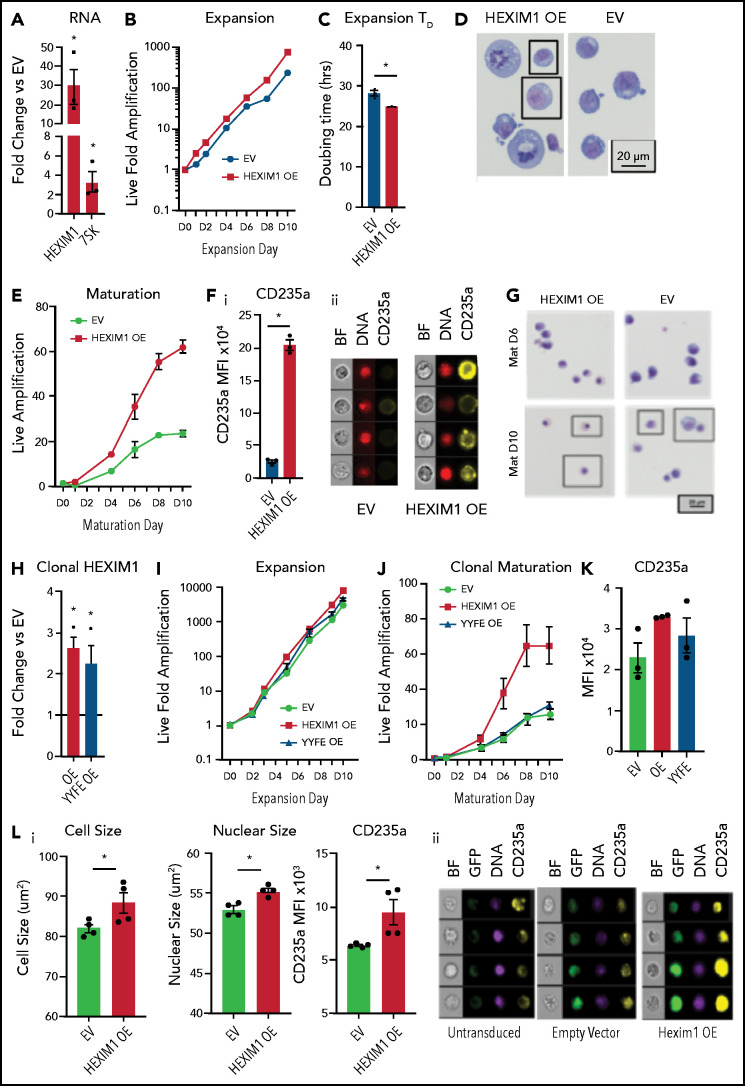
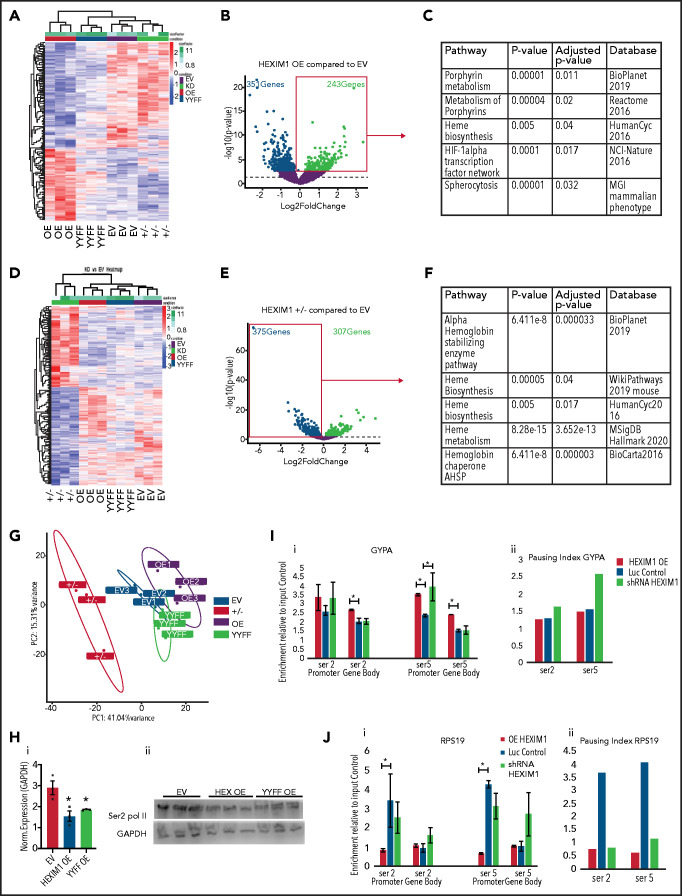
The terminal maturation of human erythroblasts requires significant changes in gene expression in the context of dramatic nuclear condensation. Defects in this process are associated with inherited anemias and myelodysplastic syndromes. The progressively dense appearance of the condensing nucleus in maturing erythroblasts led to the assumption that heterochromatin accumulation underlies this process, but despite extensive study, the precise mechanisms underlying this essential biologic process remain elusive. To delineate the epigenetic changes associated with the terminal maturation of human erythroblasts, we performed mass spectrometry of histone posttranslational modifications combined with chromatin immunoprecipitation coupled with high-throughput sequencing, Assay for Transposase Accessible Chromatin, and RNA sequencing. Our studies revealed that the terminal maturation of human erythroblasts is associated with a dramatic decline in histone marks associated with active transcription elongation, without accumulation of heterochromatin. Chromatin structure and gene expression were instead correlated with dynamic changes in occupancy of elongation competent RNA polymerase II, suggesting that terminal erythroid maturation is controlled largely at the level of transcription. We further demonstrate that RNA polymerase II "pausing" is highly correlated with transcriptional repression, with elongation competent RNA polymerase II becoming a scare resource in late-stage erythroblasts, allocated to erythroid-specific genes. Functional studies confirmed an essential role for maturation stage-specific regulation of RNA polymerase II activity during erythroid maturation and demonstrate a critical role for HEXIM1 in the regulation of gene expression and RNA polymerase II activity in maturing erythroblasts. Taken together, our findings reveal important insights into the mechanisms that regulate terminal erythroid maturation and provide a novel paradigm for understanding normal and perturbed erythropoiesis.


Figures

None
Graphical abstract
Figure 1.
Figure 1.
Terminal erythroid maturation is associated with loss of histone PTM associated with active transcriptional elongation. (A) Schematic demonstrating CD36 erythroid synchronization culture system. CD34-positive cells are expanded for 7 days before CD36 selection. CD36-positive cells are cultured for an additional 11 days allowing for terminal erythroid maturation. (B) Cytospins of cells at day 7 and day 10 of terminal erythroid maturation. (C) Heat map of changes in histone abundance during terminal erythroid maturation as determined by mass spectrometry. Values represent log2 fold change of day 10 compared with day 7 of terminal erythroid maturation. (D) Abundance of histone modifications associated with active transcription by RNA polymerase II on day 7 and day 10 of terminal maturation. (E) Fold change of transcription related histone marks at day 10 relative to day 7. (F) Abundance of histone methylation PTM at day 7 and day 10 of terminal maturation. Only histone PTM present at greater than 1% abundance are shown. (G) Fold change of histone methylation at day 10 relative to day 7. (H) Abundance of histone PTMs associated with heterochromatin at day 7 and day 10 of terminal maturation. Only histone PTMs with an abundance greater than 1% are shown. (I) Fold change of heterochromatin-associated PTMs at day 10 relative to day 7. (J) Abundance of histone acetylation at day 7 and day 10 of terminal maturation. Only histone PTMs with an abundance greater than 1% are shown. (K) Fold change of histone acetylation marks at day 10 relative to day 7. The data in this figure represent 2 biologic and 6 technical replicates. Error bars represent standard error of the mean.
Figure 1.
Figure 1.
Terminal erythroid maturation is associated with loss of histone PTM associated with active transcriptional elongation. (A) Schematic demonstrating CD36 erythroid synchronization culture system. CD34-positive cells are expanded for 7 days before CD36 selection. CD36-positive cells are cultured for an additional 11 days allowing for terminal erythroid maturation. (B) Cytospins of cells at day 7 and day 10 of terminal erythroid maturation. (C) Heat map of changes in histone abundance during terminal erythroid maturation as determined by mass spectrometry. Values represent log2 fold change of day 10 compared with day 7 of terminal erythroid maturation. (D) Abundance of histone modifications associated with active transcription by RNA polymerase II on day 7 and day 10 of terminal maturation. (E) Fold change of transcription related histone marks at day 10 relative to day 7. (F) Abundance of histone methylation PTM at day 7 and day 10 of terminal maturation. Only histone PTM present at greater than 1% abundance are shown. (G) Fold change of histone methylation at day 10 relative to day 7. (H) Abundance of histone PTMs associated with heterochromatin at day 7 and day 10 of terminal maturation. Only histone PTMs with an abundance greater than 1% are shown. (I) Fold change of heterochromatin-associated PTMs at day 10 relative to day 7. (J) Abundance of histone acetylation at day 7 and day 10 of terminal maturation. Only histone PTMs with an abundance greater than 1% are shown. (K) Fold change of histone acetylation marks at day 10 relative to day 7. The data in this figure represent 2 biologic and 6 technical replicates. Error bars represent standard error of the mean.
Figure 2.
Figure 2.
Genomic regions that lose the elongation mark HK36me3 do not gain the heterochromatin mark H3K27me3. (A) Genomic distribution of H3K36me3 and H3K27me3 in intermediate (early basophilic erythroblasts) and late (orthochromatic) erythroblasts relative to known genomic features. Early and late erythroblasts for these studies were sorted from CD34+ cultures based on cell surface marker expression. The antibody used for these experiments cannot distinguish different isoforms of histone H3. (B-D) Occupancy of H3K36me3 and H3K27me3 in indicated erythroid populations at the glycophorin A (GYPA; B), FLI1 (C), and MYB (D) loci. (E) Gene ontogeny terms associated with regions that lose H3K36me3 during maturation. (F) Gene ontogeny terms associated with regions that gain H3K27me3 during maturation. (G) Heatmap depicting hierarchically clustered and z-score normalized differentially bound regions identified through maturation (basophilic erythroblast to orthochromatic erythroblast) for H3K36me3 and H3K27me3. (H) Occupancy of H3K36me3 and H3K27me3 in indicated erythroid populations at the Ankryin1 locus. Red arrow depicts erythroid ankyrin promoter and black arrow depicts the neural ankyrin promoter.
Figure 3.
Figure 3.
Dynamic changes in RNA polymerase II occupancy during terminal maturation. (A) Western blot demonstrating levels of serine 2 phosphorylated (Ser2), serine 5 phosphorylated (Ser5), and total RNA polymerase II (Pol II) in day 4, day 7, and day 10 cells from the erythroid culture shown in Figure 1A. Histone H4 is used as a loading control. (B) Ser2 and Ser 5 Pol II occupancy at the α globin gene (i) and RPS19 (ii) gene in intermediate (day 7) and late (day 10) erythroblasts from the culture system shown in Figure 1A. (C) Heatmap depicting occupancy of Ser2 and Ser5 Pol II intermediate (Day 7) and late (Day 10) erythroblasts as determined by cut and tag. (D) Gene ontogeny analyses via GREAT of the top 1000 regions of Ser2 and Ser5 Pol II occupancy in intermediate (day 7) and late (day 10) erythroblasts. (E) Chromatin changes associated with loss of Ser2 Pol II occupancy during maturation. The heatmaps are ordered according to Ser2 Pol II occupancy in day 7 cells. (F) Changes in chromatin accessibility, Ser2 Pol II, Ser5 Pol II, H3K36me3 and H3K27me3 occupancy at the MYC locus during erythroid maturation.
Figure 3.
Figure 3.
Dynamic changes in RNA polymerase II occupancy during terminal maturation. (A) Western blot demonstrating levels of serine 2 phosphorylated (Ser2), serine 5 phosphorylated (Ser5), and total RNA polymerase II (Pol II) in day 4, day 7, and day 10 cells from the erythroid culture shown in Figure 1A. Histone H4 is used as a loading control. (B) Ser2 and Ser 5 Pol II occupancy at the α globin gene (i) and RPS19 (ii) gene in intermediate (day 7) and late (day 10) erythroblasts from the culture system shown in Figure 1A. (C) Heatmap depicting occupancy of Ser2 and Ser5 Pol II intermediate (Day 7) and late (Day 10) erythroblasts as determined by cut and tag. (D) Gene ontogeny analyses via GREAT of the top 1000 regions of Ser2 and Ser5 Pol II occupancy in intermediate (day 7) and late (day 10) erythroblasts. (E) Chromatin changes associated with loss of Ser2 Pol II occupancy during maturation. The heatmaps are ordered according to Ser2 Pol II occupancy in day 7 cells. (F) Changes in chromatin accessibility, Ser2 Pol II, Ser5 Pol II, H3K36me3 and H3K27me3 occupancy at the MYC locus during erythroid maturation.
Figure 4.
Figure 4.
The pausing index changes during terminal maturation and is associated with transcriptional repression. (A) Pausing index in day 7 and day 10 cells, as determined by Ser5 Pol II ChIP-seq. Similar results were obtained with Ser5 and Ser2 cut and tag (supplemental Figure 11). ** P < 2.2e-16. (B) Percent of genes with pausing index >4 in day 7 and day 10 cells, determined by analyses of Ser5 Pol II ChIP-seq. (C) Pausing index at upregulated and downregulated genes at day 7 and day 10, determined by analyses of Ser5 Pol II ChIP-seq. (D) Pathway analyses of downregulated genes with pausing index >4. (E) Quadrant plots showing the change in Ser 2 Sol II and Ser 5 Pol II occupancy at the promoter and gene body as cells mature from day 7 to day 10. The plots show genes that have a pausing index >4 in day 7 cells, with Ser5 Pol II (i) and Ser2 Pol II (ii). (F) Changes in Ser2 Pol II and Ser5 Pol II occupancy at the RPS7 locus, which has a PI >4 at day 7, during erythroid maturation. Black arrow denotes the promoter. (G) Quadrant plots showing the change in Ser2 and Ser5 Pol II occupancy at the promoter and gene body for all genes during maturation, with the location of erythroid specific genes highlighted. (H) Changes in Ser2 Pol II and Ser 5 Pol II occupancy at the GYPA locus, which is a highly expressed gene during erythroid maturation, and maintains high levels of Ser2 Pol II and Ser5 Pol II. Black arrow denotes the promoter. **P < 0.2.2e-16.
Figure 4.
Figure 4.
The pausing index changes during terminal maturation and is associated with transcriptional repression. (A) Pausing index in day 7 and day 10 cells, as determined by Ser5 Pol II ChIP-seq. Similar results were obtained with Ser5 and Ser2 cut and tag (supplemental Figure 11). ** P < 2.2e-16. (B) Percent of genes with pausing index >4 in day 7 and day 10 cells, determined by analyses of Ser5 Pol II ChIP-seq. (C) Pausing index at upregulated and downregulated genes at day 7 and day 10, determined by analyses of Ser5 Pol II ChIP-seq. (D) Pathway analyses of downregulated genes with pausing index >4. (E) Quadrant plots showing the change in Ser 2 Sol II and Ser 5 Pol II occupancy at the promoter and gene body as cells mature from day 7 to day 10. The plots show genes that have a pausing index >4 in day 7 cells, with Ser5 Pol II (i) and Ser2 Pol II (ii). (F) Changes in Ser2 Pol II and Ser5 Pol II occupancy at the RPS7 locus, which has a PI >4 at day 7, during erythroid maturation. Black arrow denotes the promoter. (G) Quadrant plots showing the change in Ser2 and Ser5 Pol II occupancy at the promoter and gene body for all genes during maturation, with the location of erythroid specific genes highlighted. (H) Changes in Ser2 Pol II and Ser 5 Pol II occupancy at the GYPA locus, which is a highly expressed gene during erythroid maturation, and maintains high levels of Ser2 Pol II and Ser5 Pol II. Black arrow denotes the promoter. **P < 0.2.2e-16.
Figure 5.
Figure 5.
HEXIM1 disruption impairs erythroid cell proliferation and viability. (A) Schematic demonstrates the genetic mutations in the alleles of HEXIM1 for the 3 clonal KITCAT cell lines. (B) Western blot showing HEXIM1 protein levels in KITKAT HEXIM1 ± and KITCAT control lines (KC; i). Western blot showing HEXIM1 protein levels in HUDEP2 cells expressing shRNA targeting HEXIM1 (ii). For both blots, H4 is used as a loading control. (C) HEXIM1 and 7SK levels in KITKAT HEXIM1 ± lines and HUDEP2 cell lines expressing pooled shRNA targeting HEXIM1 or luciferase control. (D) Live fold expansion of clonal HEXIM1 ± mutant lines (i) and shRNA HEXIM1 lines (ii) in expansion conditions. (E) Live fold expansion of HEXIM1 ± mutant lines in maturation conditions. (F) Viability of clonal HEXIM1 ± mutant lines in maturation conditions. (G) Live fold expansion of HUDEP2 lines expressing shRNA targeting HEXIM1 in maturation conditions. (H) Viability of HUDEP2 lines expressing shRNA targeting HEXIM1 in maturation conditions. (I) Imaging flow cytometric quantification of cell size (i) and representative cytospins (ii). (J) Live fold expansion of cells expressing indicated mCherry-HEXIM1 shRNA or luciferase control. Cells were transduced on day 3 (D3) following CD36 selection in the CD34+ erythroid culture system shown in Figure 1A. Data are presented as % of mCherry positive cells relative to day 3 after infection (D3PI). Error bars for all figures represent standard error of the mean of 3 independent cultures. *P < .05 compared with control.
Figure 6.
Figure 6.
HEXIM1 OE promotes erythroid expansion. (A) HEXIM1 and 7SK levels in HUDEP2 cultures with OE of HEXIM1. (B) Live fold expansion HEXIM1 OE and EV control cultures in expansion conditions. (C) Quantified doubling time for HEXIM1 OE compared with empty vector. (D) Cytosopins of HEXIM1 OE and EV cultures. (E) Live fold expansion HEXIM1 OE and EV control cultures in maturation conditions. (F) Quantification of CD235a levels in HEXIM1 OE and EV control cells on 4 days of maturation (i). Representative images from IDEAS software showing brightfield (BF), DNA (DRAQ5 staining), and CD235a (GYPA) staining (ii). (G) Cytopsins of HEXIM1 OE and EV cultures on day 6 and day 10 of maturation. (H) Expression of HEXIM1 in clonal lines of HUDEP2 cells expressing EV, WT HEXIM1, or HEXIM1 containing 2 amino acid substitutions: Y271F and Y274F (YYFF). (I) Live fold expansion of clonal lines expressing EV, WT HEXIM1, or YYFF HEXIM1 in expansion conditions. (J) Live fold expansion for indicated lines in maturation conditions. (K) CD235a levels in indicated populations. (L) Imaging flow cytometric analyses of HEXIM1 OE and EV cells following HEXIM1 OE on day 3 of the CD34+ erythroid culture shown in Figure 1A. (i) Quantification of cell size, nuclear size, and CD235a expression. (ii) Representative images from Ideas software. *P < .05 compared with empty vector control line.
Figure 7.
Figure 7.
Hexim1 OE alters erythroid gene expression and RNA polymerase II phosphorylation. (A) Heatmap showing genes that are differentially expressed in HEXIM1 OE compared with empty vector (EV) control. (B) Volcano plot of genes differentially expressed in HEXIM1 OE compared with EV control. (C) Gene set enrichment analyses using the ENRICHR platform of genes upregulated in EV compared with control. (D) Heatmap showing genes that are differentially expressed in HEXIM1+/− crispr lines(+/−) compared with EV control. (E) Volcano plot of genes differentially expressed in HEXIM1+/− compared with EV control. (F) Gene set enrichment analyses using the ENRICHR platform of genes downregulated in HEXIM1+/− compared with control. (G). Principle component analyses of HEXIM1 OE, EV, YYFF, and ±RNA-seq studies. (H) Western blot showing Ser2 Pol II levels in EV, HEXIM1 OE, and YYFF lines (ii) with quantification (i). (I) ChIP-qPCR for Ser2 and Ser5 Pol II at the GYPA locus in HEXIM1 OE, EV, and shRNA lines. Ser2 and Ser5 Pol II occupancy at the promoter and gene body (i). Pausing index in indicated lines (ii). (J) ChIP-qPCR for Ser2 and Ser5 Pol II at the RPS19 locus in HEXIM1 OE, EV, and shRNA lines. Ser2 and Ser5 Pol II occupancy at the promoter and gene body (i). Pausing index is shown in the indicated lines (ii). *P < .05. Western blot data represent 3 independent blots of distinct cultures. ChIP-PCR data represent 2 to 3 biologic replicates.

Comment in

  • When Pol II sees red.
    Xie M, Bungert J. Xie M, et al. Blood. 2021 Nov 4;138(18):1648-1649. doi: 10.1182/blood.2021012453. Blood. 2021. PMID: 34735000 Free PMC article. No abstract available.

References

    1. Palis J. Primitive and definitive erythropoiesis in mammals. Front Physiol. 2014;5:3. - PMC - PubMed
    1. Iolascon A, Heimpel H, Wahlin A, Tamary H.. Congenital dyserythropoietic anemias: molecular insights and diagnostic approach. Blood. 2013;122(13):2162-2166. - PMC - PubMed
    1. Della Porta MG, Travaglino E, Boveri E, et al. ; Rete Ematologica Lombarda (REL) Clinical Network . Minimal morphological criteria for defining bone marrow dysplasia: a basis for clinical implementation of WHO classification of myelodysplastic syndromes. Leukemia. 2015;29(1):66-75. - PubMed
    1. Ji P, Murata-Hori M, Lodish HF.. Formation of mammalian erythrocytes: chromatin condensation and enucleation. Trends Cell Biol. 2011;21(7):409-415. - PMC - PubMed
    1. Popova EY, Krauss SW, Short SA, et al. . Chromatin condensation in terminally differentiating mouse erythroblasts does not involve special architectural proteins but depends on histone deacetylation. Chromosome Res. 2009;17(1):47-64. - PMC - PubMed

Publication types