

In vivo imaging reveals mature Oligodendrocyte division in adult Zebrafish
- PMID: 34075520
- PMCID: PMC8169745
- DOI: 10.1186/s13619-021-00079-3
In vivo imaging reveals mature Oligodendrocyte division in adult Zebrafish
Abstract
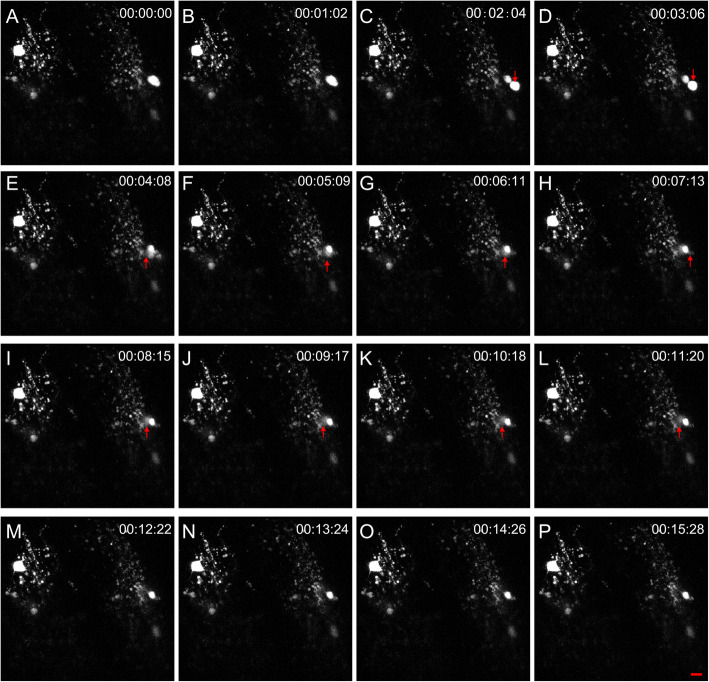
Whether mature oligodendrocytes (mOLs) participate in remyelination has been disputed for several decades. Recently, some studies have shown that mOLs participate in remyelination by producing new sheaths. However, whether mOLs can produce new oligodendrocytes by asymmetric division has not been proven. Zebrafish is a perfect model to research remyelination compared to other species. In this study, optic nerve crushing did not induce local mOLs death. After optic nerve transplantation from olig2:eGFP fish to AB/WT fish, olig2+ cells from the donor settled and rewrapped axons in the recipient. After identifying these rewrapping olig2+ cells as mOLs at 3 months posttransplantation, in vivo imaging showed that olig2+ cells proliferated. Additionally, in vivo imaging of new olig2+ cell division from mOLs was also captured within the retina. Finally, fine visual function was renewed after the remyelination program was completed. In conclusion, our in vivo imaging results showed that new olig2+ cells were born from mOLs by asymmetric division in adult zebrafish, which highlights the role of mOLs in the progression of remyelination in the mammalian CNS.
Keywords: Asymmetric division; In vivo imaging; Mature oligodendrocyte; Remyelination; Zebrafish.
Conflict of interest statement
The authors declare that they have no competing interests.
Figures


Similar articles
-
Notch Signaling Controls Oligodendrocyte Regeneration in the Injured Telencephalon of Adult Zebrafish.Exp Neurobiol. 2020 Dec 31;29(6):417-424. doi: 10.5607/en20050. Exp Neurobiol. 2020. PMID: 33281119 Free PMC article.
-
The role of oligodendrocytes and oligodendrocyte progenitors in CNS remyelination.Adv Exp Med Biol. 1999;468:183-97. doi: 10.1007/978-1-4615-4685-6_15. Adv Exp Med Biol. 1999. PMID: 10635029 Review.
-
The adult oligodendrocyte can participate in remyelination.Proc Natl Acad Sci U S A. 2018 Dec 11;115(50):E11807-E11816. doi: 10.1073/pnas.1808064115. Epub 2018 Nov 28. Proc Natl Acad Sci U S A. 2018. PMID: 30487224 Free PMC article.
-
High Vulnerability of Oligodendrocytes to Oxidative Stress Induced by Ultrafine Urban Particles.Antioxidants (Basel). 2020 Dec 22;10(1):4. doi: 10.3390/antiox10010004. Antioxidants (Basel). 2020. PMID: 33375107 Free PMC article.
-
Role of adult oligodendrocytes in remyelination after neural injury.J Neurotrauma. 1992 Mar;9 Suppl 1:S93-103. J Neurotrauma. 1992. PMID: 1588636 Review.
Cited by
-
Optimized in vivo two-photon imaging reveals the essential role of the contralateral eye in functional optic nerve regeneration in zebrafish larvae.Eye Vis (Lond). 2025 Aug 25;12(1):34. doi: 10.1186/s40662-025-00447-z. Eye Vis (Lond). 2025. PMID: 40855517 Free PMC article.
-
How do different cell populations orchestrate myelin regeneration?Biochem Soc Trans. 2025 Jun 30;53(3):653-669. doi: 10.1042/BST20231085. Biochem Soc Trans. 2025. PMID: 40552465 Free PMC article. Review.
-
Oligodendrocyte origin and development in the zebrafish visual system.J Comp Neurol. 2023 Mar;531(4):515-527. doi: 10.1002/cne.25440. Epub 2022 Dec 7. J Comp Neurol. 2023. PMID: 36477827 Free PMC article.
-
Mechanism by which Rab5 promotes regeneration and functional recovery of zebrafish Mauthner axons.Neural Regen Res. 2025 Jun 1;20(6):1816-1824. doi: 10.4103/NRR.NRR-D-23-00529. Epub 2024 Apr 3. Neural Regen Res. 2025. PMID: 39104118 Free PMC article.
-
Oligodendroglial heterogeneity in health, disease, and recovery: deeper insights into myelin dynamics.Neural Regen Res. 2025 Nov 1;20(11):3179-3192. doi: 10.4103/NRR.NRR-D-24-00694. Epub 2024 Dec 7. Neural Regen Res. 2025. PMID: 39665821 Free PMC article.
References
-
- Ankerhold R, Stuermer CA. Fate of oligodendrocytes during retinal axon degeneration and regeneration in the goldfish visual pathway. J Neurobiol. 1999;41(4):572–584. - PubMed
-
- Arenella LS, Herndon RM. Mature oligodendrocytes. Division following experimental demyelination in adult animals. Arch Neurol. 1984;41(11):1162–1165. - PubMed
-
- Arnett HA, Mason J, Marino M, Suzuki K, Matsushima GK, Ting JPY. TNF alpha promotes proliferation of oligodendrocyte progenitors and remyelination. Nat Neurosci. 2001;4(11):1116–1122. - PubMed
-
- Craner MJ, Damarjian TG, Liu SJ, Hains BC, Lo AC, Black JA, et al. Sodium channels contribute to microglia/macrophage activation and function in EAE and MS. Glia. 2005;49(2):220–229. - PubMed
Grants and funding
LinkOut - more resources
Full Text Sources
Molecular Biology Databases