. 2021 Aug;8(15):e2100418.
doi: 10.1002/advs.202100418. Epub 2021 Jun 2.

Toward Mechanochromic Soft Material-Based Visual Feedback for Electronics-Free Surgical Effectors

Affiliations

Toward Mechanochromic Soft Material-Based Visual Feedback for Electronics-Free Surgical Effectors

Goffredo Giordano et al. Adv Sci (Weinh). 2021 Aug.

Abstract

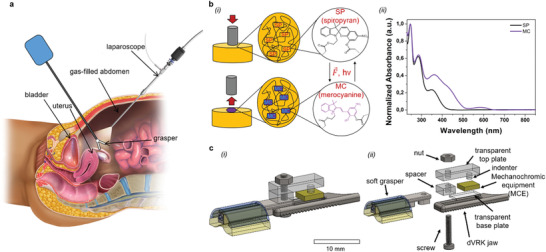
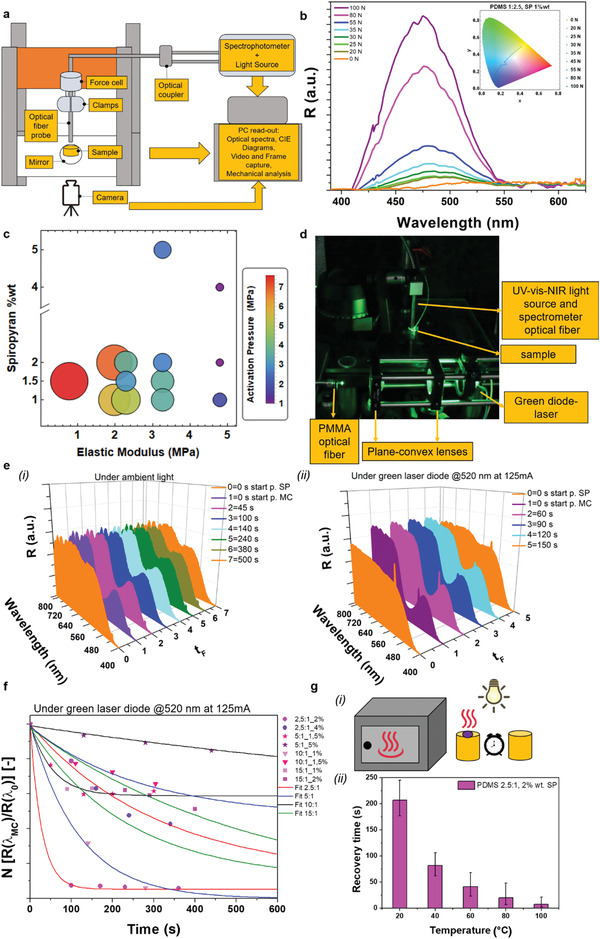
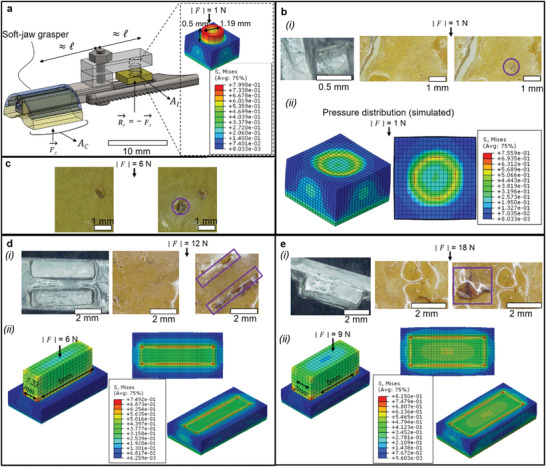
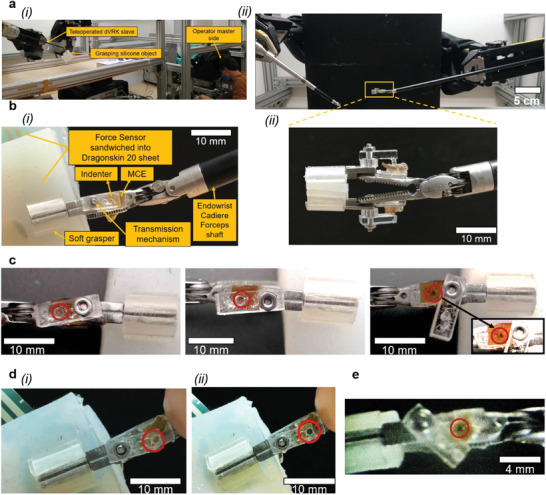
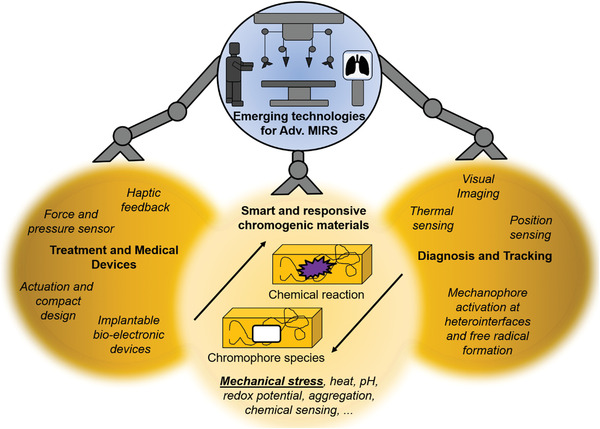
A chromogenically reversible, mechanochromic pressure sensor is integrated into a mininvasive surgical grasper compatible with the da Vinci robotic surgical system. The sensorized effector, also featuring two soft-material jaws, encompasses a mechanochromic polymeric inset doped with functionalized spiropyran (SP) molecule, designed to activate mechanochromism at a chosen pressure and providing a reversible color change. Considering such tools are systematically in the visual field of the operator during surgery, color change of the mechanochromic effector can help avoid tissue damage. No electronics is required to control the devised visual feedback. SP-doping of polydimethylsiloxane (2.5:1 prepolymer/curing agent weight ratio) permits to modulate the mechanochromic activation pressure, with lower values around 1.17 MPa for a 2% wt. SP concentration, leading to a shorter chromogenic recovery time of 150 s at room temperature (25 °C) under green light illumination. Nearly three-times shorter recovery time is observed at body temperature (37 °C). To the best of knowledge, this study provides the first demonstration of mechanochromic materials in surgery, in particular to sensorize unpowered surgical effectors, by avoiding dramatic increases in tool complexity due to additional electronics, thus fostering their application. The proposed sensing strategy can be extended to further tools and scopes.

Keywords: biomedical; mechanochromic grasper; mechanochromism; minimally invasive surgery; spiropyran; surgical grasper; visual feedback.


Conflict of interest statement

The authors declare no conflict of interest.

Figures

Figure 1
Figure 1
a) A pictorial representation of the anatomical districts where grasping/retraction surgical tasks are commonly performed. The blue box represents tool activation: for a surgical robotic platform like the dVRK used in this study, that box is a placeholder for teleoperated robotic slaves. The inspection endoscope is systematically used during surgery, so that 3D colored visual feedback can be leveraged to assist the surgeon. The anatomical representation is adapted by Blausen.com staff (2014). Medical gallery of Blausen Medical 2014. WikiJournal of Medicine 1 (2). DOI: 10.15347/wjm. b) (i) The mechanophore SP covalently bonded to the polymeric matrix. The mechanical indentation returns the spiro C─O bonding scission, reporting the classical SP‐to‐MC colored reversible reaction. (ii) Absorbance spectra of the SP form dissolved in dichloromethane (black line), MC (violet line). The MC spectrum reveals an absorbance peak at 560 nm, suggesting that green light can foster the reversible backward MC‐to‐SP reaction. In general, MC under white light it is favored to return to the SP form. c) (i) Assembly and (ii) exploded view of the MCE and the soft grasper, devised as add‐on onto the rigid jaw (dVRK jaw) of a standard dVRK tool. The mechanochromic capability is provided by an SP‐doped silicone acting as MCE posed in between a transparent top plate and the fenestrated dVRK jaw, and laid down on a transparent base plate. For ease of development, the clutching pressure is transferred to indenters acting on the MCE, so that mechanochromic activation can be associated with a certain clutching pressure value. The surgeon is informed when reaching the aforementioned clutching level by the color change associated with mechanochromic activation.
Figure 2
Figure 2
a) Custom‐made optomechanical setup. A universal testing machine was used, with the lower clamp substituted by a rigid transparent support. The SP‐doped elastomeric sample was laid down on the rigid constraint, and a highly reflective mirror in the visible range was mounted below. An optical fiber was mechanically clamped at the force cell connection. A UV–vis–NIR light source enlightened the sample to measure the colorimetric reflectance. The reflected light was decoupled in a spectrophotometer. Both mechanical and optical setup were connected to the PC‐readout, to collect optical spectra, CIE‐1931 diagram, mechanical force and displacement, as well as video and frame captures. b) Reflectance (R) spectra of the PDMS (2.5:1), 1% wt. SP‐doped sample detected by the optical fiber probe. Color legend describes the different spectra at fixed compression force detected by the universal testing machine. Spectra are normalized, defining the unit value at the dominant color of the SP‐doped elastomer (yellowish around 580 nm) not mechanochromically activated, and then highlighting the mechanochromic peak at around 480 nm. Increasing the indentation force, the changing coloration becomes more evident and entirely covers the indentation surface (Figure S2, Supporting Information). Inset: CIE‐1931 color diagram for the same sample. Every dot represents a triad of coordinates resulting in a macroscopic color detectable by the human eye. All the dots are connected to better visualize the blue shift. c) Mechanochromic activation pressure (averaged value per each sample with minimum n = 3 repetitions) bubble chart, based on polysiloxanes with several concentrations of SP‐doping. Polysiloxanes are identified by their elastic modulus determined in Table 1 (sample size n = 5, mean ± SD, curing temperature 90 °C, time curing 9 h). The size of the bubble radius and the color legend represent the activation pressure (extended data in Figure S4, Supporting Information, the asymmetric whiskers represent the largest and smallest values, i.e., range, for the n = 13 sample with at least three repetitions per each value). d) Optical test bench for time‐dependent MC‐to‐SP reaction in a black box. A green laser was supplied (DC power supply at 125 mA). The light was driven and the spot was collimated and reduced by means of two plane convex lenses into a PMMA‐optical fiber, and sent to the doped PDMS‐based samples. A UV–vis–NIR highly reflectance mirror was mounted below the transparent support holding the sample. The mirror spread the green light on the MC activated sample, and the optical fiber, which was connected to the UV–vis–NIR light source and to the spectrophotometer, collected the reflectance spectra. A digital timer counted the chromogenic recovery time. e) (i) Chromogenic recovery time of a PDMS (2.5:1), 2% wt. SP‐doped sample (cured at 90 °C per 9 h), under ambient light and at room temperature (25 °C), with n = 2 test repetitions. (ii) Chromogenic recovery time of a PDMS (2.5:1), 2% wt. SP‐doped sample (cured at 90 °C per 9 h), under green diode laser lighting and at room temperature (25 °C), with n = 2 test repetitions. f) Decay time characterization for all the SP‐doped PDMS samples (same optical bench as above). Time trend of the reflectance peak value at λ MC = 480 nm, normalized by the value at the dominant wavelength (λ 0 around 580 nm for all the composition except for the PDMS 15:1 about 650 nm). Data reported are averaged on n = 2 samples (error bars are not reported for ease of visualization). g) (i) PDMS 2.5:1 with 2% wt. SP‐doping (cured at 90 °C per 9 h) was heated at different temperatures through an oven (from 20 up to 100 °C). (ii) Corresponding chromogenic recovery times. The reported values on the bar chart are representative of the mean value on n = 5 test repetitions for each temperature. The asymmetric whiskers represent the range defined as the difference between the largest and smallest observations (Table S1, Supporting Information).
Figure 3
Figure 3
a) Schematic of the pressure transmission elements mapping the clutching pressure to the indentation pressure also based on the corresponding clutching areas. b) (i) MCE indentation (cylindrical indenter) at 1 N: (left) optical microscope image of the indenter, (middle) sample prior to compression, and (right) sample after compression (mechanochromic activation highlighted through the circle). (ii) Complementary stress distribution obtained by numerical simulations. c) MCE indentation (same cylindrical indenter as above) at 6 N, (left) prior and (right) after compression (mechanochromic activation highlighted through the circle). d) (i) MCE indentation (two parallelepipedal indenters) at 12 N: (left) optical microscope image of the indenter, (middle) sample prior to compression, and (right) sample after compression (mechanochromic activation highlighted through the rectangle). (ii) Complementary stress distribution obtained by numerical simulations. e) (i) MCE indentation (two parallelepipedal indenters) at 18 N: (left) optical microscope image of the indenter, (middle) sample prior to compression, and (right) sample after compression (mechanochromic activation highlighted through the rectangle). (ii) Complementary stress distribution obtained by numerical simulations.
Figure 4
Figure 4
a) The dVRK platform used for the final grasper demonstration: (i) master side and (ii) slave side. b) Mechanochromic grasper, implemented as add‐on onto a dVRK tool (Endowrist Cadiere Forceps), clutching a soft sample: (i) key components, (ii) side view highlighting the pressure transmission elements. c) Teleoperated mechanochromic grasper clutching a soft sample at 5 N: (left) prior to mechanochromic activation, (middle) after mechanochromic activation, (right) activated spot highlighted by removing the covering Plexiglas plate. d) Mechanochromic grasper clutching a soft sample at 7 N (by directly pulling tool cables): (i) prior to mechanochromic activation and (ii) after mechanochromic activation. The force sensor, which was sandwiched between the grasped soft sheets to simultaneously measure the clutching force, is visible in the upper‐left figure region. e) Endoscopic image of the activated mechanochromic grasper, as acquired through the endoscopic camera natively integrated in the dVRK platform.
Figure 5
Figure 5
Schematic outlook to the potential extended use of chromophores in minimally invasive surgery, and in particular for robotic surgery (MIRS), for both diagnostic and interventional tasks. The present study, indeed, provides the first application of mechanocromism in MIRS, yet the demonstrated integration of such responsive materials in miniature tools can pave the way for further tools and applications.

Similar articles

Cited by

References

    1. Enayati N., De Momi E., Ferrigno G., IEEE Rev. Biomed. Eng. 2016, 9, 49. - PubMed
    1. Zarrin P. S., Escoto A., Xu R., Patel R. V., Naish M. D., Trejos A. L., IEEE Sens. J. 2018, 18, 2816.
    1. Sheetz K. H., Claflin J., Dimick J. B., JAMA Network Open 2020, 3, 1918911. - PMC - PubMed
    1. Johnson K. O., Curr. Opin. Neurobiol. 2001, 11, 455. - PubMed
    1. Suzuki H., Wood R. J., Nat. Mach. Intell. 2020, 2, 437.

Publication types

LinkOut - more resources