

Paternal obesity and its transgenerational effects on gastrointestinal function in male rat offspring
- PMID: 34076145
- PMCID: PMC8186378
- DOI: 10.1590/1414-431X2020e11116
Paternal obesity and its transgenerational effects on gastrointestinal function in male rat offspring
Abstract
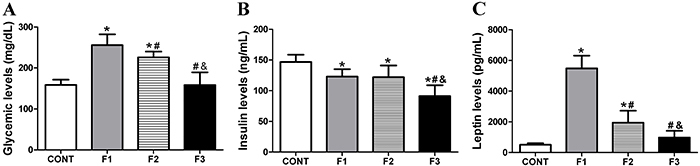
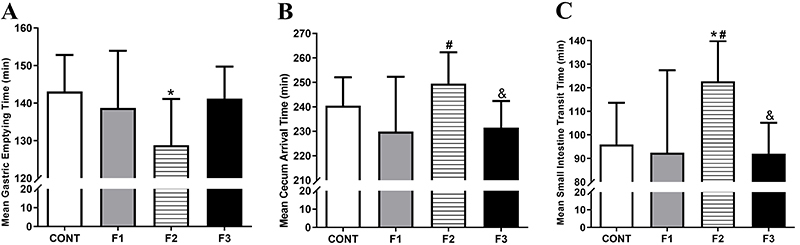
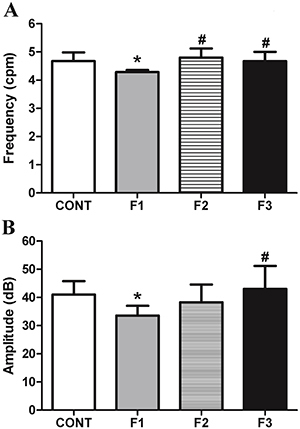
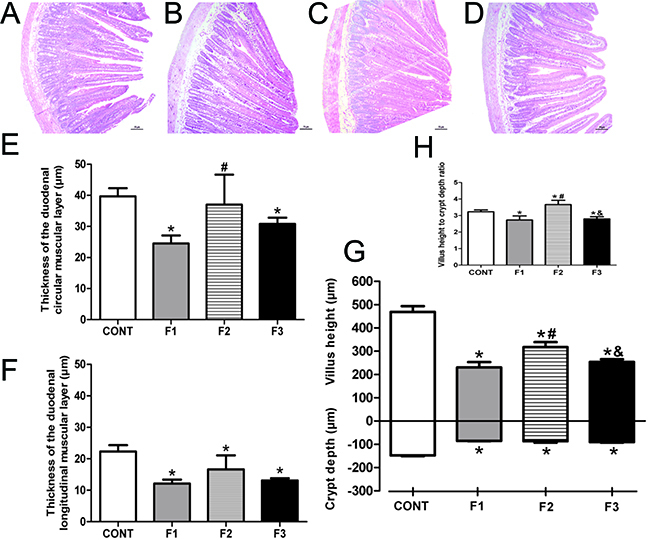
The interplay between obesity and gastrointestinal (GI) motility is contradictory, and the transgenerational influence on this parameter is unknown. We aimed to evaluate the GI function in a model of paternal obesity and two subsequent generations of their male offspring. Newborn male rats were treated with monosodium glutamate (MSG) and composed the F1 generation, while control rats (CONT) received saline. At 90 days, male F1 were mated with non-obese females to obtain male offspring (F2), which later mated with non-obese females for obtaining male offspring of F3 generation. Lee Index analysis was adopted to set up the obesity groups. Alternating current biosusceptometry (ACB) technique was employed to calculate GI transit parameters: mean gastric emptying time (MGET), mean cecum arrival time (MCAT), mean small intestinal transit time (MSITT), and gastric frequency and amplitude of contractions. Glucose, insulin, and leptin levels and duodenal morphometry were measured. F1 obese rats showed a decrease in the frequency and amplitude of gastric contractions, while obese rats from the F2 generation showed accelerated MGET and delayed MCAT and MSITT. Glucose and leptin levels were increased in F1 and F2 generations. Insulin levels decreased in F1, F2, and F3 generations. Duodenal morphometry was altered in all three generations. Obesity may have paternal transgenerational transmission, and it provoked disturbances in the gastrointestinal function of three generations.
Figures
Similar articles
-
Effect of the induction of transgenerational obesity on maternal-fetal parameters.Syst Biol Reprod Med. 2018 Feb;64(1):51-59. doi: 10.1080/19396368.2017.1410866. Epub 2017 Dec 11. Syst Biol Reprod Med. 2018. PMID: 29227690
-
Transgenerational effects of obesity and malnourishment on diabetes risk in F2 generation.Mol Cell Biochem. 2016 Jan;412(1-2):269-80. doi: 10.1007/s11010-015-2633-6. Epub 2015 Dec 26. Mol Cell Biochem. 2016. PMID: 26708218
-
Cross-fostering reduces obesity induced by early exposure to monosodium glutamate in male rats.Endocrine. 2017 Jan;55(1):101-112. doi: 10.1007/s12020-016-0965-y. Epub 2016 Apr 26. Endocrine. 2017. PMID: 27116693
-
Multigenerational and transgenerational impact of paternal bisphenol A exposure on male fertility in a mouse model.Hum Reprod. 2020 Aug 1;35(8):1740-1752. doi: 10.1093/humrep/deaa139. Hum Reprod. 2020. PMID: 32644108
-
[The transgenerational mechanisms in developmental programming of metabolic diseases].Rev Invest Clin. 2009 Jan-Feb;61(1):41-52. Rev Invest Clin. 2009. PMID: 19507474 Review. Spanish.
References
MeSH terms
Substances
LinkOut - more resources
Full Text Sources
Medical
Miscellaneous
