. 2021 Jul 5;218(7):e20201354.
doi: 10.1084/jem.20201354. Epub 2021 Jun 2.

The molecular and epigenetic mechanisms of innate lymphoid cell (ILC) memory and its relevance for asthma

Affiliations

The molecular and epigenetic mechanisms of innate lymphoid cell (ILC) memory and its relevance for asthma

Mukesh Verma et al. J Exp Med. .

Abstract

Repetitive exposure of Rag1-/- mice to the Alternaria allergen extract generated a form of memory that elicited an asthma-like response upon a subthreshold recall challenge 3-15 wk later. This memory was associated with lung ICOS+ST2+ ILC2s. Genetic, pharmacologic, and antibody-mediated inhibition and adoptive transfer established an essential role for ILC2s in memory-driven asthma. ATAC-seq demonstrated a distinct epigenetic landscape of memory ILC2s and identified Bach2 and AP1 (JunD and Fosl2) motifs as major drivers of altered gene accessibility. scRNA-seq, gene knockout, and signaling studies suggest that repetitive allergenic stress induces a gene repression program involving Nr4a2, Zeb1, Bach2, and JunD and a preparedness program involving Fhl2, FosB, Stat6, Srebf2, and MPP7 in memory ILC2s. A mutually regulated balance between these two programs establishes and maintains memory. The preparedness program (e.g., Fhl2) can be activated with a subthreshold cognate stimulation, which down-regulates repressors and activates effector pathways to elicit the memory-driven phenotype.


Conflict of interest statement

Disclosures: M. Gorska reported a book contract with Springer Nature. The book will describe methods and protocols to study asthma. The book is currently in preparation. No other disclosures were reported.

Figures

Figure 1.
Figure 1.
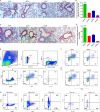
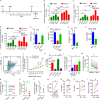
Establishment of a memory-driven asthma model in Rag1−/− mice. (A) A schematic diagram of the timeline of allergen exposure, recall challenge, and performance of experiments. Groups of Rag1−/− female mice were intranasally exposed to Alt (5 µg in 20 µl of Sal/dose) or Sal three alternate d/wk in weeks 1–3 and then rested for 3 wk. The mice had a recall challenge in week 7 with a subthreshold dose (1.25 µg/dose) of Alt on three consecutive days and then were examined for airway hyperreactivity and immunological alterations 3 d later. (B) Increase in lung resistance over baseline (as measured by flexiVent) in response to increasing doses of inhaled methacholine in Alt/Alt, Alt/Sal, Sal/Alt, and Sal/Sal groups. ***, P < 0.0001 versus control groups, two-way ANOVA, n = 10/group. (C) Differential leukocyte counts of BAL. **, P < 0.001; ***, P < 0.0001, two-way ANOVA, n = 10/group. Eos, eosinophil; Lym, lymphocyte; PMN, polymorphonuclear cell. (D) Eosinophils (CD45+Siglec8+CCR3+ cells) in the lung from the study groups. Blood-depleted lung tissue from the study mice was digested with collagenase, and the single-cell suspension from the lung digest was stained and analyzed for eosinophils by FCM. ***, P < 0.0001, one-way ANOVA, n = 10/group. (E and F) IL5 and IL13 (measured by ELISA) in BAL. ***, P < 0.0001, n = 10/group, one-way ANOVA. (G–J) ICOS+ST2+, ICOS+, IL5+, and IL13+ ILC2s in the lung. Single-cell suspensions from the lung, processed as described above, were stained and analyzed for ICOS+ST2+, ICOS+, IL5+, and IL13+ ILC2s (CD45+CD25+ lung cells) by FCM. ***, P < 0.0001, n = 10/group, one-way ANOVA.
Figure S1.
Figure S1.
Representative histological images and gating strategy for flow cytometry. (A–D) Histological changes in the memory model. (A and B) H&E staining and morphometric quantification of the lung tissue from the experimental groups: Sal/Alt, Alt/Sal, Alt/Alt, and Sal/Sal. ***, P < 0.0001. (C and D) Peribronchial collagen deposition and its morphometric quantification from the study groups as described previously (Christianson et al., 2015). ***, P < 0.0001 as compared with other groups, one-way ANOVA, n = 10 per group. Scale bars are 100 µm, and the images were acquired at 20×. BM, bone marrow. (E–G) FCM analysis of lung ILCs from the study groups. Blood-depleted mouse lungs from the study groups were digested with collagenase, and single cells were stained with antibodies against CD45, CD25, ICOS, ST2, IL5, and IL13. Following gating live single cells, they were further gated for CD45+CD25+ cells and then analyzed for ICOS+ST2+, IL5+ICOS+ST2+, and IL13+ICOS+ST2+ cells. (F) Representative flow cytograms showing ICOS+ST2+ cells from the four study groups. (G) Fluorescence minus one (FMO) for the studied molecules used to develop the gating strategy. FSC, forward scatter; SSC, side scatter.
Figure S2.
Figure S2.
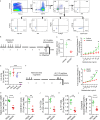
Flow cytometry of hematopoietic cells, RORα inhibition, and a short memory-induction protocol. (A) Representative flow cytograms examining TCRγδ+, Ly6G+/Ly6C+, NKp46+, CD11B+, NK1.1, and FcεRI+ cells in ICOS+ST2+ cells from the five study groups. (B–D) Effect of the RORα inverse agonist SR3335 on ILC2s. A schematic diagram of the timeline of RORα inverse agonist SR3335 in memory (B), reduced GATA3+ ILC2s (C), and airway hyperreactivity (D) in the memory model. *, P < 0.01; ***, P < 0.0001, unpaired t test, n = 5/group. (E) IL5+ ILC2s from the persistence of memory experiment. ***, P < 0.0001, one-way ANOVA, n = 3–5/group. (F–L) A short exposure model for memory-driven asthma in Rag1−/− mice. (F) A schematic diagram of the timeline of allergen exposure and recall challenge. Groups of Rag1−/− female mice were intranasally exposed to Alt (5 µg in 20 µl of Sal/dose) or Sal on alternate days for 3 d in 1 wk and then rested for 3 wk. The mice had a recall challenge in week 5 with a subthreshold dose (1.25 µg/dose) of Alt on three consecutive days and then were examined for airway hyperreactivity and immunological alterations. (G–L) Lung resistance over baseline (as measured by flexiVent) in response to increasing doses of inhaled methacholine (G), total ILCs (H), ICOS+ST2+ ILCs (I), IL5+ ILC2s (J), and IL13+ ILC2s (K) and eosinophils (L) in lung digest from the Alt/Alt and Sal/Alt study groups. **, P < 0.001; *** P < 0.0001, unpaired t test, n = 5/group.
Figure 2.
Figure 2.
The role of NK cells and ILCs in memory-driven asthma. (A–C) Role of NK cells and ILCs in memory-driven asthma. (A) A schematic diagram of the timeline of antibody and allergen exposure and recall challenge experiments. An aliquot of 200 µg of an anti-NK1.1 antibody was administered i.p. to Rag1−/− female mice 1 d before each Alt dose during the exposure phase, 1 d before the recall challenges, and 1 h before the last recall challenge. (B–D) A representative flow cytogram (B) for NK cells in the lung digest in NK1.1 antibody– and control antibody–treated mice, airway hyperreactivity (C) and lung eosinophils (CD45+SiglecF+ CCR3+ cells; D). (E–H) Lung ILC2s (CD45+NK1.1CD25+ICOS+ST2+ cells; E), total ILCs (CD45+CD25+ ILCs; F), IL13+ ILC2s (CD45+CD25+ICOS+ST2+ cells; G) and airway inflammation (H) in the memory model after depletion of NK cells. *, P < 0.01, n = 5, unpaired t test. FSC, forward scatter. (I and J) Induction of asthma by adoptive transfer of memory ILCs. CD45+NK1.1CD25+ICOS+ST2+ (ICOS+ST2+) and CD45+NK1.1CD25+ICOSST2 (double-negative) ILCs were obtained from Alt/Alt-treated mice. 50,000 cells were intravenously transferred to Rag2−/−:γc−/− mice. 1 d after the transfer, the recipient mice were challenged with Alt for three consecutive days and examined for airway hyperreactivity (lung resistance in response to methacholine) and IL13+ ILC2s 24 h later. **, P < 0.001; ***, P < 0.0001 (two-way ANOVA and unpaired t test, n = 4/group). (K) Naive Rag2−/−:γc−/− mice were challenged with Alt or Sal for three consecutive days and examined for airway hyperreactivity (lung resistance in response to methacholine). Two-way ANOVA, n = 5/group.
Figure 3.
Figure 3.
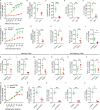
Effect of anti-CD90 antibody-mediated depletion of ILCs and duration of memory. (A) A timeline for anti-CD90.2 administration. (B–G) Effect of depletion ILCs by treatment with an anti-CD90 antibody (isotype antibody as a control) on airway hyperreactivity (B), lung eosinophils (C), ICOS+ST2+ ILC2s (D), IL5+ (E), IL13+ (F), and airway inflammation (G). BM, bone marrow. ***, P < 0.0001; **, P < 0.001; *, P < 0.01, unpaired t test in Rag1−/− mice sensitized and challenged with Alt. (H–K) The duration of persistence of memory. Rag1−/− mice were exposed to Alt as per Fig. 1 A and then had a recall (R) challenge with Alt in week (W) 6, 9, or 15 (labeled as 6, 9, or 15 W-R, respectively). A control group was exposed to Sal and challenged with Sal in week 15 (Sal/Sal). The mice had measurements of airway hyperreactivity (H; two-way ANOVA), lung eosinophils (I), CD45+CD25+ICOS+ST2+ ILCs (J), and IL13+ ILC2s (CD45+CD25+ICOS+ST2+; K) as described above. ***, P < 0.0001 versus Sal/Sal (one-way ANOVA, n = 3–5/group).
Figure 4.
Figure 4.
Importance of ICOS for memory-driven asthma. (A–E) ICOS−/−:Rag1−/− (I:R−/−) and Rag1−/− (R−/−) mice were subjected to the Alt-induced memory-driven asthma protocol as per Fig. 1 A. Airway hyperreactivity (A) was measured by flexiVent, two-way ANOVA. Lung eosinophils (CD45+SiglecF+CCR3+ cells; B), ST2+, IL5+, and IL13+ ILC2s (CD45+NK1.1CD25+ICOS+ST2+) cells were measured by FCM (C–E). *, P < 0.01; **, P < 0.001; ***, P < 0.0001, unpaired t test, n = 4/group. (FJ) ICOS−/− and littermate ICOS+/+ mice were subjected to the Alt-induced memory-driven asthma protocol as per Fig. 1 A. Airway hyperreactivity was measured by flexiVent (F). Lung eosinophils, ILCs (LinCD45+CD25+), ILC2s (LinCD45+CD25+PLZF+KLRG1+), and IL13+ ILC2s (CD45+LinCD25+PLZF+KLRG1+) cells were measured by FCM (G–J). *, P < 0.01; **, P < 0.001; ***, P < 0.0001; ns, not significant; two-way ANOVA. (K–P) Comparison of memory (ST2+) and nonmemory (ST2) ILCs between ICOS+/+ and ICOS−/− mice. The frequency of ST2 + ILC2s (K) and KLRG1+ IL13+ and IL5+ ILC2s in ST2+ and ST2 ILCs (L–P). *, P < 0.01; **, P < 0.001; ***, P < 0.0001, unpaired t test, n = 4–5/group. (Q–U) Rag1−/− mice were intranasally pretreated with an anti-ICOSL antibody or an isotype control antibody before recall challenge. Airway hyperreactivity (Q) was measured by flexiVent, two-way ANOVA. Lung eosinophils (CD45+SiglecF+CCR3+ cells; R), ICOS+ST2+ ILCs (CD45+CD25+; S), and IL5+, IL13+ ILC2s (CD45+CD25+ICOS+ST2+; T and U) in the lung digest were measured by FCM. ***, P < 0.001, unpaired t test, n = 4–5/group.
Figure S3.
Figure S3.
Role of ICOS and IL33 in memory and gating strategy for scRNA-seq. (A–C) Importance of ICOS for memory-associated asthma. ICOS−/−:Rag1−/− (I:R−/−) and Rag1−/− (R−/−) mice were subjected to the Alt-induced memory-driven asthma protocol as per Fig. 1 A. KLRG1+ST2+, CD127+ ST2+, and GATA3+ ILC2s (CD45+NK1.1CD25+) cells were measured by FCM. *, P < 0.01; **, P < 0.001; unpaired t test, n = 4/group. (D) A schematic diagram of the timeline of anti-ICOSL/isotype antibody exposure. (E–G) Role of IL33 in memory formation. IL33Cit/Cit and IL33+/+ mice were subjected to the Alt/Alt or Sal/Sal exposure and recall protocol as per Fig. 1 A. Airway hyperreactivity (E), lung IL13+ ILC2s (LinCD45+CD25+NK1.1ICOS+ST2+; F), and BAL eosinophils (G) were measured. ***, P < 0.0001, n = 5/group, unpaired t test. (H) scRNA-seq of lung CD45+ cells. Lung CD45+ cells were sorted following digestion of blood-depleted lungs with collagenase. Cells from each sample were subjected to scRNA-seq by Wafergen iCell8 protocol followed by Illumina Hi-seq sequencing. t-SNE coordinate clustering of cells with WGCNA network module eigengene expression overlaid for modules highly expressed in each particular cluster. Based on genes contained in the cell discriminatory modules, we defined the clusters as macrophages (turquoise), NK cells (black), dendritic cells (green), endothelial cells (brown), and ILC2s (blue). (I) The expression profile of CD45, Il2ra, Icos, and il1rl1 in each cell cluster is shown. (J) Partial separation of memory ILCs (Alt/− and Alt/Alt in red) from control ILCs (Sal/− and Sal/Alt in turquoise) by t-SNE analysis. A total of 161 and 136 genes were up- and down-regulated, respectively, in memory ILCs. (K) Expression of mRNA for Runx1 and Mpp7 in ILCs from the memory models. *, P < 0.01; **, P < 0.001, n = 5/group, one-way ANOVA. (L) The gating and sorting strategy for isolation of CD45+NK1.1CD25+ICOS+ cells for ATAC-seq. FSC, forward scatter; SSC, side scatter.
Figure 5.
Figure 5.
scRNA-seq of lung hematopoietic cells. (A) A schematic showing study design and timeline for scRNA of lung cells from the memory model. (B) A t-SNE feature plot showing clustering of all CD45+ lung cells with mean expression of the WGCNA blue module, which contains genes characteristic ILC2s. The ILC2 cluster (circled) expressed Il7r, Gata3, Il1rl1, and Icos (violin plots) and Rora and Nfkb1 (feature plots). (C) Log fold-change (LFC) of selected top 16 genes from the memory group 1B versus 1A (after and before recall) and Group1 (memory) versus Group 2 (Sal control). (D) qPCR analysis of mRNA expression of select genes identified by scRNA-seq in sorted ILCs from the lung tissue obtained from the study groups. *, P < 0.01; **, P < 0.001; ***, P < 0.0001, one-way ANOVA, n = 5/group. (E) FCM analysis of expression of CD44 and Thy1 on ICOS+ST2+ ILCs (CD45+CD25+ cells); and the expression of FHL2+, NR4A2 MPP7, and CCR8 in ICOS+ ILCs (CD45+CD25+) in the lung before and after recall. *, P < 0.01; **, P < 0.001; ***, P < 0.0001, n = 4–5/group, one-way ANOVA. Gr., group; Sac, sacrifice.
Figure 6.
Figure 6.
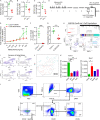
ATAC-seq of lung ILCs (sorted CD45+NK1.1CD25+ICOS+) from the memory models. As per Fig. 4 A. (A) PCA of ATAC data from the study groups: Alt exposure and no recall (Alt/−), Alt exposure and recall (Alt/Alt), Sal exposure and no recall (Sal/−), and Sal exposure and recall (Sal/Alt). n = 3 for all study groups except Alt/− (n = 2). (B and C) Heatmaps of differentially expressed DNA accessibility peaks between Alt/− versus Sal/− (B) and Alt/Alt versus Sal/Alt (C). (D and E) Volcano plots of differentially expressed DNA accessibility peaks between Alt/− versus Alt/Alt (D) and Alt/Alt versus Sal/Alt (E). FC, fold-change. (F and G) DNA accessibility tracing of two representative genes: Icos (F) and ST2 (il1rl1; G), which were differentially expressed both in ATAC-seq and scRNA-seq. (H and I) Top de novo motifs by HOMER analysis distinguishing Alt/− from Alt/Alt (H) and Alt/Alt from Sal/Alt (I).
Figure S4.
Figure S4.
ATAC-seq and gating strategy for ILCs. (A–D) Heatmaps of differentially expressed DNA accessibility peaks between Alt/− (blue) versus Sal/− (red; A) and Alt/Alt (blue) versus Sal/− (red; B). Distribution of ATAC-seq gene accessibility peaks among intergenic, intronic and promoter-TSS as compared Alt/− versus Sal/− (C) and Alt/Alt versus Alt/− (D). *, Statistical significance. (E) Expression of mRNA for JunD, Bach2 and Fra2 (Fosl2) in the lung from Alt-sensitized and recalled Fhl2+/+ and Fhl2−/− mice. **, P < 0.001; ***, P < 0.001, unpaired t test. (F) The expression of mRNA (qPCR) for the top motif genes (Bach2, JunD, Fra1, Fosl2, Stat6, and Srebf2) in the lung tissue from study groups. *, P < 0.01; **, P < 0.001; ***, P < 0.001, n = 8–10/group; **, P < 0.001; ***, P < 0.0001, n = 5/group, one-way ANOVA. (G) The gating strategy for FCM for lung cells from the wild-type and Fhl2−/− mice. FSC, forward scatter; SSC, side scatter.
Figure 7.
Figure 7.
The effect of Fhl2 gene deletion on memory-driven asthma. (A) The expression pattern (violin plots) of Fhl2 in ILC2s from the study groups that were examined by the single cells RNA-seq. Fhl2−/− and littermate Fhl2+/+ mice were subjected to the Alt-induced memory-driven asthma protocol as per Fig. 1 A. (B–G) Airway hyperreactivity (B; two-way ANOVA), lung eosinophils (CD45+SiglecF+CCR3+ cells; C), LinCD45+CD25+ST2+ cells (D), and IL5+ ILCs (E) were measured by FCM and IL5 in BAL by ELISA (F). Representative histological images of H&E staining of the lung tissue from Fhl2+/+ and Fhl2−/− mice from the memory model (n = 5/group; G). Scale bars are 100 µm and the images were acquired at 20×. (H and I) Comparison of memory (ICOS+ST2+) and nonmemory (ICOSST2) ILCs between Fhl2+/+ and Fhl2−/− mice. The frequency of ICOS+ST2+ memory ILCs and the expression of KLRG1, IL5, and IL13 in ICOS+ST2+ memory ILCs and ICOSST2 nonmemory ILCs were measured by FCM (H and I). *, P < 0.01; **, P < 0.001; ***, P < 0.0001, unpaired t test, n = 4–5/group.
Figure 8.
Figure 8.
Importance of Fhl2 in memory-associated signaling. (A–E) Fhl2−/−;Rag1−/− (F:R−/−) mice were sensitized and challenged with Alt and Sal as per Fig. 1 A and then examined for airway hyperreactivity and immunological changes. The increase in lung resistance over baseline (as measured by flexiVent) in response to increasing doses of inhaled methacholine (A), lung eosinophils (B), ICOS+ST2+ ILCs (C), IL5+ ILC2s (D), and IL13+ ILC2s (E). **, P < 0.001; ***, P < 0.001, unpaired t test, n = 5/group. (F) Double immunostaining of the lung tissue from the Alt/Sal and Sal/Sal study group for Fhl2 (red) and PAR2 (green). The insets show a higher magnification of cells displaying colocalization (yellow color; n = 5 mice/group). Scale bars are 20 µm. (G) Immunofluorescence staining of the lung tissue from Fhl2+/+ and Fhl2−/− B6 mice from the memory model for pERK1/2 (red) and p65NFkB and NFATc2 (green). The insets show nuclear localization of NF-κB and NFAT under a higher magnification. Scale bars are 20 µm. The last panel shows costaining of pERK1/2 (red) with CD3 (green). Scale bars are 10 µm. (H) Immunofluorescence staining of the lung tissue from the memory models from Rag1−/− mice for pERK1/2 (red). All sections were counterstained with DAPI (blue), and images were taken at 40×. Scale bars are 20 µm. (I and J) Quantification of pERK+, and nuclear NF-kB+ and NFAT+ cells in the lung tissue from Fhl2+/+ and Fhl2−/− mice (***, P < 0.001, unpaired t test; I) and the quantification for pERK1/2 in memory models from Rag1−/− mice (J). One-way ANOVA. ***, P < 0.0001. FOV, field of view.
Figure 9.
Figure 9.
Studies of ILC2 memory in wild-type mice. (A–F) Wild-type mice (C57BL/6) mice were subjected to the Alt-induced memory-driven asthma protocol as per Fig. 1 A. Airway hyperreactivity, as assessed by lung resistance to inhaled methacholine, was measured by flexiVent (A). Lung eosinophils (CD45+SiglecF+CCR3+ cells; B), total ILCs (LinCD45+CD25+; C), ICOS+ST2+ ILC2s (D), and IL5+ and IL13+ ILC2s (CD45+NK1.1CD25+ICOS+ST2+; E and F) cells were measured by FCM. **, P < 0.001; ***, P < 0.0001, unpaired t test, n = 4 or 5/group. (G–L) The role of NK cells in memory-driven asthma in wild-type mice. The protocol for NK cells depletion and allergen challenge in wild-type mice was similar to that described in Fig. 2 A. We measured airway hyperreactivity (G), lung eosinophils (CD45+SiglecF+CCR3+ cells; H), total ILCs (LinCD45+CD25+; I), ILC2s (CD45+NK1.1CD25+ICOS+ST2+ cells; J), and IL5+ and IL13+ ILC2s (CD45+NK1.1CD25+ICOS+ST2+; K and L). Unpaired t test, n = 5/group. (M–P) Comparison of the heatmaps of differentially expressed DNA accessibility peaks between the Alt/Alt and Sal/Alt groups (M). Volcano plots of differentially expressed DNA accessibility peaks from the Alt/Alt and Sal/Alt groups (N). Top de novo and known motifs by HOMER analysis distinguishing Alt/Alt from Sal/Alt (O and P). FC, fold-change.
Figure 10.
Figure 10.
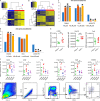
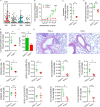
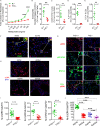
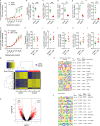
Role of Fhl2 in human memory ILC2s. (A) A schematic of in vitro memory induction in human blood ILCs. (B–D) Human PBMCs from 8 healthy (H) and 10 allergic asthmatic (As) patients were treated with medium (M) or Alt (5 µg/ml) for 48 h. After washing (3×) and culturing in medium for 6 d, the cells were rechallenged with medium or a subthreshold dose of Alt (1 µg/ml) for 24 h ICOS+ (B) and FHL2+ (C) and IL5+ (D) ILC2s (LinCD45+CRTH2+) were analyzed by FCM. One- and two-way ANOVA. *, P < 0.01; **, P < 0.001; ***, P < 0.0001. (E–H) Isolated blood Lin cells were cultured in medium alone (Med) or with Alt (5 µg/ml). An anti-PAR2 antibody or an isotype control antibody were added to select cultures (E). After 24 h, the cells were analyzed for PAR2 (E and F) or dectin-1 (G and H) by FCM (n = 3). *, P < 0.01; ***, P < 0.0001, one-way ANOVA or unpaired t test. (I and J) Single cells were isolated from a healthy human lung digest and analyzed for Fhl2 in CRTH2+ ILCs (CD45+Lin; I). CRTH2+Fhl2+ and CRTH2Fhl2 ILCs (CD45+Lin) lung cells (100,000) were adoptively transferred to Rag2−/−:γc−/− mice. The mice were challenged with Alt (5 µg/dose) for three consecutive days, and airway hyperreactivity was measured 48 h later. **, P < 0.001; ***, P < 0.0001, paired t test. n = 3/group, two-way ANOVA (J). (K) Comparison of IL13 expression by Fhl2+ and Fhl2 ILC2s (CD45+LinCRTH2+) from 8 healthy (H) and 10 asthma (As) patients, two-way ANOVA. *, P < 0.01; ***, P < 0.0001. (L) Human lung–derived mononuclear cells were cultured with medium, IL2/IL25, IL2/IL33 (10 ng/ml each), or Alt (5 µg/ml) for 10 d and then examined for Fhl2 expression by FCM (n = 6; *, P < 0.05), one-way ANOVA. (M–P) The frequency of Fhl2+ and IL5+Fhl2+ cells in Lin+ and Lin cell populations in PBMCs that were cultured with dexamethasone (Dexa; 10−7 M) or vehicle (ethanol) for 3 d. Mann–Whitney U test. *, P < 0.01. (Q–T) Effect of repetitive allergen injections on memory-related AP1 genes. PBMCs were isolated from seven allergic patients before and after rush allergen immunotherapy and stained ex vivo for c-Fos, JunD, and JunB in Lin cells. *, P < 0.01.

Similar articles

Cited by

References

    1. Agrawal, S., Agrawal A., Doughty B., Gerwitz A., Blenis J., Van Dyke T., and Pulendran B.. 2003. Cutting edge: different Toll-like receptor agonists instruct dendritic cells to induce distinct Th responses via differential modulation of extracellular signal-regulated kinase-mitogen-activated protein kinase and c-Fos. J. Immunol. 171:4984–4989. 10.4049/jimmunol.171.10.4984 - DOI - PubMed
    1. Anders, S., Pyl P.T., and Huber W.. 2015. HTSeq--a Python framework to work with high-throughput sequencing data. Bioinformatics. 31:166–169. 10.1093/bioinformatics/btu638 - DOI - PMC - PubMed
    1. Ashraf, S., Hegazy Y.K., and Harmancey R.. 2019. Nuclear receptor subfamily 4 group A member 2 inhibits activation of ERK signaling and cell growth in response to β-adrenergic stimulation in adult rat cardiomyocytes. Am. J. Physiol. Cell Physiol. 317:C513–C524. 10.1152/ajpcell.00526.2018 - DOI - PMC - PubMed
    1. Bartolomé, R.A., García-Palmero I., Torres S., López-Lucendo M., Balyasnikova I.V., and Casal J.I.. 2015. IL13 Receptor α2 Signaling Requires a Scaffold Protein, FAM120A, to Activate the FAK and PI3K Pathways in Colon Cancer Metastasis. Cancer Res. 75:2434–2444. 10.1158/0008-5472.CAN-14-3650 - DOI - PubMed
    1. Buenrostro, J.D., Wu B., Chang H.Y., and Greenleaf W.J.. 2015. ATAC-seq: A Method for Assaying Chromatin Accessibility Genome-Wide. Curr. Protoc. Mol. Biol. 109:21.29.1–21.29.9. 10.1002/0471142727.mb2129s109 - DOI - PMC - PubMed

Publication types