. 2021 Jun 2;46(3):E402-E414.
doi: 10.1503/jpn.200185.

Chronic lithium treatment alters the excitatory/ inhibitory balance of synaptic networks and reduces mGluR5-PKC signalling in mouse cortical neurons

Affiliations

Chronic lithium treatment alters the excitatory/ inhibitory balance of synaptic networks and reduces mGluR5-PKC signalling in mouse cortical neurons

Anouar Khayachi et al. J Psychiatry Neurosci. .

Abstract

Background: Bipolar disorder is characterized by cyclical alternation between mania and depression, often comorbid with psychosis and suicide. Compared with other medications, the mood stabilizer lithium is the most effective treatment for the prevention of manic and depressive episodes. However, the pathophysiology of bipolar disorder and lithium’s mode of action are yet to be fully understood. Evidence suggests a change in the balance of excitatory and inhibitory activity, favouring excitation in bipolar disorder. In the present study, we sought to establish a holistic understanding of the neuronal consequences of lithium exposure in mouse cortical neurons, and to identify underlying mechanisms of action.

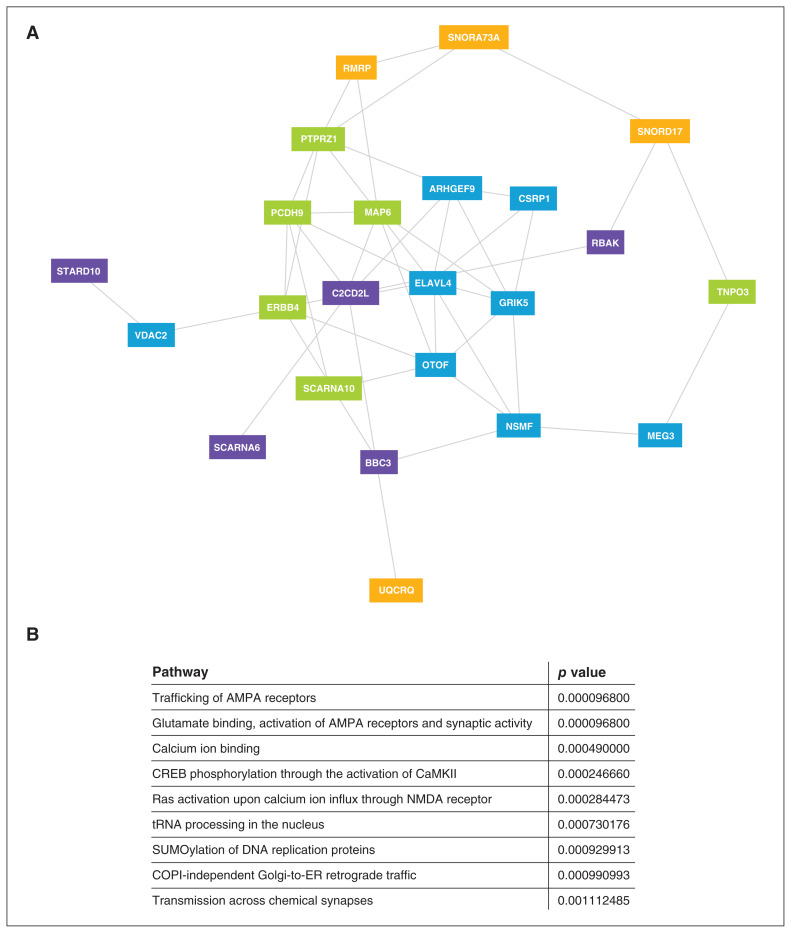
Methods: We used a range of technical approaches to determine the effects of acute and chronic lithium treatment on mature mouse cortical neurons. We combined RNA screening and biochemical and electrophysiological approaches with confocal immunofluorescence and live-cell calcium imaging.

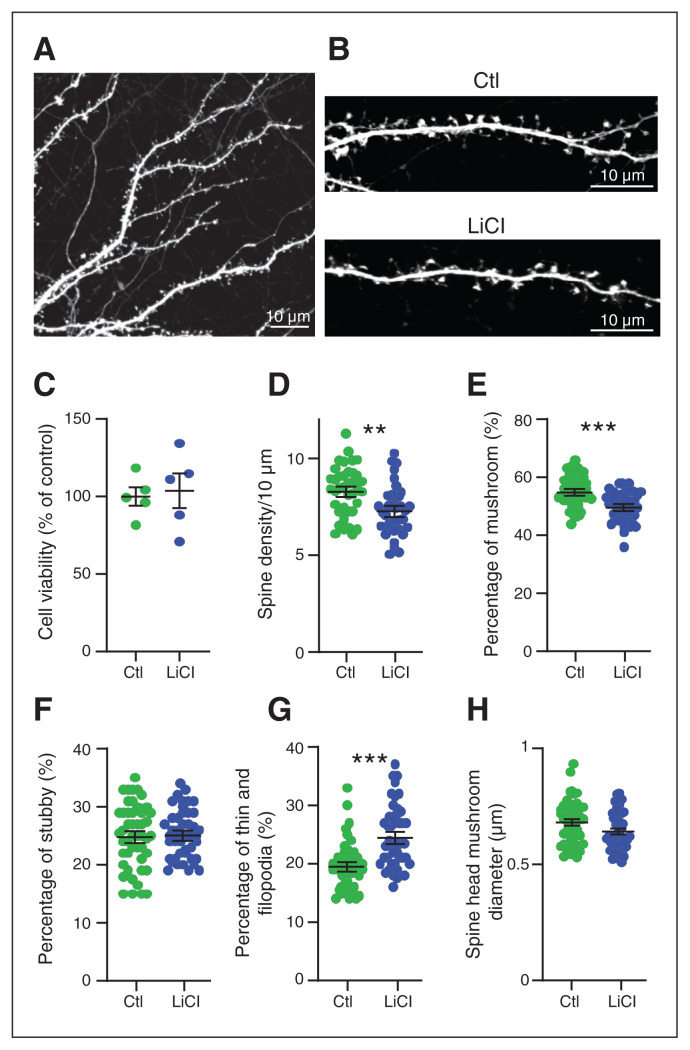
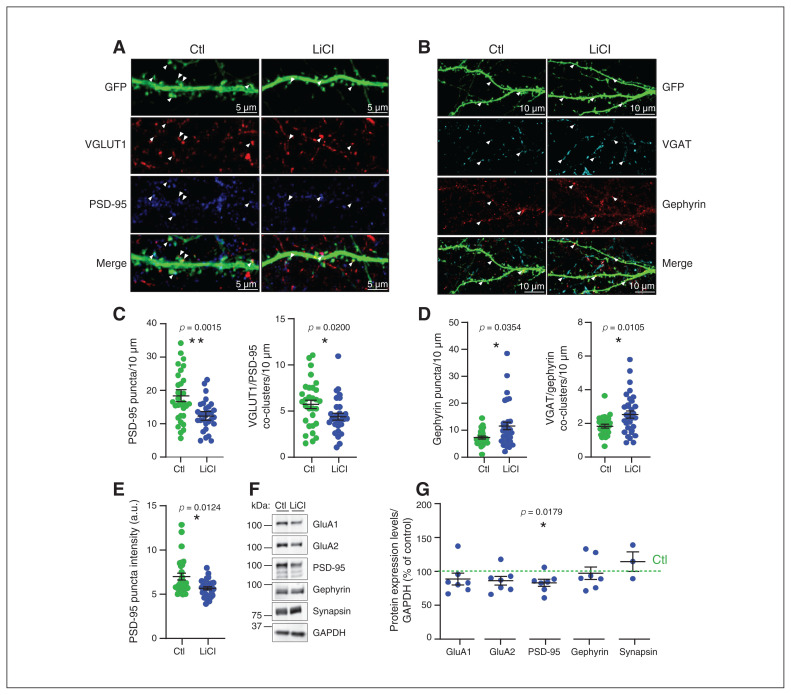
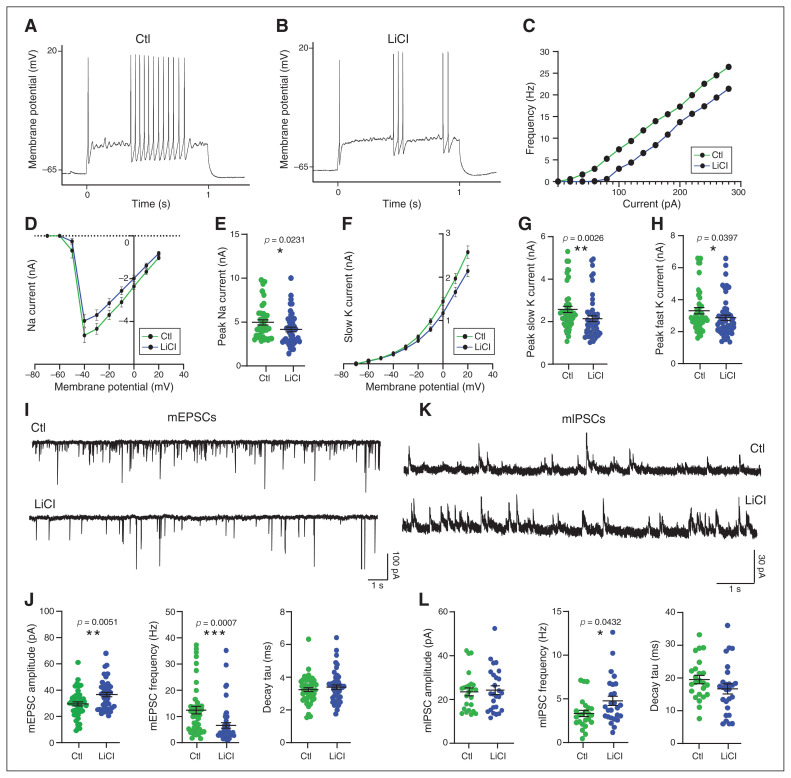
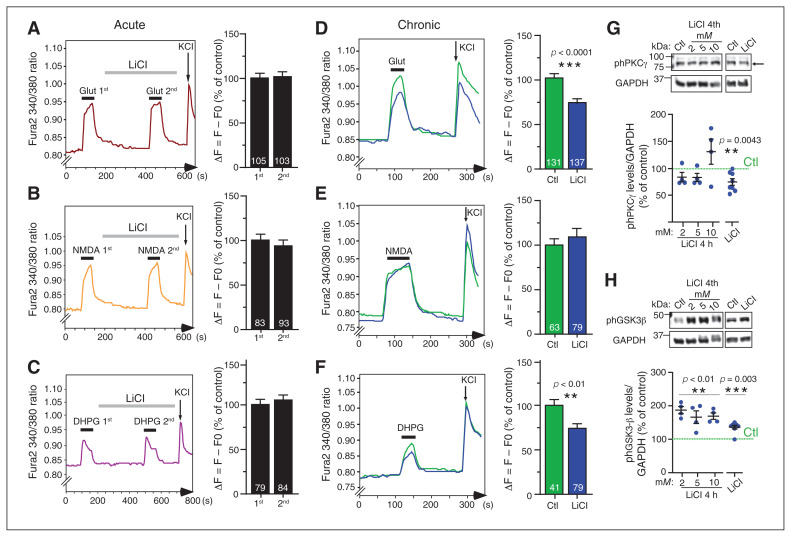
Results: We found that only chronic lithium treatment significantly reduced intracellular calcium flux, specifically by activating metabotropic glutamatergic receptor 5. This was associated with altered phosphorylation of protein kinase C and glycogen synthase kinase 3, reduced neuronal excitability and several alterations to synapse function. Consequently, lithium treatment shifts the excitatory–inhibitory balance toward inhibition.

Limitations: The mechanisms we identified should be validated in future by similar experiments in whole animals and human neurons.

Conclusion: Together, the results revealed how lithium dampens neuronal excitability and the activity of the glutamatergic network, both of which are predicted to be overactive in the manic phase of bipolar disorder. Our working model of lithium action enables the development of targeted strategies to restore the balance of overactive networks, mimicking the therapeutic benefits of lithium but with reduced toxicity.


Conflict of interest statement

None declared.

Figures

Fig. 1
Fig. 1
Chronic lithium treatment alters gene expression in mouse cortical neurons. (A) Clustering of differentially expressed genes at 18 days in vitro in primary cortical mouse neurons treated chronically with lithium (LiCl 1.5 mM) for 7 days compared to controls. Each gene cluster is identified by a colour. (B) Significant pathways of gene clusters identified through gene network analysis for the effect of chronic lithium treatment on primary cortical mouse neurons.
Fig. 2
Fig. 2
Chronic lithium treatment led to changes in spine morphology. (A) Representative confocal image of dendrites expressing free GFP. Bar 10 μm. (B) Enlargement of a dendrite expressing free GFP, treated with lithium (LiCl 1.5 mM) for 7 days or not treated (Ctl). Bar 10 μm. (C) Cell viability tests showed no toxic effect of lithium (1.5 mM) on neurons treated for 7 days, from 5 independent experiments. Scatter plots show (D) the density of protrusions and the relative proportion of (E) mushroom spines, (F) stubby spines and (G) thin spines in neurons treated with lithium for 7 days or not treated (Ctl). (H) Scatter plots show the spine head mushroom diameter from neurons treated with lithium or not treated (Ctl). Data shown in C to H are mean ± standard error of the mean. Statistical significance was determined using parametric unpaired t tests for C to G and nonparametric Mann–Whitney tests for H; n = ~5000 protrusions per condition from ~45 neurons from 4 independent experiments. **p = 0.0013; ***p < 0.0005. Ctl = control; GFP = green fluourescent protein; LiCl = lithium chloride.
Fig. 3
Fig. 3
Chronic lithium treatment induced excitatory and inhibitory synaptic changes. (A) Representative confocal image of dendrites expressing free GFP from neurons treated with lithium (LiCl 1.5 mM) for 7 days or not treated (Ctl), with antibodies directed against VGAT and gephyrin. Arrowheads show the VGAT and gephyrin puncta localization and the colocalization between VGAT and gephyrin in the merge, indicating the inhibitory synapses. Bar 10 μm. (B) Scatter plots show quantification of gephyrin puncta density/10 μm and VGAT/gephyrin co-cluster density representing the density of inhibitory synapses per 10 μm from secondary or tertiary dendrites from neurons that were treated with lithium (LiCl 1.5 mM) for 7 days or not treated (Ctl); n = 32 neurons per condition from 3 separate experiments. (C) Representative confocal image of dendrites expressing free GFP from neurons treated with lithium (LiCl 1.5 mM) for 7 days or not treated (Ctl), with antibodies directed against VGLUT1 and PSD-95. Arrowheads show the VGLUT1 and PSD-95 puncta localization and the colocalization between VGLUT1 and PSD-95 in the merge, indicating the excitatory synapses. Bar 5 μm. (D) Scatter plots show quantification of PSD-95 puncta density/10 μm and VGLUT1/PSD-95 co-cluster density representing the density of excitatory synapses per 10 μm from secondary and tertiary dendrites, as well as (E) PSD-95 puncta intensity from neurons treated with lithium (LiCl 1.5 mM) for 7 days or not treated (Ctl); n = 30 neurons per condition from 3 separate experiments. Data shown in B to E are mean ± standard error of the mean. Statistical significance was determined using a nonparametric Mann–Whitney test. (F) Representative immunoblots for GluA1, GluA2, PSD-95, gephyrin, synapsin1 and GAPDH of neuronal extract (18 days in vitro) from neurons treated with lithium (LiCl 1.5 mM) for 7 days or not treated (Ctl). (G) Quantification with scatter plot of some pre- and postsynaptic protein expression levels normalized with GAPDH (represented as percent of control) of neuronal extract (18 days in vitro) from neurons treated with lithium (LiCl 1.5 mM) for 7 days or not treated (Ctl) from 3 to 7 separate experiments. Data are mean ± standard error of the mean. Statistical significance was determined using a 1-sample t test with a hypothetical value of 100 for controls. Ctl = control; GAPDH = glyceraldehyde 3-phosphate dehydrogenase; GFP = green fluourescent protein; LiCl = lithium chloride; VGAT = vesicular γ-aminobutyric acid transporter; VGLUT1 = vesicular glutamate transporter 1.
Fig. 4
Fig. 4
Chronic lithium treatment reduced neuronal excitability and excitatory transmission, and it increased inhibitory synaptic transmission. Representative action potential trains in (A) control and (B) chronically treated (LiCl 1.5 mM) neurons at 18 days in vitro, in response to a 1 s depolarizing 120 pA current step from approximately −65 mV. (C) Frequency–current plot among repetitively firing neurons. Frequency represents the mean number of spikes per second from approximately 32 neurons per condition from 4 independent experiments. (D) Voltage dependence of the amplitude of the sodium current. (E) Quantification of the peak amplitude of sodium currents in neurons treated with lithium (LiCl 1.5 mM) for 7 days or not treated (Ctl). (F) Voltage dependence of the amplitude of the slow potassium current. (G and H) Quantification of the peak amplitude of the slow and fast potassium currents in neurons treated with lithium (LiCl 1.5 mM) for 7 days or not treated (Ctl). The data from D to H are from 5 separate experiments and are mean ± standard error of the mean. Statistical significance was determined by nonparametric Mann–Whitney tests. (I) Representative sample traces of mEPSCs from neurons treated with lithium (LiCl 1.5 mM) for 7 days or not treated (Ctl). Scale bar shown as inset. (J) Scatter plots show quantification of amplitude, frequency and decay tau for mEPSCs of approximately 45 neurons from 4 independent experiments. (K) Representative sample traces of mIPSCs from neurons treated or not with LiCl (1.5 mM) for 7 days. Scale bar shown as inset. (L) Scatter plots show quantification of amplitude, frequency and decay tau for mIPSCs of approximately 26 neurons from 3 independent experiments. Data from J and L are mean ± standard error of the mean. Statistical significance was determined by nonparametric Mann–Whitney tests. Ctl = control; LiCl = lithium chloride; mEPSC = miniature excitatory postsynaptic current; mIPSC = miniature inhibitory postsynaptic current.
Fig. 5
Fig. 5
Chronic lithium treatment reduced mGluR-mediated calcium response and signalling. (A to C) Representative sample traces of calcium responses after glutamate (1 μM), NMDA (10 μM) and DHPG (100 μM) stimulation; histograms show the quantification of calcium changes upon stimulation in mouse primary cortical neurons. The second stimulations were preceded by acute lithium (LiCl 1.5 mM) treatment for 5 min, followed by 2 s of KCl stimulation. (D to F) Representative sample traces of calcium responses after glutamate (1 μM), NMDA (10 μM) and DHPG (100 μM) stimulation; histograms show the quantification of calcium changes as percent of control upon drug stimulation in mouse primary cortical neurons chronically treated with lithium (LiCl 1.5 mM) for 7 days or not treated (Ctl). The number of neurons is indicated on each histogram from 3 independent experiments. Data shown in A to F are mean ± standard error of the mean. Statistical significance was determined by paired t tests for acute treatments (A to C) and unpaired t tests for chronic treatment (D to F). (G and H) Representative immunoblots and quantification of antiphosphorylated levels of PKCγ (threnonine 514) and GSK3β (serine 9) normalized with GAPDH and represented as percent of control from neuronal extracts from mouse primary cortical neurons treated acutely with 2, 5 and 10 mM of LiCl for 4 h, or chronically with lithium (LiCl 1.5 mM) for 7 days. The data are from 4 (4 h treatment) and 8 (chronic treatment) separate experiments and are mean ± standard error of the mean. Statistical significance was determined by 1-sample t tests with a hypothetical value of 100 for controls. Ctl = control; DHPG = 3,5-dihydroxyphenylglycine; GAPDH = glyceraldehyde 3-phosphate dehydrogenase; GSK3β = glycogen synthase kinase 3β; LiCl = lithium chloride; mGluR = metabotropic glutamatergic receptor; NMDA = N-methyl-d-aspartate; ph = phosphorylated; PKC = protein kinase C.

Similar articles

Cited by

References

    1. Angst J. The emerging epidemiology of hypomania and bipolar II disorder. J Affect Disord 1998;50:143–51. - PubMed
    1. Moreira ALR, Van Meter A, Genzlinger J, et al. . Review and meta-analysis of epidemiologic studies of adult bipolar disorder. J Clin Psychiatry 2017;78:e1259–69. - PubMed
    1. Vieta E, Berk M, Schulze TG, et al. . Bipolar disorders. Nat Rev Dis Primers 2018;4:18008. - PubMed
    1. Forstner AJ, Hofmann A, Maaser A, et al. . Genome-wide analysis implicates microRNAs and their target genes in the development of bipolar disorder. Transl Psychiatry 2015;5:e678. - PMC - PubMed
    1. Perlis RH, Smoller JW, Ferreira MA, et al. . A genomewide association study of response to lithium for prevention of recurrence in bipolar disorder. Am J Psychiatry 2009;166:718–25. - PMC - PubMed

MeSH terms

LinkOut - more resources