. 2021 Jun 24;10(7):694-706.
doi: 10.1530/EC-21-0043.

Oxytocin signal contributes to the adaptative growth of islets during gestation

Affiliations

Oxytocin signal contributes to the adaptative growth of islets during gestation

Ping Gu et al. Endocr Connect. .

Abstract

Background: Increased insulin production and secretion by pancreatic β-cells are important for ensuring the high insulin demand during gestation. However, the underlying mechanism of β-cell adaptation during gestation or gestational diabetes mellitus (GDM) remains unclear. Oxytocin is an important physiological hormone in gestation and delivery, and it also contributes to the maintenance of β-cell function. The aim of this study was to investigate the role of oxytocin in β-cell adaptation during pregnancy.

Methods: The relationship between the blood oxytocin level and pancreatic β-cell function in patients with GDM and healthy pregnant women was investigated. Gestating and non-gestating mice were used to evaluate the in vivo effect of oxytocin signal on β-cells during pregnancy. In vitro experiments were performed on INS-1 insulinoma cells.

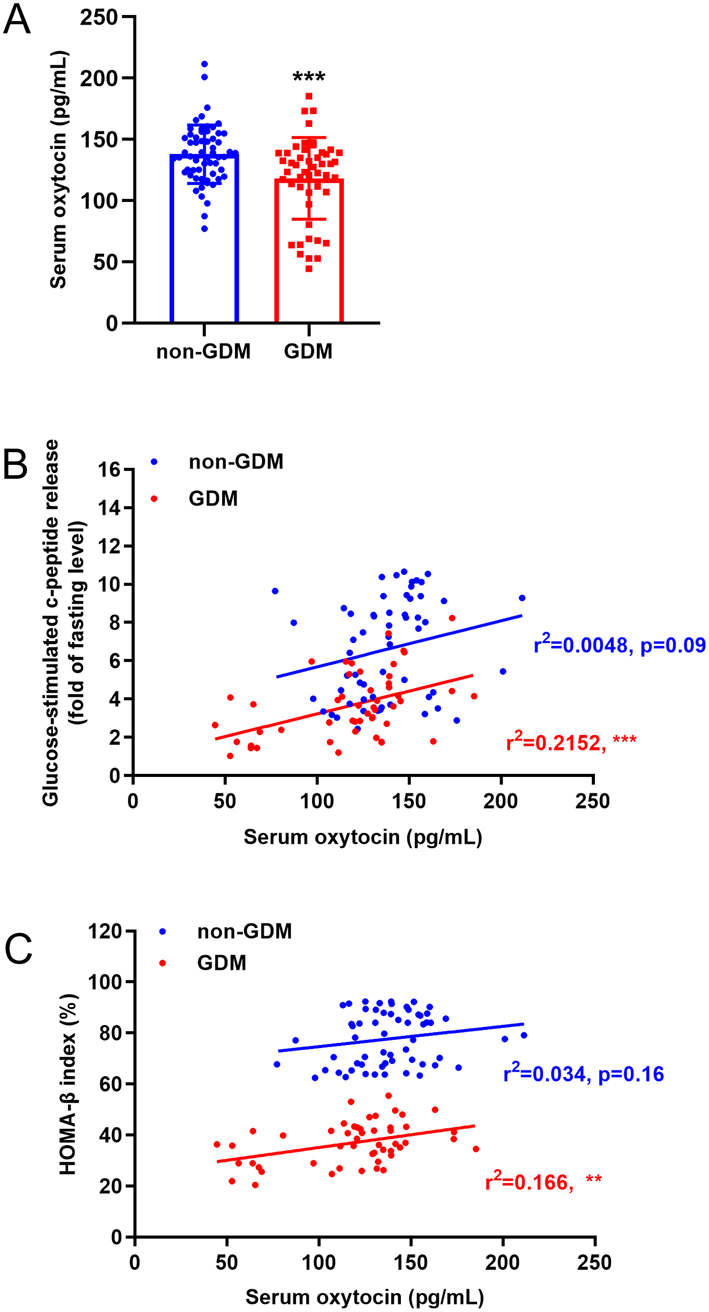
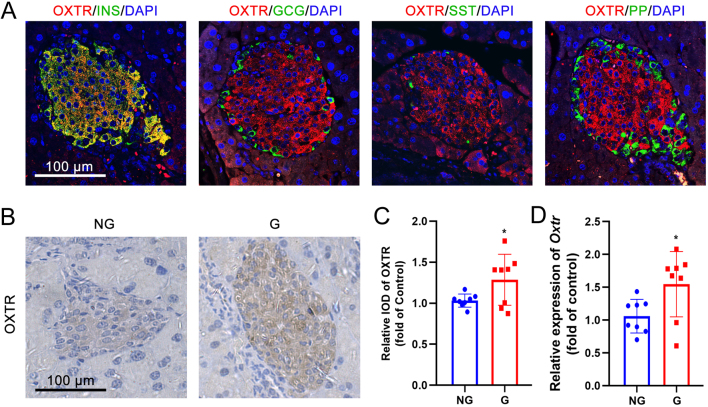
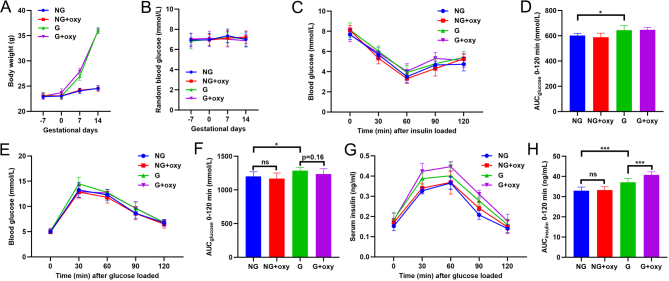
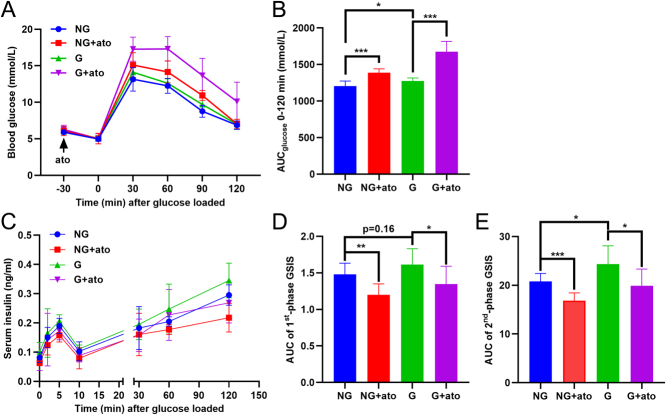
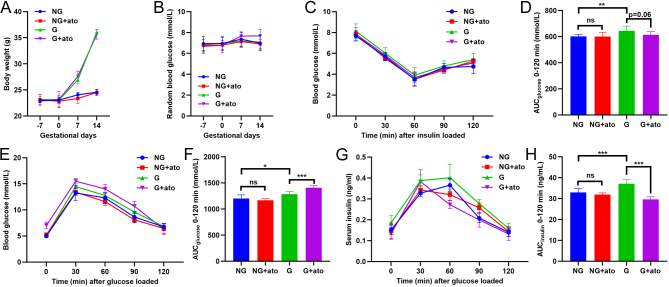
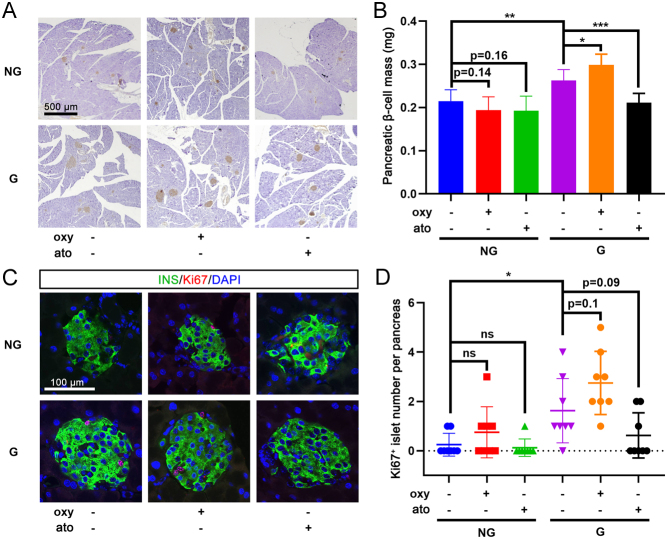
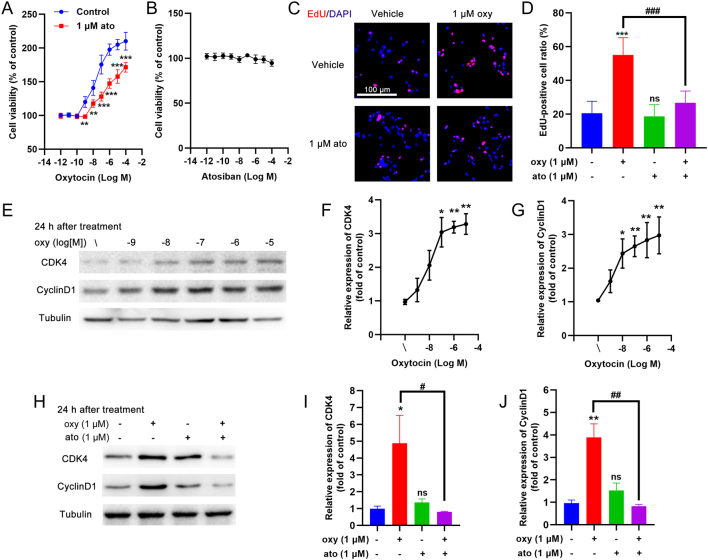
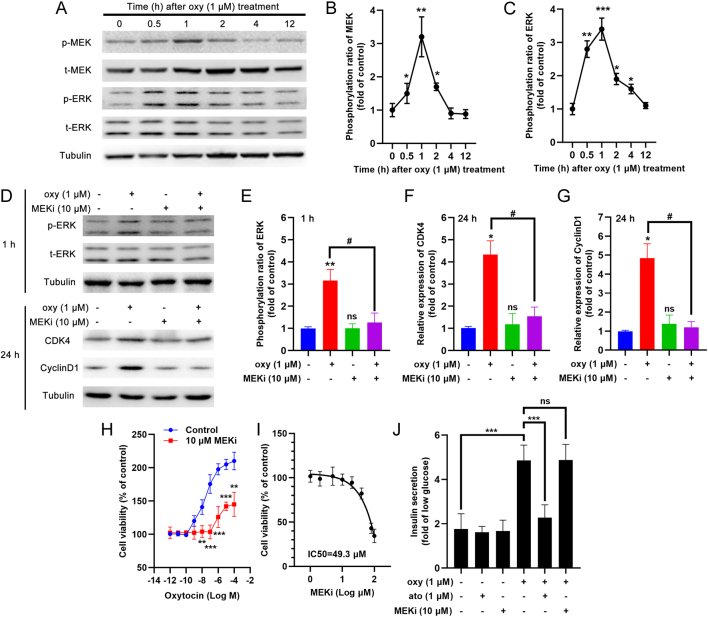
Results: The blood oxytocin levels were lower in patients with GDM than in healthy pregnant women and were associated with impaired pancreatic β-cell function. Acute administration of oxytocin increased insulin secretion in both gestating and non-gestating mice. A 3-week oxytocin treatment promoted the proliferation of pancreatic β-cells and increased the β-cell mass in gestating but not non-gestating mice. Antagonism of oxytocin receptors by atosiban impaired insulin secretion and induced GDM in gestating but not non-gestating mice. Oxytocin enhanced glucose-stimulated insulin secretion, activated the mitogen-activated protein kinase pathway, and promoted cell proliferation in INS-1 cells.

Conclusions: These findings provide strong evidence that oxytocin is needed for β-cell adaptation during pregnancy to maintain β-cell function, and the lack of oxytocin could be associated with the risk of GDM.

Keywords: gestational diabetes mellitus; insulin secretion; oxytocin; pancreatic β-cells; proliferation.


Figures

Figure 1
Figure 1
Decreased serum oxytocin levels are associated with β-cell dysfunction in patients with gestational diabetes mellitus (GDM). (A) Serum oxytocin level in patients with gestational diabetes mellitus (GDM, n = 50) and healthy pregnant women (non-GDM, n = 59), ***P < 0.001. (B) Correlation between glucose-stimulated c-peptide release and the serum oxytocin level in non-GDM and GDM women. ns, not significant; ***P < 0.001. (C) Correlation between HOMA-β index and the serum oxytocin level in non-GDM and GDM women. ns, not significant; **P < 0.01.
Figure 2
Figure 2
The expression of the oxytocin receptor is increased in the islets of gestating mice. (A) Double-immunofluorescent staining of oxytocin receptor (OXTR) and insulin (INS), glucagon (GCG), somatostatin (SST), and pancreatic polypeptide (PP) in pancreatic islets from non-gestating mice. DAPI was used to stain the nucleus. Scale bar = 100 μm. (B) Immunohistochemical staining of pancreatic islets from non-gestating (NG) mice and gestating (G) mice using OXTR antibody. Scale bar = 100 μm. (C) The relative integral optical density (IOD) of OXTR immunostaining between NG and G mice, *P < 0.05, n = 8. (D) The mRNA expression of Oxtr in isolated islets from NG and G mice, *P < 0.05, n = 8.
Figure 3
Figure 3
The effect of acute oxytocin treatment on gestating mice. (A) Non-gestating (NG) mice and gestating (G) mice at 2 weeks of gestation received vehicle or oxytocin 30 min before glucose loading for a glucose tolerance test (GTT). Blood glucose levels were recorded. (B) The area under curve (AUC) of THE GTT in (A). *P < 0.05, ***P < 0.001 as indicated, n = 8. (C) Serum insulin concentrations were measured at different times before and after glucose loading during the GTT in (A). (D) The AUC of the first (1st) phase (0 to 10 min) of insulin secretion in (C). *P < 0.05, **P < 0.01 as indicated, n = 8. (E) The AUC of the second (2nd) phase (10 to 120 min) of insulin secretion in (C). *P < 0.05, ***P < 0.001 as indicated, n = 8.
Figure 4
Figure 4
The effect of chronic oxytocin treatment on gestating mice. (A) Seven days before mating, vehicle and oxytocin were injected daily into NG and G mice for 3 weeks. Bodyweight was measured every week. (B) Seven days before mating, vehicle and oxytocin were injected daily in NG and G mice for 3 weeks. Random blood glucose was measured every week. (C) After a 3-week administration of vehicle or oxytocin, the insulin tolerance test (ITT) was performed in NG and G mice. (D) The AUC of ITT in (C). *P < 0.05 as indicated, n = 8. (E) After a 3-week administration of vehicle or oxytocin, the GTT was performed in NG and G mice. (F) The AUC of THE GTT in (E). ns, not significant; *P < 0.05 as indicated, n = 8. (G) During the GTT in (E), the serum insulin concentration was measured. (H) The AUC of insulin secretion in (G). ***P < 0.001 as indicated, n = 8.
Figure 5
Figure 5
The effect of acute atosiban treatment in gestating mice. (A) Non-gestating (NG) mice and gestating (G) mice at 2 weeks of gestation received vehicle or atosiban 30 min before glucose loading for the glucose tolerance test (GTT). Blood glucose levels were recorded. (B) The area under curve (AUC) of THE GTT in (A). *P < 0.05, ***P < 0.001 as indicated, n = 8. (C) Serum insulin concentrations were measured at different times before and after glucose loading during the GTT in (A). (D) The AUC of the first (1st) phase (0 to 10 min) of insulin secretion in (C). *P < 0.05, **P < 0.01 as indicated, n = 8. (E) The AUC of the second (2nd) phase (10 to 120 min) of insulin secretion in (C). *P < 0.05, ***P < 0.001 as indicated, n = 8.
Figure 6
Figure 6
The effect of chronic atosiban treatment in gestating mice. (A) Vehicle or atosiban was injected daily in NG and G mice for 3 weeks, beginning 7 days before mating. Bodyweight was measured every week. (B) Vehicle and atosiban were injected daily in NG and G mice for 3 weeks, beginning 7 days before mating. Random blood glucose levels were measured every week. (C) After the 3-week administration of vehicle or atosiban, the insulin tolerance test (ITT) was performed in the NG and G mice. (D) The AUC of ITT in (C). ns,not significant; **P < 0.01 as indicated, n = 8. (E) After the 3-week administration of vehicle or atosiban, the GTT was performed in the NG and G mice. (F) The AUC of the GTT in (E). *P < 0.05, ***P < 0.001 as indicated,n = 8. (G) During the GTT in (E), the serum insulin concentration was measured. (H) The AUC of insulin secretion in (G). ***P < 0.001 as indicated, n = 8.
Figure 7
Figure 7
Chronic oxytocin or atosiban treatment affects islet expansion and β-cell proliferation. (A) After a 3-week treatment with vehicle, oxytocin (oxy), or atosiban (ato) in non-gestating (NG) mice and gestating (G) mice, pancreatic tissue sections were immunohistochemically stained for insulin. Representative images are shown, scale bar = 500 μm. (B) The β-cell mass was analyzed in pancreatic tissue sections from each animal. *P < 0.05, **P < 0.01, ***P < 0.001 as indicated, n = 8. (C) Double immunofluorescence staining for insulin (INS) and Ki67 was performed in NG and G mice treated with chronic oxytocin or atosiban levels; DAPI was used to stain the nuclei. Representative images are shown, scale bar = 100 μm. (D) Islet with Ki67+/insulin+ cells was recorded as a Ki67-positive islet; the number of Ki67-positive islets in pancreatic tissue sections from each animal was counted. ns, not significant; *P < 0.05 as indicated, n = 8.
Figure 8
Figure 8
The effect of oxytocin on the proliferation of the INS-1 β-cell line. (A) INS-1 cells were treated for 24 h with different concentrations of oxytocin in the presence/absence of 1 μM atosiban and the cell viability was measured with the CCK8 assay. **P < 0.01, ***P < 0.001, n = 6. (B) INS-1 cells were treated for 24 h with different concentrations of atosiban and the cell viability was measured with the CCK8 assay. (C) INS-1 cells were treated for 24 h with 1 μM oxytocin in the presence/absence of 1 μM atosiban, then EdU assays were performed. Red stained nuclei indicate EdU-positive cells, all nuclei were stained with DAPI. Representative images are shown, scale bar = 100 μM. (D) Statistical analysis of (C). ns, not significant; ***P < 0.001 compared with control group; ###P < 0.001 as indicated, n = 10. (E) INS-1 cells were treated for 24 h with different concentrations of oxytocin and then cell lysates were subjected to Western blotting using CDK4 and cyclin D1 antibodies; tubulin was used as an internal reference. (F) The optical density (OD) of each band was measured; the ratio of CDK4/tubulin was calculated as the relative expression of CDK4, *P < 0.05, **P < 0.01 compared to the control group, n = 3. (G) The ratio of cyclin D1/tubulin was calculated as the relative expression of cyclin D1, *P < 0.05, **P < 0.01 compared to the control group, n = 3. (H) INS-1 cells were treated for 24 h with different concentrations of oxytocin in the presence/absence of 1 μM atosiban and then the cell lysates were subjected to Western blotting using CDK4 and cyclin D1 antibodies; tubulin was used as an internal reference. (I) The ratio of CDK4/tubulin was calculated as the relative expression of CDK4, *P < 0.05 compared to the control group, #P < 0.05 as indicated; ns, not significant, n = 3. (J) The ratio of cyclin D1/tubulin was calculated as the relative expression of cyclin D1, **P < 0.01 compared to the control group, ##P < 0.01 as indicated; ns, not significant, n = 3.
Figure 9
Figure 9
The effect of oxytocin on MAPK signal of the INS-1 β-cell line. (A) INS-1 cells were treated with 1 μM oxytocin for different times and the cell lysates were subjected to Western blotting using phosphorylated MEK (p-MEK), total MEK (t-MEK), phosphorylated ERK (p-ERK), and total ERK (t-ERK) antibodies; tubulin was used as an internal reference. (B) The optical density (OD) of each band was measured; the ratio of p-MEK/t-MEK was calculated and adjusted by the OD of tubulin, *P < 0.05, **P < 0.01 compared to the control group, n = 3. (C) The optical density (OD) of each band was measured; the ratio of p-ERK/t-ERK was calculated and adjusted by the OD of tubulin, *P < 0.05, **P < 0.01, ***P < 0.001 compared to the control group, n = 3. (D) INS-1 cells were treated for 1 h or 24 h with different concentrations of oxytocin in the presence/absence of 10 μM PD98059 (a MEK inhibitor, MEKi) and the cell lysates were subjected to Western blotting using p-ERK, t-ERK, CDK4, and cyclin D1 antibodies; tubulin was used as an internal reference. (E) The ratio of p-ERK/t-ERK was calculated and adjusted by the OD of tubulin; (F) The ratio of CDK4/tubulin was calculated as the relative expression of CDK4; (G) The ratio of cyclin D1/tubulin was calculated as the relative expression of cyclin D1, **P < 0.01, #P < 0.05 as indicated; ns, not significant; n = 3. (H) INS-1 cells were treated for 24 h with different concentrations of oxytocin in the presence/absence of 1 μM PD98059, and then the cell viability was measured with the CCK8 assay. **P < 0.01, ***P < 0.001, n = 6. (I) INS-1 cells were treated for 24 h with different concentrations of PD98059, and then the cell viability was measured with the CCK8 assay. IC50 = 49.3 μM. (J) INS-1 cells were pre-treated with different compounds for 15 min, then treated with low (2.8 mM) glucose (1 h) and high (16.8 mM) glucose (1 h) concentrations to trigger insulin secretion. The fold increase of insulin secretion in response to high glucose vs low glucose was calculated. ***P < 0.001, n = 5.

Similar articles

Cited by

References

    1. Lorenzo PI, Martin-Montalvo A, Cobo Vuilleumier N, Gauthier BR. Molecular modelling of islet beta-cell adaptation to inflammation in pregnancy and gestational diabetes mellitus. International Journal of Molecular Sciences 2019. 20 6171. (10.3390/ijms20246171) - DOI - PMC - PubMed
    1. Moon JH, Kim YG, Kim K, Osonoi S, Wang S, Saunders DC, Wang J, Yang K, Kim H, Lee J, et al. serotonin regulates adult beta-cell mass by stimulating perinatal beta-cell proliferation. Diabetes 2020. 69 205–214. (10.2337/db19-0546) - DOI - PMC - PubMed
    1. Hunt KJ, Schuller KL. The increasing prevalence of diabetes in pregnancy. Obstetrics and Gynecology Clinics of North America 2007. 34 173–99.(10.1016/j.ogc.2007.03.002) - DOI - PMC - PubMed
    1. Ernst S, Demirci C, Valle S, Velazquez-Garcia S, Garcia-Ocana A. Mechanisms in the adaptation of maternal beta-cells during pregnancy. Diabetes Management 2011. 1 239–248. (10.2217/dmt.10.24) - DOI - PMC - PubMed
    1. Viero C, Shibuya I, Kitamura N, Verkhratsky A, Fujihara H, Katoh A, Ueta Y, Zingg HH, Chvatal A, Sykova E, et al. Review: Oxytocin: crossing the bridge between basic science and pharmacotherapy. CNS Neuroscience and Therapeutics 2010. 16 e138–e156. (10.1111/j.1755-5949.2010.00185.x) - DOI - PMC - PubMed

LinkOut - more resources