. 2021 Jun 2;19(6):e3001281.
doi: 10.1371/journal.pbio.3001281. eCollection 2021 Jun.

The nonreceptor tyrosine kinase SRMS inhibits autophagy and promotes tumor growth by phosphorylating the scaffolding protein FKBP51

Affiliations

The nonreceptor tyrosine kinase SRMS inhibits autophagy and promotes tumor growth by phosphorylating the scaffolding protein FKBP51

Jung Mi Park et al. PLoS Biol. .

Abstract

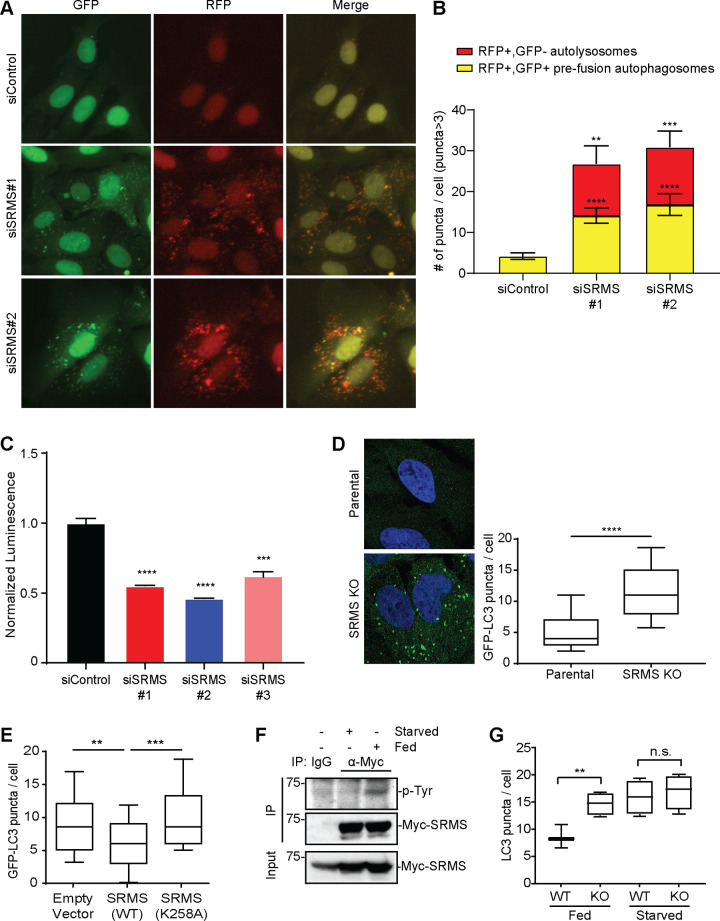
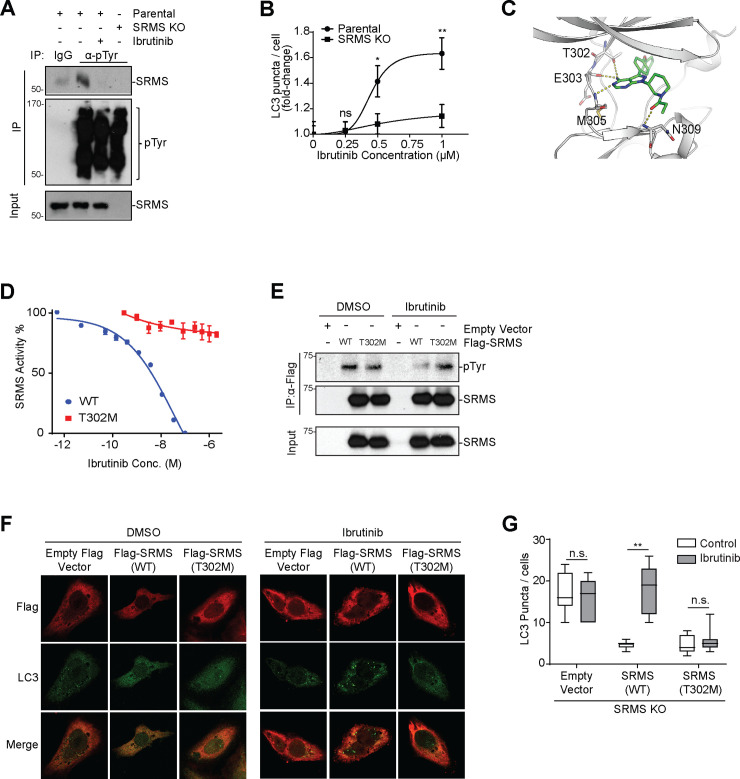
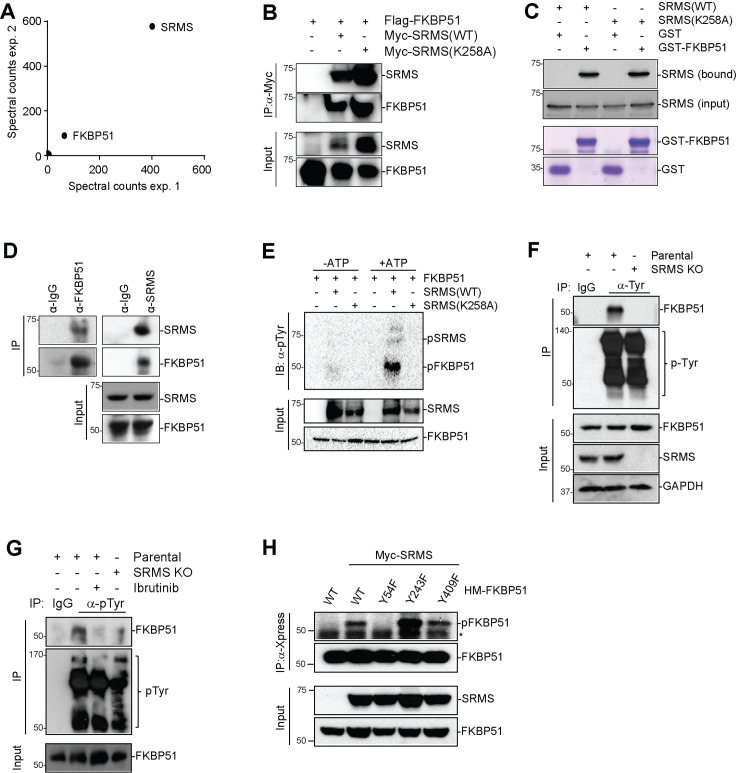
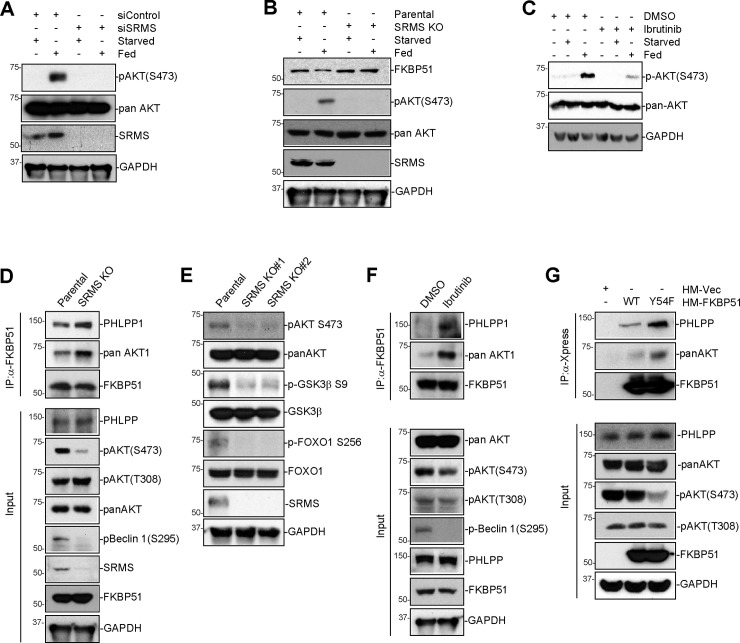
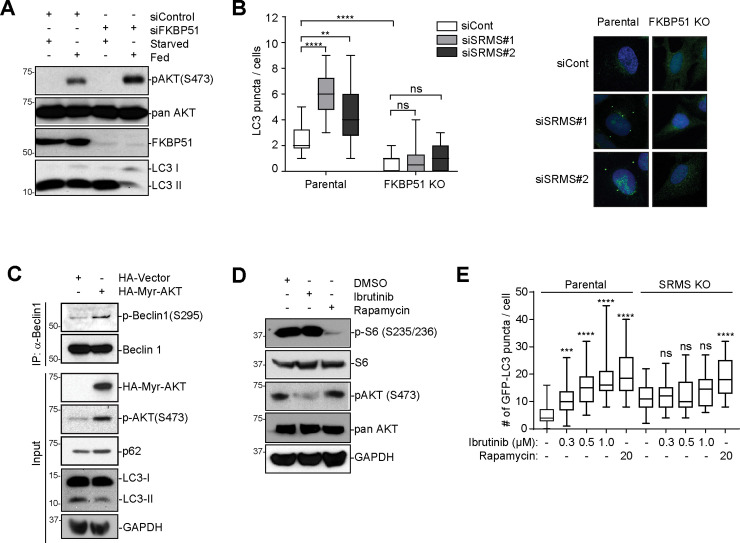
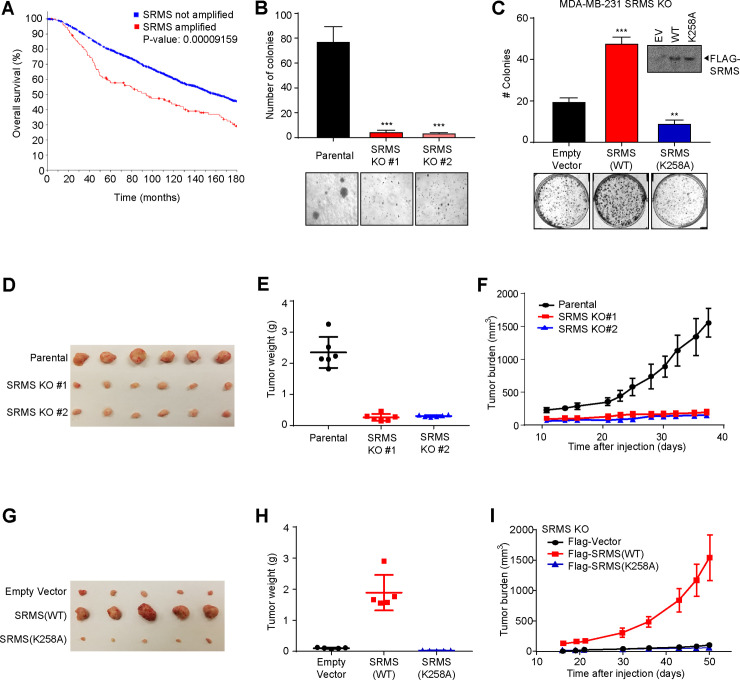
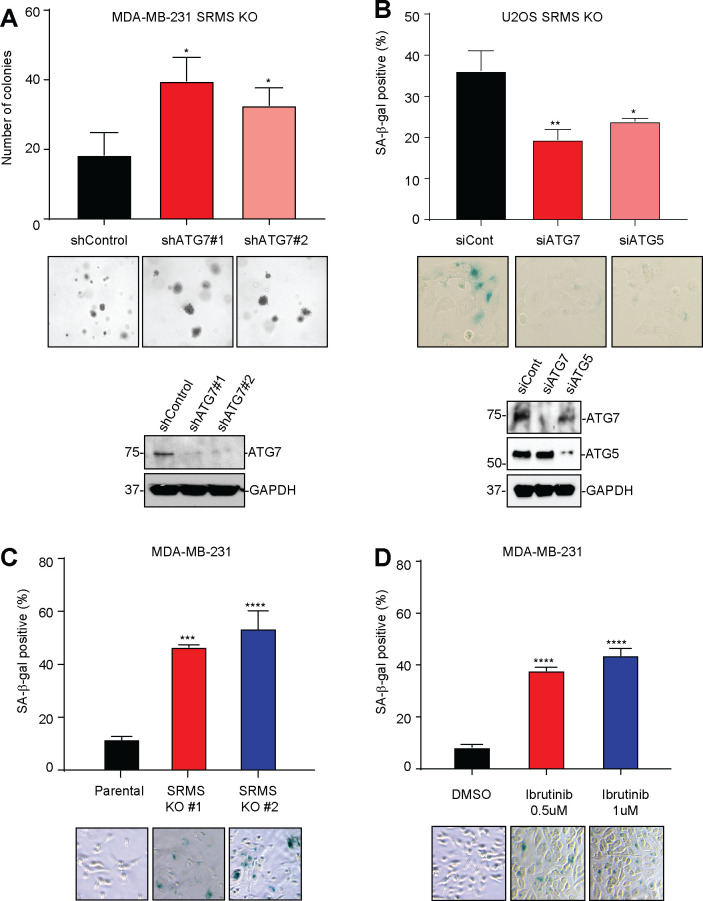
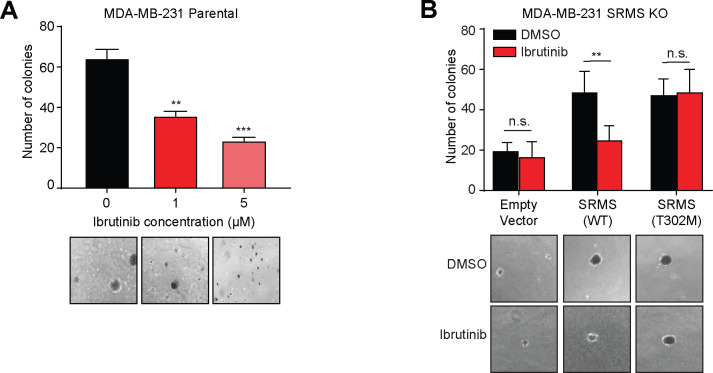
Nutrient-responsive protein kinases control the balance between anabolic growth and catabolic processes such as autophagy. Aberrant regulation of these kinases is a major cause of human disease. We report here that the vertebrate nonreceptor tyrosine kinase Src-related kinase lacking C-terminal regulatory tyrosine and N-terminal myristylation sites (SRMS) inhibits autophagy and promotes growth in a nutrient-responsive manner. Under nutrient-replete conditions, SRMS phosphorylates the PHLPP scaffold FK506-binding protein 51 (FKBP51), disrupts the FKBP51-PHLPP complex, and promotes FKBP51 degradation through the ubiquitin-proteasome pathway. This prevents PHLPP-mediated dephosphorylation of AKT, causing sustained AKT activation that promotes growth and inhibits autophagy. SRMS is amplified and overexpressed in human cancers where it drives unrestrained AKT signaling in a kinase-dependent manner. SRMS kinase inhibition activates autophagy, inhibits cancer growth, and can be accomplished using the FDA-approved tyrosine kinase inhibitor ibrutinib. This illuminates SRMS as a targetable vulnerability in human cancers and as a new target for pharmacological induction of autophagy in vertebrates.


Conflict of interest statement

I have read he journal’s policy and the authors of this manuscript have the following competing interests: J.M.P., S.W.Y., and M.B.P. are employees and shareholders of Amgen. Author Sergei von Hoyningen-Huene was unavailable to confirm their authorship contributions. On their behalf, the corresponding author has reported their contributions to the best of their knowledge.

Figures

Fig 1
Fig 1. SRMS restrains autophagy under nutrient-replete condition.
(A, B) Autophagosome–lysosome fusion was assessed in U2OS cells stably expressing tandem monomeric RFP-GFP-LC3. Seventy-two hours after transfection with the indicated siRNA oligonucleotides cells were imaged by IncuCyte to identify prefusion autophagic compartments (i.e., RFP+, GFP+ puncta) and postfusion autolysosomes (i.e., RFP+, GFP− puncta). Representative images are shown in (A) and quantitation from cells having more than 3 puncta is shown in (B). Mean + SEM from n = 18 cells per condition is shown. **p < 0.01, ***p < 0.001, ****p < 0.0001, t test. (C) Autophagic flux was assessed using the Autophagy LC3 HiBiT Reporter Assay System 72 hours after transfection with the indicated siRNA oligonucleotides. Degradation of the autophagy substrate HiBiT-LC3 was detected as reduced luminescence indicative of increased autophagic flux in SRMS-depleted cells compared to controls. Mean + SEM of n = 3 triplicates is shown. ***p < 0.001, ****p < 0.0001, t test. (D) Baseline numbers of GFP-LC3-positive puncta per cell were compared in parental vs. SRMS KO U2OS GFP-LC3 cells. From left to right n = 24 cells and n = 23 cells. Representative images are shown. ****p < 0.0001, t test. (E) SRMS inhibits LC3 puncta formation in a kinase-dependent manner. Myc-SRMS(WT) and Myc-SRMS(K258A) were transiently expressed in U2OS cells stably expressing GFP-LC3. Cells were fixed and stained with anti-Myc antibody to detect transfected cells. The number of GFP-LC3 puncta per cell from n = 50 transfected cells per condition is shown. **p < 0.01, ***p < 0.001, t test. (F) Autophosphorylation of Myc-SRMS was compared between starved (EBSS, 4 hours) and fed (fresh complete growth media, 4 hours) conditions via anti-Myc IP followed by anti-p-Tyr immunoblot. Results shown are representative of 3 independent experiments. (G) The number of LC3-positive puncta per cell was compared between SRMS KO vs. WT U2OS cells under starved and fed conditions. From left to right, n = 45, n = 38, n = 40, and n = 36 cells were analyzed. ns p > 0.05, **p < 0.01, t test. The data underlying the figure can be found in S1 Data. EBSS, Earle’s balanced salt solution; GFP, green fluorescent protein; IP, immunoprecipitation; KO, knockout; n.s., non-significant (p>0.05); RFP, red fluorescent protein; siRNA, small interfering RNA; SRMS, Src-related kinase lacking C-terminal regulatory tyrosine and N-terminal myristylation sites; WT, wild-type.
Fig 2
Fig 2. Ibrutinib activates autophagy by direct inhibition of SRMS.
(A) Ibrutinib inhibits SRMS kinase activity as measured by autophosphorylation. Parental or SRMS KO MDA-MB-231 cells were treated with vehicle or 0.5 μM ibrutinib for 4 hours. Lysates were immunoprecipitated with anti-pTyr antibody and blotted with indicated antibodies. Results shown are representative of 3 independent experiments. (B) Ibrutinib induces punctate formation of endogenous LC3 in an SRMS-dependent manner. Parental U2OS cells or SRMS KO U2OS cells were treated with the indicated concentration of ibrutinib for 16 hours. Cells were fixed, stained with anti-LC3 antibody, and imaged. For parental cells, from left to right n = 38, n = 47, n = 49, and n = 40 cells were analyzed. For SRMS KO cells, from left to right n = 44, n = 45, n = 58, and n = 54 cells were analyzed. The numbers of LC3 puncta per cell were counted and displayed as fold-change vs. the mean value for DMSO-treated cells. Mean +/− SEM is shown. ns p > 0.05, *p < 0.05, **p < 0.01, t test. (C) The SRMS kinase domain (gray) was modeled and unbiased docking of ibrutinib (green) was performed in silico. (D) Mobility shift assay was used to measure the enzymatic activity of recombinant purified kinase domains of WT and T302M SRMS in the presence of the indicated concentrations of ibrutinib. (E) Ibrutinib inhibits autophosphorylation of WT SRMS but not SRMS(T302M) in cells. Flag-SRMS(WT) or Flag-SRMS(T302M) was expressed in SRMS KO U2OS cells. Cells were treated with DMSO or 0.5 μM ibrutinib for 4 hours. Lysates were immunoprecipitated with anti-Flag antibody and immunoblotted with indicated antibodies. Results shown are representative of 3 independent experiments. (F, G) SRMS kinase activity restrains autophagosome biogenesis. SRMS KO U2OS cells expressing empty vector, SRMS(WT), or SRMS(T302M) were treated with 0.5 μM ibrutinib or DMSO (Control) for 4 hours. Cells were stained with anti-LC3 and anti-Flag antibodies followed by confocal microscopy. Representative images are shown in (F). The number of LC3-positive puncta per cell from n = 25, n = 25, n = 20, n = 32, n = 17, and n = 20 transfected cells (left to right) are shown in (G). ns p > 0.05, **p < 0.01, t test. The data underlying the figure can be found in S1 Data. IgG, immunoglobulin G; IP, immunoprecipitation; KO, knockout; n.s., non-significant (p>0.05); SRMS, Src-related kinase lacking C-terminal regulatory tyrosine and N-terminal myristylation sites; WT, wild-type.
Fig 3
Fig 3. SRMS binds FKBP51 and phosphorylates tyrosine 54.
(A) Substrate-trapping IP and proteomics were performed to identify candidate SRMS substrates. (B) WT and kinase-dead SRMS interact with FKBP51 in cells. Flag-FKBP51 was transfected with Myc-SRMS or Myc-SRMS K258A in HeLa cells. Cell lysates were subjected to IP by anti-Myc antibody and blotted with indicated proteins. Results shown are representative of 3 independent experiments. (C) SRMS directly interacts with FKBP51 in vitro. GST pull-down assay was performed with recombinant GST-FKBP51 and in vitro transcribed/translated Myc-SRMS (WT or kinase-dead, as indicated). (D) SRMS endogenously interacts with FKBP51. MDA-MB-231 cell lysates were subjected to IP with anti-SRMS or anti-FKBP51 and blotted with indicated antibodies. Results shown are representative of 3 independent experiments. (E) In vitro kinase assays were performed using purified recombinant GST-FKBP51 and in vitro transcribed/translated Myc-SRMS(WT) or Myc-SRMS(K258A) proteins in the presence or absence of ATP. Tyrosine phosphorylation of FKBP51 was probed via anti-pTyr antibody and GST-FKBP51 proteins were detected via anti-GST antibody. (F) Tyrosine phosphorylation of endogenous FKBP51 and global tyrosine phosphorylation were compared between parental and SRMS KO MDA-MB 231 cells. Results shown are representative of 3 independent experiments. (G) Ibrutinib inhibits SRMS kinase activity as measured by phosphorylation of FKBP51. Parental or SRMS KO MDA-MB-231 cells were treated with vehicle or 0.5 μM ibrutinib for 4 hours. Lysates were immunoprecipitated with anti-pTyr antibody and blotted with indicated antibodies. Results shown are representative of 3 independent experiments. (H) Myc-SRMS was transfected with each of HisMax-FKBP51 WT, Y54F, Y243F, and Y409F in U2OS cells. Cells were lysed, subjected to IP by anti-Xpress, and blotted with indicated antibodies. *nonspecific band. Results shown are representative of 3 independent experiments. The data underlying the figure can be found in S1 Data. FKBP51, FK506-binding protein 51; GAPDH, glyceraldehyde-3-phosphate dehydrogenase; GST, glutathione S-transferase; IB, immunoblot; IgG, immunoglobulin G; IP, immunoprecipitation; KO, knockout; SRMS, Src-related kinase lacking C-terminal regulatory tyrosine and N-terminal myristylation sites; WT, wild-type.
Fig 4
Fig 4. SRMS disrupts the FKBP51-PHLPP-AKT complex to sustain AKT activation.
(A) SRMS is required for the accumulation of pAKT(S473) under fed conditions. Control or SRMS siRNA was transfected in MDA-MB-231 cells and incubated with starvation or fed condition for 4 hours. Lysates were collected and immunoblotted with the indicated antibodies. (B) Nutrient stimulation causes an SRMS-dependent reduction in FKBP51 abundance. Parental or SRMS KO MDA-MB-231 cells were incubated under starved or fed conditions for 4 hours. Lysates were immunoblotted with the indicated antibodies. (C) Ibrutinib suppresses the nutrient-dependent accumulation of pAKT(S473). MDA-MB-231 cells were treated with 0.5 μM ibrutinib for 4 hours under starvation or fed condition. Lysates were collected and immunoblotted with the indicated antibodies. (D) FKBP51 scaffolding activity was compared between parental and SRMS KO MDA-MB-231 cells. Cells were lysed, subjected to IP by anti-FKBP51, and blotted with indicated antibodies. Results shown are representative of 3 independent experiments. (E) AKT signaling pathway activity was compared between parental and SRMS KO MDA-MB-231 cells. Cell lysates were collected and immunoblotted with the indicated antibodies. (F) FKBP51 scaffolding activity was compared between MDA-MB-231 cells treated with DMSO vs. 0.5 μM ibrutinib for 4 hours. Cells were lysed, subjected to IP by anti-FKBP51, and blotted with indicated antibodies. Results shown are representative of 3 independent experiments. (G) Scaffolding activity of FKBP51(Y54F) vs. WT FKBP51 was compared after transfection in 293FT cells. Cells were lysed, subjected to IP by anti-Xpress, and blotted with indicated antibodies. Results shown are representative of 3 independent experiments. GAPDH, glyceraldehyde-3-phosphate dehydrogenase; IP, immunoprecipitation; KO, knockout; siRNA, small interfering RNA; SRMS, Src-related kinase lacking C-terminal regulatory tyrosine and N-terminal myristylation sites; FKBP51, FK506-binding protein 51; WT, wild-type.
Fig 5
Fig 5. SRMS inhibits autophagy in an FKBP51-dependent manner.
(A) Depletion of FKBP51 increases p-AKT(S473) and inhibits autophagy in fed conditions. Control siRNA or siRNA targeting FKBP51 was transfected in MDA-MB-231 cells. Seventy-two hours later, cells were fed or starved as indicated for 4 hours. Cell lysates were collected and immunoblotted with indicated antibodies. (B) FKBP51 is required for SRMS-mediated regulation of autophagy. SRMS siRNAs were transiently transfected in parental vs. FKBP51 KO U2OS cells. Cells were fixed and stained with anti-LC3 antibody to detect endogenous LC3 puncta. Representative images are shown. The number of puncta per cell from n = 18 cells per condition is shown. ns p > 0.05, **p < 0.01, ****p < 0.0001, t test. (C) Constitutively active AKT rescues phosphorylation of Beclin1(Ser295) and inhibits autophagy in SRMS KO cells. Myr-AKT was stably expressed in SRMS KO MDA-MB 231 cells. Beclin 1 IP was performed, and lysates were analyzed by western blot using the indicated antibodies. Results shown are representative of 3 independent experiments. (D) Ibrutinib does not inhibit mTORC1. MDA-MB-231 cells were treated with 0.5 μM ibrutinib or 10 nM rapamycin for 4 hours. Lysates were analyzed by western blot with the indicated antibodies. (E) Ibrutinib activates autophagosome formation in an SRMS-dependent manner, while rapamycin activates autophagosome formation in an SRMS-independent manner. Parental or SRMS KO U2OS GFP-LC3 cells were treated with vehicle or the indicated concentrations of ibrutinib or rapamycin for 16 hours. Cells were fixed and imaged by confocal microscopy. From left to right, n = 24, n = 33, n = 29, n = 31, n = 26, n = 23, n = 31, n = 31, n = 28, and n = 31 cells were analyzed. ns p > 0.05, ***p < 0.001, ****p < 0.0001, t test. The data underlying the figure can be found in S1 Data. FKBP51, FK506-binding protein 51; GAPDH, glyceraldehyde-3-phosphate dehydrogenase; IP, immunoprecipitation; KO, knockout; siRNA, small interfering RNA; SRMS, Src-related kinase lacking C-terminal regulatory tyrosine and N-terminal myristylation sites.
Fig 6
Fig 6. SRMS promotes tumor growth in a kinase-dependent manner.
(A) SRMS amplification correlates with poor overall survival in breast cancer patients. The METABRIC cohort of 2,173 breast cancer patients were split into SRMS-nonamplified (blue) and SRMS-amplified (red) groups. Overall, survival of each group was plotted. (B) SRMS is required for anchorage-independent growth of MDA-MB-231 triple-negative breast cancer cells. Parental or SRMS KO MDA-MB-231 cells were seeded sparsely in soft agar and allowed to grow for 23 days. Mean + standard deviation for n = 3 replicates are shown along with representative images. ***p < 0.001. (C) SRMS kinase activity supports clonogenic growth of MDA-MB-231 cells. SRMS KO MDA-MB-231 cells were transfected with empty vector, SRMS WT, or SRMS K258A kinase-dead mutant and plated sparsely. After 20 days of clonogenic growth, colonies were stained with crystal violet, imaged, and counted. Mean + standard deviation of n = 3 replicates is shown along with representative images. **p < 0.01, ***p < 0.001, t test. (Relates to S6D Fig). (D–F) Xenograft tumor growth was compared between parental vs. SRMS KO MDA-MB-231 cells injected subcutaneously into Nod-Scid gamma mice. Relative tumor burden (D) and tumor weights (E) corresponding with the endpoint of the growth curve (F) are shown. Mean +/− standard deviation of n = 6 mice per condition. (G–I) SRMS KO MDA-MB-231 cells were reconstituted with the indicated constructs and injected subcutaneously into Nod-Scid gamma mice. Relative tumor burden (G) and tumor weights (H) corresponding with the endpoint of the growth curve (I) are shown. Mean +/− standard deviation of n = 5 mice per condition. The data underlying the figure can be found in S1 Data. EV, empty vector; KO, knockout; SRMS, Src-related kinase lacking C-terminal regulatory tyrosine and N-terminal myristylation sites; WT. wild-type.
Fig 7
Fig 7. Autophagy inhibition by SRMS prevents widespread cancer cell senescence.
(A) Soft agar colony formation assay was performed in SRMS KO MDA-MB-231 cells after introduction of the indicated shRNA constructs. Mean + SEM of n = 3 replicates are shown (top) along with representative images (middle) and western blot evaluating knockdown efficiency (bottom). (B) SRMS KO U2OS cells were transfected with the indicated siRNA oligonucleotides. Seventy-two hours later, senescence-associated beta-galactosidase staining was performed in one set, while lysates were collected from a parallel set of cells. Mean + SEM of n = 3 replicates are shown (top) along with representative images (middle) and western blot analysis of knockdown efficiency (bottom). (C) Senescence-associated beta-galatosidase staining was performed in parental MDA-MB-231 cells and 2 SRMS KO MDA-MB-231 clones. Mean + SEM of n = 3 replicates are shown along with representative images. (D) Senescence-associated beta-galactosidase staining was performed in parental MDA-MB-231 cells treated with DMSO or the indicated concentration of ibrutinib. Mean + SEM of n = 3 experiments are shown along with representative images. The data underlying the figure can be found in S1 Data. GAPDH, glyceraldehyde-3-phosphate dehydrogenase; KO, knockout; shRNA, short hairpin RNA; siRNA, small interfering RNA; SRMS, Src-related kinase lacking C-terminal regulatory tyrosine and N-terminal myristylation sites.
Fig 8
Fig 8. Ibrutinib inhibits cancer cell growth through direct inhibition of SRMS.
(A) Ibrutinib suppresses anchorage-independent growth. MDA-MB-231 cells were sparsely seeded in soft agar and treated with DMSO or the indicated concentration of ibrutinib for 23 days. Mean + standard deviation of n = 3 replicates is shown along with representative images. **p < 0.01, ***p < 0.001. (B) SRMS kinase activity promotes anchorage-independent growth. The indicated constructs were expressed in SRMS KO MDA-MB-231 cells. The cells were sparsely seeded in soft agar and treated for 20 days with DMSO or 0.5 μM ibrutinib. Mean + standard deviation of n = 3 replicates is shown along with representative images. ns p > 0.05, **p < 0.01. The data underlying the figure can be found in S1 Data. KO, knockout; n.s., non-significant (p>0.05); SRMS, Src-related kinase lacking C-terminal regulatory tyrosine and N-terminal myristylation sites; WT, wild-type.

Similar articles

Cited by

References

    1. Inoki K, Kim J, Guan KL. AMPK and mTOR in cellular energy homeostasis and drug targets. Annu Rev Pharmacol Toxicol. 2012;52:381–400. doi: 10.1146/annurev-pharmtox-010611-134537 - DOI - PubMed
    1. Kim J, Kundu M, Viollet B, Guan KL. AMPK and mTOR regulate autophagy through direct phosphorylation of Ulk1. Nat Cell Biol. 2011;13:132–41. doi: 10.1038/ncb2152 - DOI - PMC - PubMed
    1. Kohmura N, Yagi T, Tomooka Y, Oyanagi M, Kominami R, Takeda N, et al.. A novel nonreceptor tyrosine kinase, Srm: cloning and targeted disruption. Mol Cell Biol. 1994;14:6915–25. doi: 10.1128/mcb.14.10.6915-6925.1994 - DOI - PMC - PubMed
    1. Casaletto JB, McClatchey AI. Spatial regulation of receptor tyrosine kinases in development and cancer. Nat Rev Cancer. 2012;12:387–400. doi: 10.1038/nrc3277 - DOI - PMC - PubMed
    1. Goel RK, Lukong KE. Tracing the footprints of the breast cancer oncogene BRK—Past till present. Biochim Biophys Acta. 2015;1856:39–54. doi: 10.1016/j.bbcan.2015.05.001 - DOI - PubMed

Publication types

MeSH terms