

coupleCoC+: An information-theoretic co-clustering-based transfer learning framework for the integrative analysis of single-cell genomic data
- PMID: 34077420
- PMCID: PMC8202939
- DOI: 10.1371/journal.pcbi.1009064
coupleCoC+: An information-theoretic co-clustering-based transfer learning framework for the integrative analysis of single-cell genomic data
Abstract
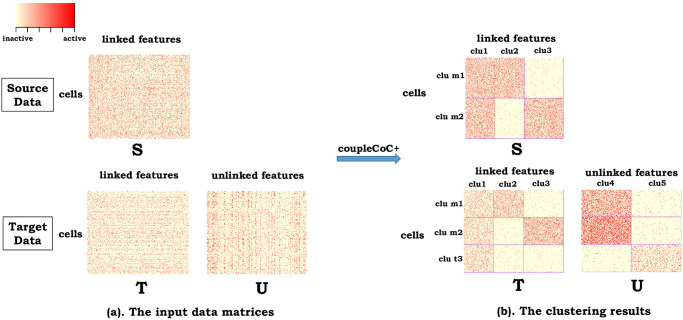
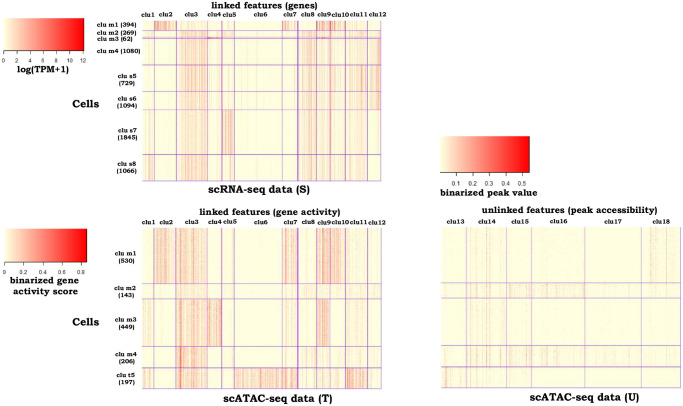
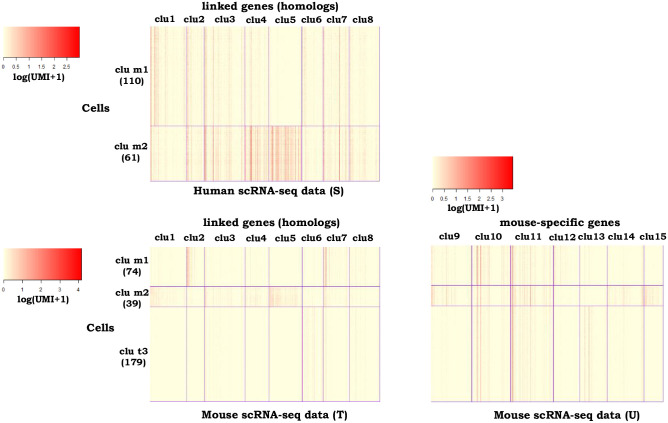
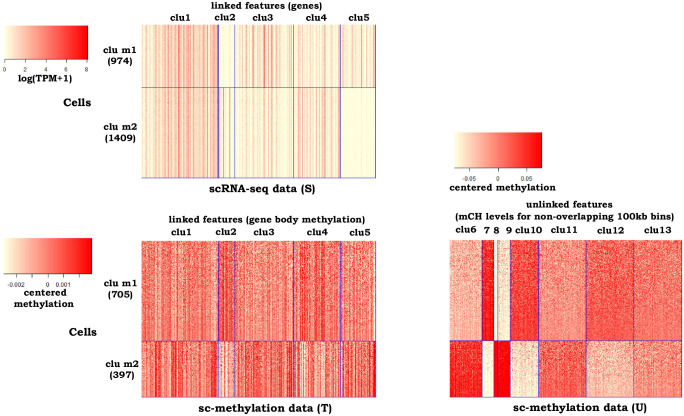
Technological advances have enabled us to profile multiple molecular layers at unprecedented single-cell resolution and the available datasets from multiple samples or domains are growing. These datasets, including scRNA-seq data, scATAC-seq data and sc-methylation data, usually have different powers in identifying the unknown cell types through clustering. So, methods that integrate multiple datasets can potentially lead to a better clustering performance. Here we propose coupleCoC+ for the integrative analysis of single-cell genomic data. coupleCoC+ is a transfer learning method based on the information-theoretic co-clustering framework. In coupleCoC+, we utilize the information in one dataset, the source data, to facilitate the analysis of another dataset, the target data. coupleCoC+ uses the linked features in the two datasets for effective knowledge transfer, and it also uses the information of the features in the target data that are unlinked with the source data. In addition, coupleCoC+ matches similar cell types across the source data and the target data. By applying coupleCoC+ to the integrative clustering of mouse cortex scATAC-seq data and scRNA-seq data, mouse and human scRNA-seq data, mouse cortex sc-methylation and scRNA-seq data, and human blood dendritic cells scRNA-seq data from two batches, we demonstrate that coupleCoC+ improves the overall clustering performance and matches the cell subpopulations across multimodal single-cell genomic datasets. coupleCoC+ has fast convergence and it is computationally efficient. The software is available at https://github.com/cuhklinlab/coupleCoC_plus.
Conflict of interest statement
The authors have declared that no competing interests exist.
Figures
Similar articles
-
Coupled co-clustering-based unsupervised transfer learning for the integrative analysis of single-cell genomic data.Brief Bioinform. 2021 Jul 20;22(4):bbaa347. doi: 10.1093/bib/bbaa347. Brief Bioinform. 2021. PMID: 33279962
-
Graph contrastive learning as a versatile foundation for advanced scRNA-seq data analysis.Brief Bioinform. 2024 Sep 23;25(6):bbae558. doi: 10.1093/bib/bbae558. Brief Bioinform. 2024. PMID: 39487083 Free PMC article.
-
scMUSCL: multi-source transfer learning for clustering scRNA-seq data.Bioinformatics. 2025 May 6;41(5):btaf137. doi: 10.1093/bioinformatics/btaf137. Bioinformatics. 2025. PMID: 40152244 Free PMC article.
-
Machine learning and statistical methods for clustering single-cell RNA-sequencing data.Brief Bioinform. 2020 Jul 15;21(4):1209-1223. doi: 10.1093/bib/bbz063. Brief Bioinform. 2020. PMID: 31243426 Review.
-
Identifying cell types to interpret scRNA-seq data: how, why and more possibilities.Brief Funct Genomics. 2020 Jul 29;19(4):286-291. doi: 10.1093/bfgp/elaa003. Brief Funct Genomics. 2020. PMID: 32232401 Review.
Cited by
-
scMLC: an accurate and robust multiplex community detection method for single-cell multi-omics data.Brief Bioinform. 2024 Jan 22;25(2):bbae101. doi: 10.1093/bib/bbae101. Brief Bioinform. 2024. PMID: 38493339 Free PMC article.
-
Computational Methods for Single-cell DNA Methylome Analysis.Genomics Proteomics Bioinformatics. 2023 Feb;21(1):48-66. doi: 10.1016/j.gpb.2022.05.007. Epub 2022 Jun 17. Genomics Proteomics Bioinformatics. 2023. PMID: 35718270 Free PMC article. Review.
-
scAWMV: an adaptively weighted multi-view learning framework for the integrative analysis of parallel scRNA-seq and scATAC-seq data.Bioinformatics. 2023 Jan 1;39(1):btac739. doi: 10.1093/bioinformatics/btac739. Bioinformatics. 2023. PMID: 36383176 Free PMC article.
-
Single-cell omics: experimental workflow, data analyses and applications.Sci China Life Sci. 2025 Jan;68(1):5-102. doi: 10.1007/s11427-023-2561-0. Epub 2024 Jul 23. Sci China Life Sci. 2025. PMID: 39060615 Review.
-
iPoLNG-An unsupervised model for the integrative analysis of single-cell multiomics data.Front Genet. 2023 Feb 7;14:998504. doi: 10.3389/fgene.2023.998504. eCollection 2023. Front Genet. 2023. PMID: 36865385 Free PMC article.
References
Publication types
MeSH terms
Substances
LinkOut - more resources
Full Text Sources
