

Estimating the effects of non-pharmaceutical interventions on the number of new infections with COVID-19 during the first epidemic wave
- PMID: 34077448
- PMCID: PMC8171941
- DOI: 10.1371/journal.pone.0252827
Estimating the effects of non-pharmaceutical interventions on the number of new infections with COVID-19 during the first epidemic wave
Abstract
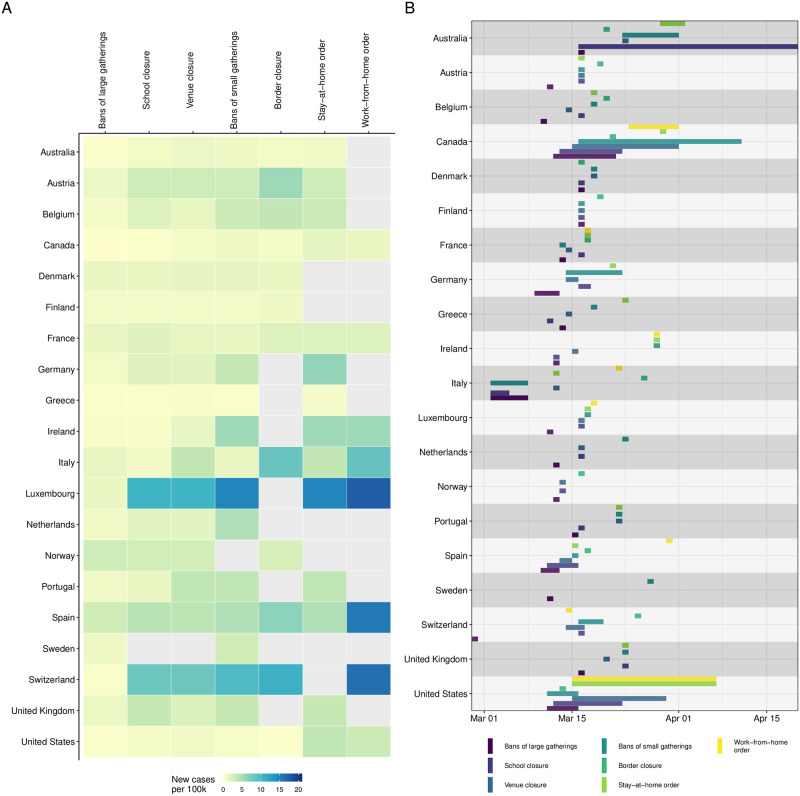
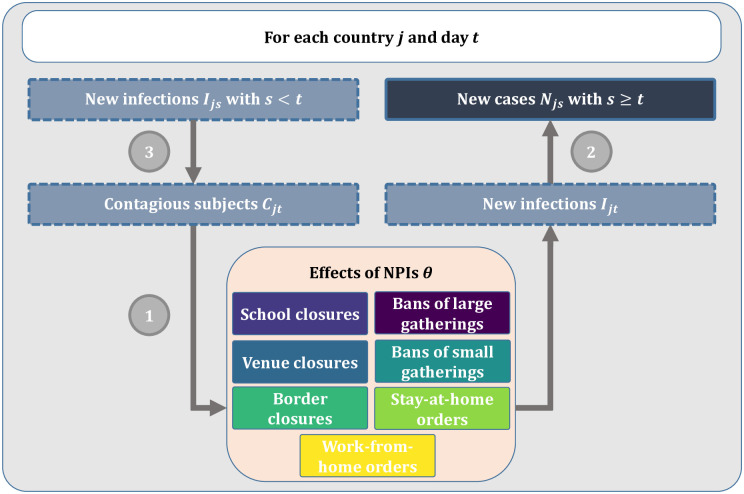
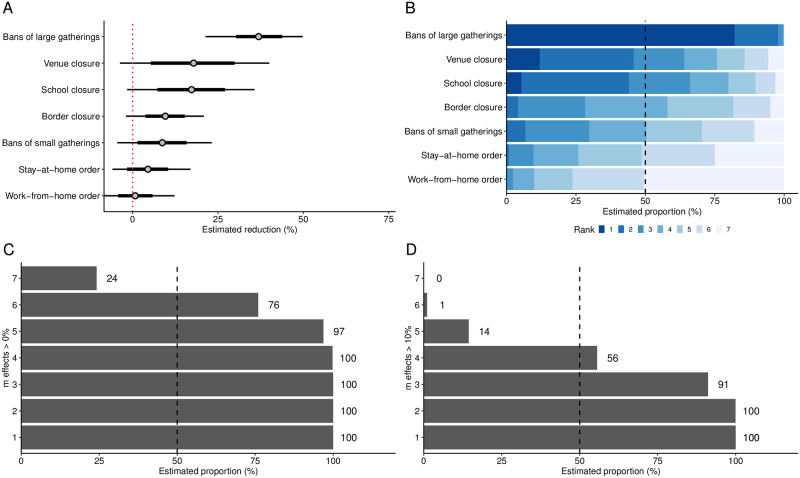
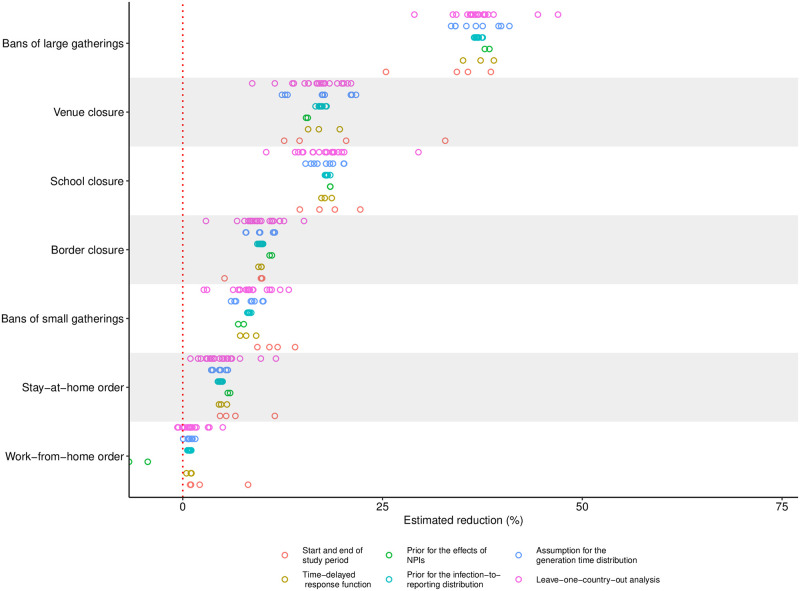
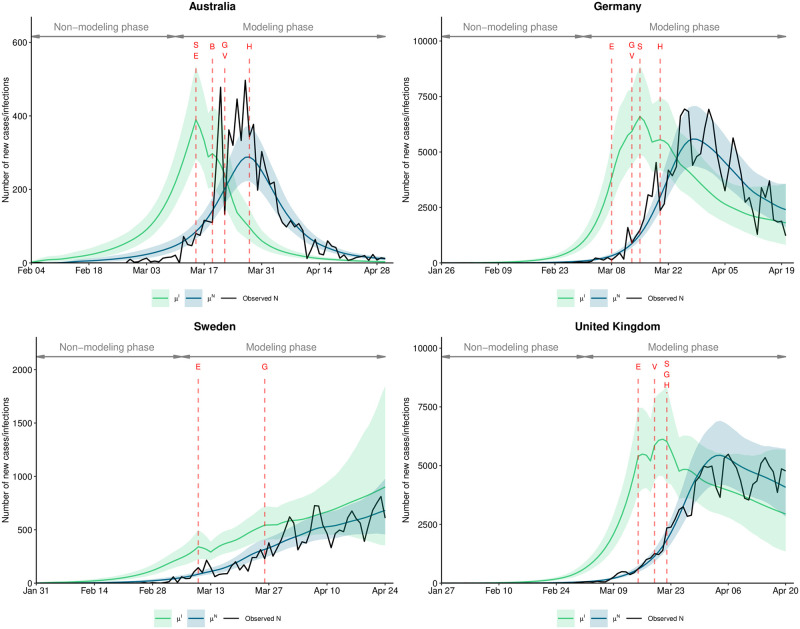
The novel coronavirus (SARS-CoV-2) has rapidly developed into a global epidemic. To control its spread, countries have implemented non-pharmaceutical interventions (NPIs), such as school closures, bans of small gatherings, or even stay-at-home orders. Here we study the effectiveness of seven NPIs in reducing the number of new infections, which was inferred from the reported cases of COVID-19 using a semi-mechanistic Bayesian hierarchical model. Based on data from the first epidemic wave of n = 20 countries (i.e., the United States, Canada, Australia, the EU-15 countries, Norway, and Switzerland), we estimate the relative reduction in the number of new infections attributed to each NPI. Among the NPIs considered, bans of large gatherings were most effective, followed by venue and school closures, whereas stay-at-home orders and work-from-home orders were least effective. With this retrospective cross-country analysis, we provide estimates regarding the effectiveness of different NPIs during the first epidemic wave.
Conflict of interest statement
SF reports membership in a COVID-19 working group of the World Health Organization but without competing interest. JPS declares part-time employment at Luciole Medical outside of the submitted work. SF reports grants from the Swiss National Science Foundation outside of the submitted work. All other authors declare no competing interests. All competing interests do not alter our adherence to PLOS ONE policies on sharing data and materials.
Figures
References
-
- World Health Organization. Coronavirus diseases (COVID-19) advice for the public. 2020. Available from: https://www.who.int/emergencies/diseases/novel-coronavirus-2019/advice-f....
-
- Cowling BJ, Ali ST, Ng TWY, Tsang TK, Li JCM, Fong MW, et al. Impact assessment of non-pharmaceutical interventions against coronavirus disease 2019 and influenza in Hong Kong: an observational study. The Lancet Public Health. 2020. 4;5(5):e279–e288. Available from: https://linkinghub.elsevier.com/retrieve/pii/S2468266720300906. - PMC - PubMed
-
- Davies NG, Kucharski AJ, Eggo RM, Gimma A, Edmunds WJ, Jombart T, et al. Effects of non-pharmaceutical interventions on COVID-19 cases, deaths, and demand for hospital services in the UK: a modelling study. The Lancet Public Health. 2020. 4;5(7):e375–e385. Available from: https://linkinghub.elsevier.com/retrieve/pii/S2468266720300906. - PMC - PubMed
-
- Dehning J, Zierenberg J, Spitzner FP, Wibral M, Neto JP, Wilczek M, et al. Inferring change points in the spread of COVID-19 reveals the effectiveness of interventions. Science. 2020. 4;369(6500):eabb9789. Available from: https://www.sciencemag.org/lookup/doi/10.1126/science.abb9789. - DOI - PMC - PubMed
-
- Gatto M, Bertuzzo E, Mari L, Miccoli S, Carraro L, Casagrandi R, et al. Spread and dynamics of the COVID-19 epidemic in Italy: Effects of emergency containment measures. Proceedings of the National Academy of Sciences. 2020. 4;117(19):10484–10491. Available from: https://www.pnas.org/content/early/2020/04/22/2004978117. - PMC - PubMed
Publication types
MeSH terms
LinkOut - more resources
Full Text Sources
Medical
Miscellaneous
