. 2021 Sep 15;30(19):1811-1832.
doi: 10.1093/hmg/ddab149.

Cognitive deficits in episodic ataxia type 2 mouse models

Affiliations

Cognitive deficits in episodic ataxia type 2 mouse models

Pauline Bohne et al. Hum Mol Genet. .

Abstract

Episodic ataxia type 2 (EA2) is a rare autosomal dominant disorder characterized by motor incoordination, paroxysmal dystonia, vertigo, nystagmus and more recently cognitive deficits. To date over 100 mutations in the CACNA1A gene have been identified in EA2 patients leading to a loss of P/Q-type channel activity, dysfunction of cerebellar Purkinje cells and motor incoordination. To determine if the cerebellum is contributing to these cognitive deficits, we examined two different EA2 mouse models for cognition impairments where CACNA1A was removed specifically from cerebellar Purkinje or granule cells postnatally. Both mutant mouse models showed anxiolytic behavior to lighted, open areas in the open field and light/dark place preference tests but enhanced anxiousness in the novel suppressed feeding test. However, EA2 mice continued to show augmented latencies in the light/dark preference test and when the arena was divided into two dark zones in the dark/dark preference test. Moreover, increased latencies were also displayed in the novel object recognition test, indicating that EA2 mice are indecisive and anxious to explore new territories and objects and may have memory recognition deficits. Exposure to a foreign mouse led to deficiencies in attention and sniffing as well as in social and genital sniffing. These data suggest that postnatal removal of the P/Q type calcium channel from the cerebellum regulates neuronal activity involved in anxiety, memory, decision making and social interactions. Our EA2 mice will provide a model to identify the mechanisms and therapeutic agents underlying cognitive and psychiatric disorders seen in EA2 patients.


Figures

Figure 1
Figure 1
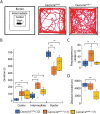
EA2 mouse models, Cacna1apurk(−/−) and Cacna1aquirk(−/−) show anxiolytic behavior in open field test. (A) Schematic of the different areas analyzed in the open field (left) which includes the border, intermediate and center regions. Mice were placed in the center at the start of the test and allowed to explore for 15 min. An example trace from one Cacna1aCitrine (middle) and Cacna1apurk(−/−) (right). (B) Average time Cacna1aCitrine (blue), Cacna1apurk(−/−) (orange) and Cacna1aquirk(−/−) (yellow) mice spent in the center, intermediate or border areas of the open field. (C) Frequency each mouse group visited the center region. (D) Total distance moved for Cacna1aCitrine (blue), Cacna1apurk(−/−) (orange) and Cacna1aquirk(−/−) (yellow) mice. Cacna1apurk(−/−) and Cacna1aquirk(−/−) mice tended to spent less time in the border and more time in the center and intermediate regions than the Cacna1aCitrine. The number of mice tested/group is indicated in parentheses in legend. Statistical significance was evaluated with one-way ANOVA (*P ≤ 0.05, **P ≤ 0.01; ***P ≤ 0.001).
Figure 2
Figure 2
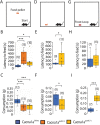
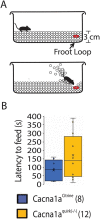
EA2 mouse models, Cacna1apurk(−/−) and Cacna1aquirk(−/−) show anxious and indecisive behavior in the novelty-suppressed feeding test. Schematic of the NSF arena, where a ~ 2 g food pellet was offered in the center (A) or border (D) or a Froot Loop was given at the border (G). Mice started in the right corner of the arena. The latency to feed (B, E, H) and food consumption (C, F, I) for Cacna1aCitrine (blue), Cacna1apurk(−/−) (orange) and Cacna1aquirk(−/−) (yellow) mice are depicted as whisker boxplots. Cacna1apurk(−/−) and Cacna1aquirk(−/−) mice demonstrated a decreased latency to feed and consumption compared with Cacna1aCitrine when the food pellet is given in the center or border of the arena (B, E). Cacna1aquirk(−/−) mice shows comparable latencies with feed (H) and had a higher food consumption (I) compared with Cacna1aCitrine mice, when a Froot Loop is given at the border. The number of mice tested/group is indicated in parentheses in legend. Statistical significance was evaluated with ANOVA (*P ≤ 0.05, **, ***P ≤ 0.001).
Figure 3
Figure 3
EA2 mouse models, Cacna1apurk(−/−) and Cacna1aquirk(−/−) demonstrate anxiolytic and indecisive behavior in place preference test. (A) Schematic of the place preference test (left) which was divided into a light and dark zone. Mice were started in the light zone in the far corner opposite to the dark zone entrance and given 5 min to explore both zones. Representative traces from a Cacna1aCitrine (middle) and Cacna1apurk(−/−) (right) mouse. Whisker boxplots from the duration spent in the light or dark zone (B), latency to the dark zone (C), number of mice (n) with <100 s or >100 s latency to light zone times (D) and the number of transitions (n) between the light and dark zones (E) for Cacna1aCitrine (blue), Cacna1apurk(−/−) (orange) and Cacna1aquirk(−/−) (yellow) mice are depicted. Cacna1apurk(−/−) and Cacna1aquirk(−/−) mice spent more time in the light zone due to their inability to transition to the dark zone as evident from their long latencies to dark zone and low number of transitions. In fact 9 Cacna1apurk(−/−) and 2 Cacna1aquirk(−/−) mice did not leave the light zone. Whereas the Cacna1aCitrine mice spent equal time in both arenas. The number of mice tested/group is indicated in parentheses in legend. Statistical significance was evaluated with one-way ANOVA (*P ≤ 0.05, ***P ≤ 0.001).
Figure 4
Figure 4
EA2 mouse models, Cacna1apurk(−/−) and Cacna1aquirk(−/−) demonstrate decision making deficits in dark/dark place preference test. (A) Schematic of the dark/dark place preference test (left) which was divided into two dark zones, A and B. Mice started in dark zone A opposite to the dark zone B entrance and given 10 min to explore both zones. Representative traces from a Cacna1aCitrine (middle) and Cacna1apurk(−/−) (right) mouse. Duration spent in the dark zone A and B (B), latency to zone B (C), number of mice (n) with <100 s (gray), >100 s (pink) or >300 s (red) latency to dark zone B times (D) and number of transitions (n) between dark zones (E) for Cacna1aCitrine (blue), Cacna1apurk(−/−) (orange) and Cacna1aquirk(−/−) (yellow) mice are depicted as whisker boxplots. Cacna1apurk(−/−) and Cacna1aquirk(−/−) mice initially spent more time in dark zone A as a reflection of the increased number of mice with >100 s latency to zone B times. Despite high latencies to zone B, Cacna1aquirk(−/−) mice spent equal time in both arenas like control Cacna1aCitrine mice. The number of mice tested/group is indicated in parentheses in legend. Statistical significance was evaluated with one-way ANOVA (*P ≤ 0.05, ***P ≤ 0.001).
Figure 5
Figure 5
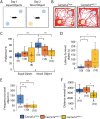
EA2 mouse models, Cacna1apurk(−/−) and Cacna1aquirk(−/−) display cognitive impairments in recognition memory. (A) Schematic of the novel object recognition test. After mice were habituated to the open field, the mice were placed in the middle of an open field between 2 equal (identical) objects on the first day and 1 familiar and 1 novel object on the second day of testing. (B) Representative traces from a Cacna1aCitrine (left) and Cacna1apurk(−/−) (right) mouse are shown on day 2. Whisker boxplots of the preference (%) for equal versus novel objects (C), latency to novel object (D), frequency (n) of visits to novel object (E) and total distance moved in the presence of the novel object (F) for Cacna1aCitrine (blue), Cacna1apurk(−/−) (orange) and Cacna1aquirk(−/−) (yellow) mice are depicted. Cacna1apurk(−/−) and Cacna1aquirk(−/−) mice demonstrated a lower preference, increased latency to first and decreased frequency of visits for the novel object compared with control Cacna1aCitrine mice. Whereas the Cacna1aCitrine mice spent more time and visits to the novel object. The number of mice tested/group is indicated in parentheses in legend. Statistical significance was evaluated with one-way ANOVA (*P ≤ 0.05, **P ≤ 0.01; ***P ≤ 0.001).
Figure 6
Figure 6
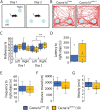
EA2 mice, Cacna1aquirk(−/−) do not display spatial memory impairments in the object relocation test. (A) Schematic of the object relocation test. The mouse was habituated to the two identical, non-social objects on the first day, while on day 2 the right object was moved. (B) Example traces of a Cacna1aCitrine (left) and Cacna1aquirk(−/−) mouse (right) after the right object was relocated. Both Cacna1aquirk(−/−) and Cacna1aCitrine mice showed equal preference for both objects on day 1, but spent significantly more time on the relocated right object on day 2 (C). (D) Cacna1aquirk(−/−) mice showed higher latency to first visit the relocated object compared with control mice, while the frequency of visits (E), the total distance moved (F) and velocity (G) were identical. The number of mice tested/group is indicated in parentheses in legend. Statistical significance was evaluated with ANOVA (*P ≤ 0.05, **P ≤ 0.01; ***P ≤ 0.001).
Figure 7
Figure 7
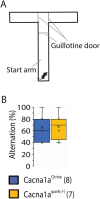
EA2 mice Cacna1aquirk(−/−) have no difficulties in decision making in the T-maze test. (A) Schematic of the T maze containing a center partition at the last third of the start arm and three guillotine doors, one at the start of the center partition and at the start of each deciding arm. (B) Cacna1aquirk(−/−) mice needed more trials to complete the T-maze test, but had no conspicuities in decision making and showed identical alternations to control Cacna1aCitrine mice. The number of mice tested/group is indicated in parentheses in legend. Statistical significance was evaluated with ANOVA.
Figure 8
Figure 8
EA2 mouse models, Cacna1apurk(−/−) and Cacna1aquirk(−/−) demonstrate social interaction deficiencies. The duration and number of social events for attention (A), sniffing (B), social sniffing (C) and genital sniffing (D) were analyzed from Cacna1aCitrine (left), Cacna1apurk(−/−) (middle) and Cacna1aquirk(−/−) (right) mice after a 5 min exposure to a foreign C57/Bl6 mouse. The number and genotype of mice tested/group is indicated on y axis and plotted against the time (s) sequence of events. Each mouse is represented as a different color. Each dash represents a new event and time point of occurrence. The length of the dash represents the duration of the event. The average duration (time (s)) and number of events (n) for each mouse group is depicted as whisker boxplots. The number of mice tested/group is indicated in parentheses in legend. Statistical significance was evaluated with one-way ANOVA (*P ≤ 0.05, ***P ≤ 0.001).
Figure 9
Figure 9
Cacna1aquirk(−/−) mice show deficits in social interaction and indifferent behavior in the three chamber social assay. (A) Schematic of the three chamber social assay with a start, non-social (cage) and empty chamber. Example traces of a Cacna1aCitrine (left) and Cacna1aquirk(−/−) (right) mouse depict the explorative behavior of the non-social chamber assay. (B) Schematic of the three chamber social assay, where the empty chamber is changed to a social (mouse) chamber. Example traces of a Cacna1aCitrine (left) and Cacna1aquirk(−/−) (right) mouse depict the explorative behavior. Cacna1aquirk(−/−) mice spent significantly more time in the start chamber compared with control Cacna1aCitrine mice for both paradigms (C, D) and showed less explorative behavior for the cage chamber than control mice (C). Additionally, Cacna1aquirk(−/−) mice spent less time in the 2 cm zone around the cage (E) and displayed less visits of the adjacent area around the cage (F) than controls, indicating a lack of curiosity and motivation. (G) Cacna1aquirk(−/−) mice spent significantly more time in the 2 cm zone around the social than the empty cage, with more visits of the social zone (H) than the cage zone. The number of mice tested/group is indicated in parentheses in legend. Statistical significance was evaluated with ANOVA (*P ≤ 0.05, **P ≤ 0.01; ***P ≤ 0.001).
Figure 10
Figure 10
Cacna1apurk(−/−) mice are nonaggressive compared with Cacna1aquirk(−/−) and Cacna1aCitrine controls in the tube dominance test. (A) Schematic of the tube dominance test where opponents are placed on opposite ends of a tube and the winner displaces their opponent out of the tube. Cacna1aCitrine (blue) controls were paired with gender matched EA2 mice randomly for ≥ 3 trials. (B) Cacna1aCitrine versus Cacna1apurk(−/−) (orange), Cacna1apurk(−/−) mice were docile compared with controls (67% wins). (C) Cacna1aCitrine versus Cacna1aquirk(−/−) (yellow), both lines showed similar levels of aggression with a tie of 54%. The percentage of winners from each group is indicated in the pie graphs. The number of mice tested/group is indicated in parentheses.
Figure 11
Figure 11
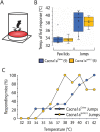
EA2 mice, Cacna1aquirk(−/−) show no sensorimotor deficits and altered nociception in the hotplate test. (A) Schematic of the test apparatus. The mouse was placed on a 32°C warm aluminum plate surrounded by a plexiglass cylinder, which is heated to 42°C with 1°C/min. (B) Average temperature for the first reaction to the increasing heat of Cacna1aCitrine (blue) and Cacna1aquirk(−/−) (yellow) mice. Licking the paws was observed at lower temperatures (~ 33°C) for both mouse lines, while first jumps were observed at temperatures above 38°C. There was no significant change in the latency to jump between the mouse lines. (C) Cacna1aquirk(−/−) (yellow) mice respond earlier to increasing temperatures than Cacna1aCitrine mice. 100% of Cacna1aquirk(−/−) mice started to jump ~ 38°C, whereas only 30% of Cacna1aCitrine were jumping as response to the heat. Control mice show a more linear response to the increasing heat compared with EA2 mice. The number of mice tested/group is indicated in parentheses in legend. Statistical significance was evaluated with ANOVA (*P ≤ 0.05, **P ≤ 0.01; ***P ≤ 0.001).
Figure 12
Figure 12
Cacna1aquirk(−/−) EA2 mice and controls do not display olfactory deficits in the buried food test. (A) Schematic of the buried food test, where a Froot Loop was buried under 1 cm from 3 cm of total regular cage bedding. Mice were starved for 24 h and given 15 min on the test day to find and bite the treat. (B) The latency to feed is not significantly altered in Cacna1aquirk(−/−) (yellow) compared with Cacna1aCitrine (blue) mice. We observed that both mouse lines detected the hidden Froot Loop, but that Cacna1aquirk(−/−) took more time to dig it out due to their motor deficits. The number of mice tested/group is indicated in parentheses in legend. Statistical significance was evaluated with ANOVA.
Figure 13
Figure 13
EA2 mice, Cacna1aquirk(−/−) show defensive escape behavior in the looming test. (A) Schematic of the looming test. An expanding black disk on an LCD monitor is used as looming stimulus and presented from above. (B) EA2 mice reacted with decreased impulsive flight behavior to the looming stimulus but responded with increased freezing behavior compared with control Cacna1aCitrine mice. Both Cacna1aquirk(−/−) and control mice showed the same number of unresponsive trials. (C) The response duration per trial of freezing or flight behavior in Cacna1aquirk(−/−) mice was not different from the response duration of Cacna1aCitrine mice. The number of mice tested/group is indicated in parentheses in legend. Statistical significance was evaluated with ANOVA (**P ≤ 0.01).

Similar articles

Cited by

References

    1. Jen, J., Kim, G.W. and Baloh, R.W. (2004) Clinical spectrum of episodic ataxia type 2. Neurology, 62, 17–22. - PubMed
    1. Nachbauer, W., Nocker, M., Karner, E., Stankovic, I., Unterberger, I., Eigentler, A., Schneider, R., Poewe, W., Delazer, M. and Boesch, S. (2014) Episodic ataxia type 2: phenotype characteristics of a novel CACNA1A mutation and review of the literature. J. Neurol., 261, 983–991. - PubMed
    1. Jaudon, F., Baldassari, S., Musante, I., Thalhammer, A., Zara, F. and Cingolani, L.A. (2020) Targeting alternative splicing as a potential therapy for episodic ataxia type 2. Biomedicine, 8, 332. - PMC - PubMed
    1. Jelitai, M., Puggioni, P., Ishikawa, T., Rinaldi, A. and Duguid, I. (2016) Dendritic excitation-inhibition balance shapes cerebellar output during motor behaviour. Nat. Commun., 7, 13722 (1-13). - PMC - PubMed
    1. Tara, E., Vitenzon, A., Hess, E. and Khodakhah, K. (2018) Aberrant cerebellar Purkinje cell activity as the cause of motor attacks in a mouse model of episodic ataxia type 2. Dis. Models Mech., 11, dmm034181. - PMC - PubMed

Publication types

Supplementary concepts