

Range probing as a quality control tool for CBCT-based synthetic CTs: In vivo application for head and neck cancer patients
- PMID: 34077554
- PMCID: PMC8456797
- DOI: 10.1002/mp.15020
Range probing as a quality control tool for CBCT-based synthetic CTs: In vivo application for head and neck cancer patients
Abstract
Purpose: Cone-beam CT (CBCT)-based synthetic CTs (sCT) produced with a deep convolutional neural network (DCNN) show high image quality, suggesting their potential usability in adaptive proton therapy workflows. However, the nature of such workflows involving DCNNs prevents the user from having direct control over their output. Therefore, quality control (QC) tools that monitor the sCTs and detect failures or outliers in the generated images are needed. This work evaluates the potential of using a range-probing (RP)-based QC tool to verify sCTs generated by a DCNN. Such a RP QC tool experimentally assesses the CT number accuracy in sCTs.
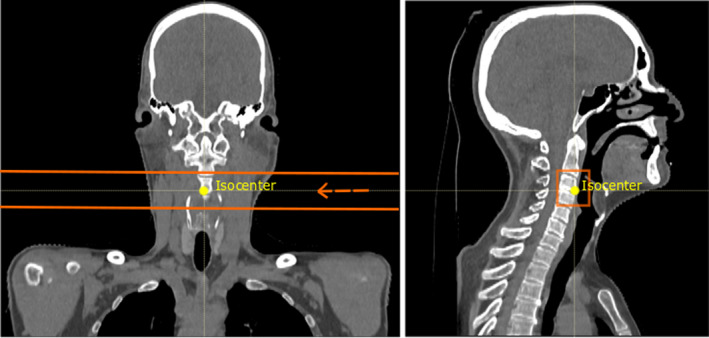
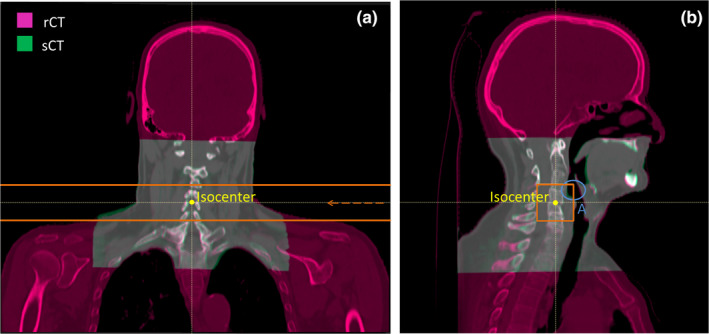
Methods: A RP QC dataset consisting of repeat CTs (rCT), CBCTs, and RP acquisitions of seven head and neck cancer patients was retrospectively assessed. CBCT-based sCTs were generated using a DCNN. The CT number accuracy in the sCTs was evaluated by computing relative range errors between measured RP fields and RP field simulations based on rCT and sCT images.
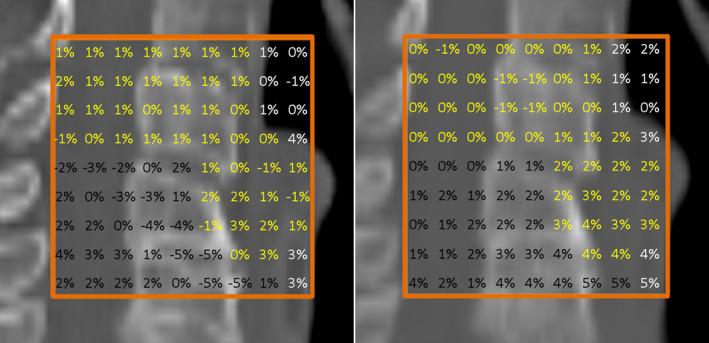
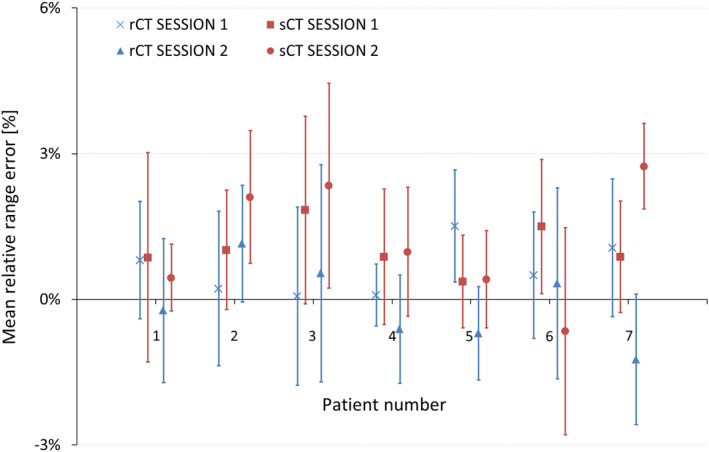
Results: Mean relative range errors showed agreement between measured and simulated RP fields, ranging from -1.2% to 1.5% in rCTs, and from -0.7% to 2.7% in sCTs.
Conclusions: The agreement between measured and simulated RP fields suggests the suitability of sCTs for proton dose calculations. This outcome brings sCTs generated by DCNNs closer toward clinical implementation within adaptive proton therapy treatment workflows. The proposed RP QC tool allows for CT number accuracy assessment in sCTs and can provide means of in vivo range verification.
Keywords: adaptive proton therapy; neural networks; proton radiography; quality control; synthetic CT.
© 2021 The Authors. Medical Physics published by Wiley Periodicals LLC on behalf of American Association of Physicists in Medicine.
Conflict of interest statement
Langendijk JA is a consultant for proton therapy equipment provider IBA.
University of Groningen, University Medical Centre Groningen, Department of Radiation Oncology has active research agreements with RaySearch, Philips, IBA, Mirada, Orfit.
Meijers A discloses being in a paid working relationship with Varian Medical Systems, USA, as of 01/Apr/2020 outside of the scope of the work reported on this manuscript.
Figures
References
-
- Lim‐Reinders S, Keller BM, Al‐Ward S, Sahgal A, Kim A. Online adaptive radiation therapy. Int J Radiat Oncol Biol Phys. 2017;99:994–1003. - PubMed
-
- Yan D, Vicini F, Wong J, Martinez A. Adaptive radiation therapy. Phys Med Biol. 1997;42:123–132. - PubMed
-
- Sonke JJ, Aznar M, Rasch C. Adaptive radiotherapy for anatomical changes. Semin Radiat Oncol. 2019;29:245–257. - PubMed
-
- Veiga C, Janssens G, Teng C‐L, et al. First clinical investigation of cone beam computed tomography and deformable registration for adaptive proton therapy for lung cancer. Int J Radiat Oncol Biol Phys. 2016;95:549–559. - PubMed
MeSH terms
Grants and funding
LinkOut - more resources
Full Text Sources
Medical
Research Materials
