

Genetic basis of kernel starch content decoded in a maize multi-parent population
- PMID: 34077617
- PMCID: PMC8541773
- DOI: 10.1111/pbi.13645
Genetic basis of kernel starch content decoded in a maize multi-parent population
Abstract
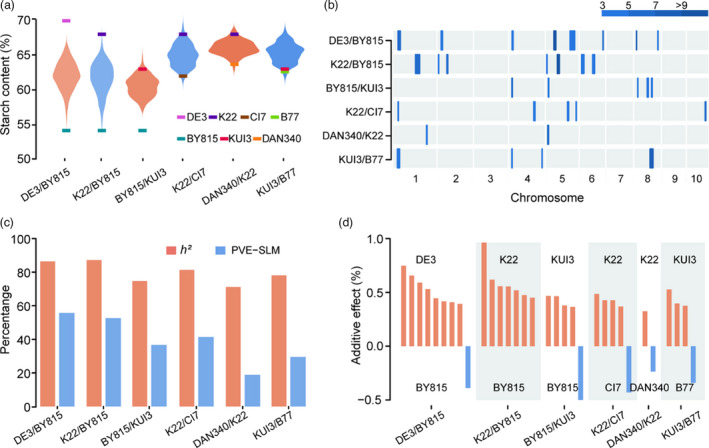
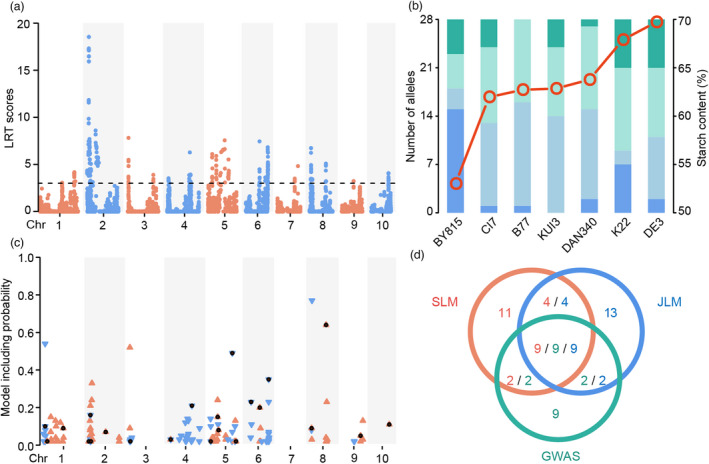
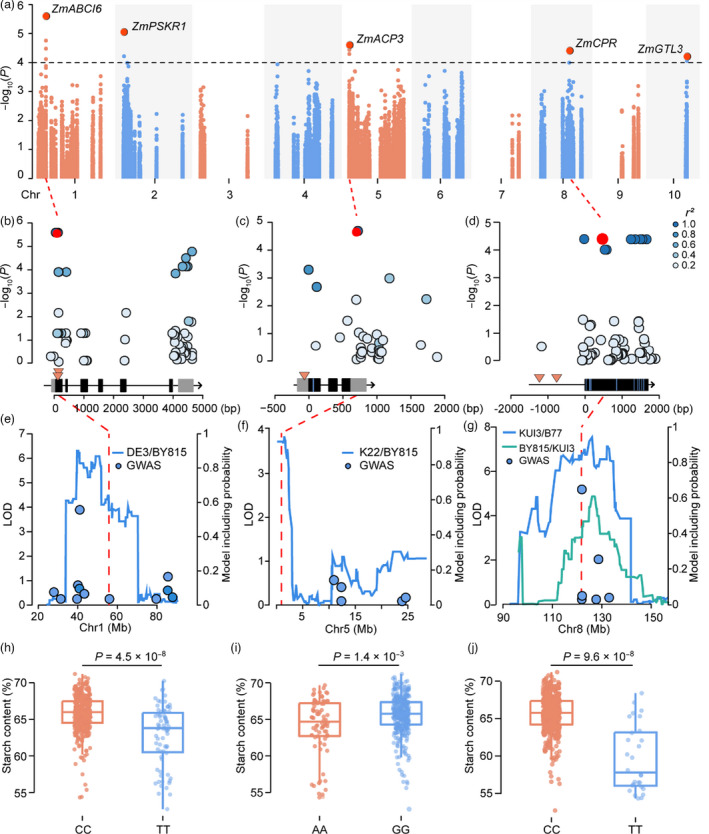
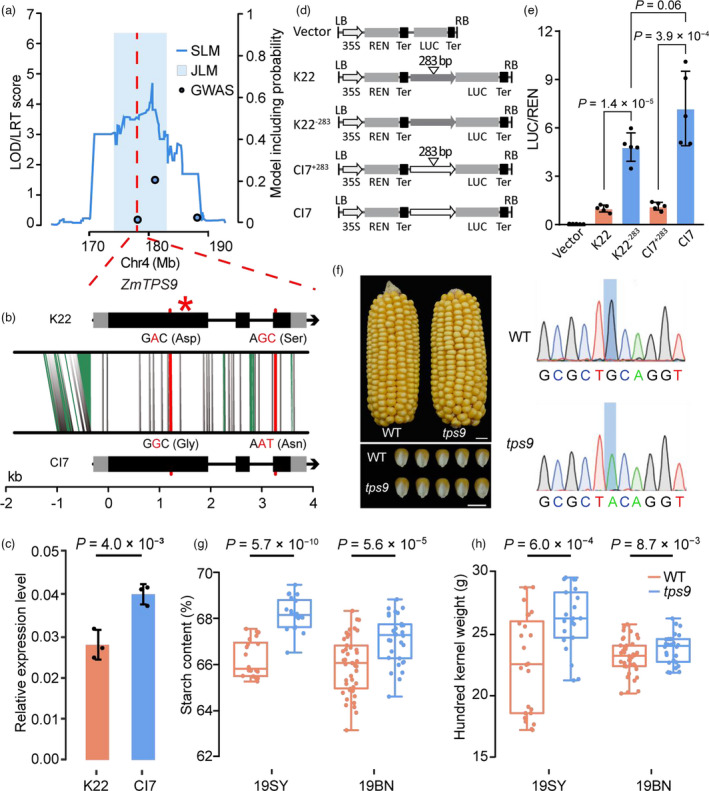
Starch is the most abundant storage carbohydrate in maize kernels and provides calories for humans and other animals as well as raw materials for various industrial applications. Decoding the genetic basis of natural variation in kernel starch content is needed to manipulate starch quantity and quality via molecular breeding to meet future needs. Here, we identified 50 unique single quantitative trait loci (QTLs) for starch content with 18 novel QTLs via single linkage mapping, joint linkage mapping and a genome-wide association study in a multi-parent population containing six recombinant inbred line populations. Only five QTLs explained over 10% of phenotypic variation in single populations. In addition to a few large-effect and many small-effect additive QTLs, limited pairs of epistatic QTLs also contributed to the genetic basis of the variation in kernel starch content. A regional association study identified five non-starch-pathway genes that were the causal candidate genes underlying the identified QTLs for starch content. The pathway-driven analysis identified ZmTPS9, which encodes a trehalose-6-phosphate synthase in the trehalose pathway, as the causal gene for the QTL qSTA4-2, which was detected by all three statistical analyses. Knockout of ZmTPS9 increased kernel starch content and, in turn, kernel weight in maize, suggesting potential applications for ZmTPS9 in maize starch and yield improvement. These findings extend our knowledge about the genetic basis of starch content in maize kernels and provide valuable information for maize genetic improvement of starch quantity and quality.
Keywords: association mapping; linkage analysis; pathway-driven; starch content; trehalose-6-phosphate synthase.
© 2021 The Authors. Plant Biotechnology Journal published by Society for Experimental Biology and The Association of Applied Biologists and John Wiley & Sons Ltd.
Conflict of interest statement
The authors declare that they have no competing interests.
Figures
Similar articles
-
Novel candidate genes and genetic basis analysis of kernel starch content in tropical maize.BMC Plant Biol. 2025 Jan 24;25(1):105. doi: 10.1186/s12870-025-06125-5. BMC Plant Biol. 2025. PMID: 39856590 Free PMC article.
-
Genetic basis of maize kernel starch content revealed by high-density single nucleotide polymorphism markers in a recombinant inbred line population.BMC Plant Biol. 2015 Dec 12;15:288. doi: 10.1186/s12870-015-0675-2. BMC Plant Biol. 2015. PMID: 26654531 Free PMC article.
-
Linkage and association mapping in multi-parental populations reveal the genetic basis of carotenoid variation in maize kernels.Plant Biotechnol J. 2024 Aug;22(8):2312-2326. doi: 10.1111/pbi.14346. Epub 2024 Mar 28. Plant Biotechnol J. 2024. PMID: 38548388 Free PMC article.
-
Genetic basis of maize kernel oil-related traits revealed by high-density SNP markers in a recombinant inbred line population.BMC Plant Biol. 2021 Jul 21;21(1):344. doi: 10.1186/s12870-021-03089-0. BMC Plant Biol. 2021. PMID: 34289812 Free PMC article.
-
Genetic architecture of maize kernel composition in the nested association mapping and inbred association panels.Plant Physiol. 2012 Feb;158(2):824-34. doi: 10.1104/pp.111.185033. Epub 2011 Dec 1. Plant Physiol. 2012. PMID: 22135431 Free PMC article.
Cited by
-
Efficiency of mapping epistatic quantitative trait loci.Heredity (Edinb). 2023 Jul;131(1):25-32. doi: 10.1038/s41437-023-00618-5. Epub 2023 May 8. Heredity (Edinb). 2023. PMID: 37157025 Free PMC article.
-
Understanding grain development in the Poaceae family by comparing conserved and distinctive pathways through omics studies in wheat and maize.Front Plant Sci. 2024 Jul 18;15:1393140. doi: 10.3389/fpls.2024.1393140. eCollection 2024. Front Plant Sci. 2024. PMID: 39100085 Free PMC article. Review.
-
Novel candidate genes and genetic basis analysis of kernel starch content in tropical maize.BMC Plant Biol. 2025 Jan 24;25(1):105. doi: 10.1186/s12870-025-06125-5. BMC Plant Biol. 2025. PMID: 39856590 Free PMC article.
-
Discovery and validation of SSR marker-based QTL governing fresh pod yield in dolichos bean (Lablab purpureus L. Sweet).Sci Rep. 2025 Mar 12;15(1):8613. doi: 10.1038/s41598-025-90558-3. Sci Rep. 2025. PMID: 40075147 Free PMC article.
-
Genetic dissection of QTLs for starch content in four maize DH populations.Front Plant Sci. 2022 Oct 6;13:950664. doi: 10.3389/fpls.2022.950664. eCollection 2022. Front Plant Sci. 2022. PMID: 36275573 Free PMC article.
References
-
- Bazakos, C. , Hanemian, M. , Trontin, C. , Jimenez‐Gomez, J.M. and Loudet, O. (2017) New strategies and tools in quantitative genetics: How to go from the phenotype to the genotype. Annu. Rev. Plant Biol. 68, 435–455. - PubMed
-
- Beloff‐Chain, A. and Pocchiari, F. (1960) Carbohydrate metabolism. Annu. Rev. Biochem. 29, 295–346. - PubMed
-
- Bradbury, P.J. , Zhang, Z. , Kroon, D.E. , Casstevens, T.M. , Ramdoss, Y. and Buckler, E.S. (2007) TASSEL: software for association mapping of complex traits in diverse samples. Bioinformatics, 23, 2633–2635. - PubMed
Publication types
MeSH terms
Substances
LinkOut - more resources
Full Text Sources
