. 2021 Jun 1;35(9):109209.
doi: 10.1016/j.celrep.2021.109209.

Reliance on Cox10 and oxidative metabolism for antigen-specific NK cell expansion

Affiliations

Reliance on Cox10 and oxidative metabolism for antigen-specific NK cell expansion

Annelise Y Mah-Som et al. Cell Rep. .

Abstract

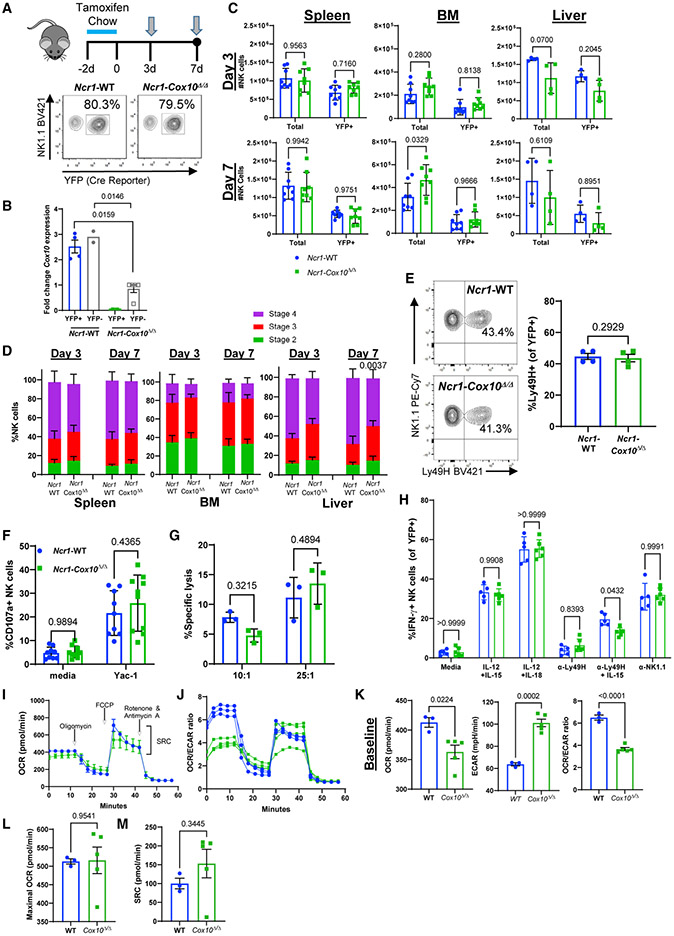
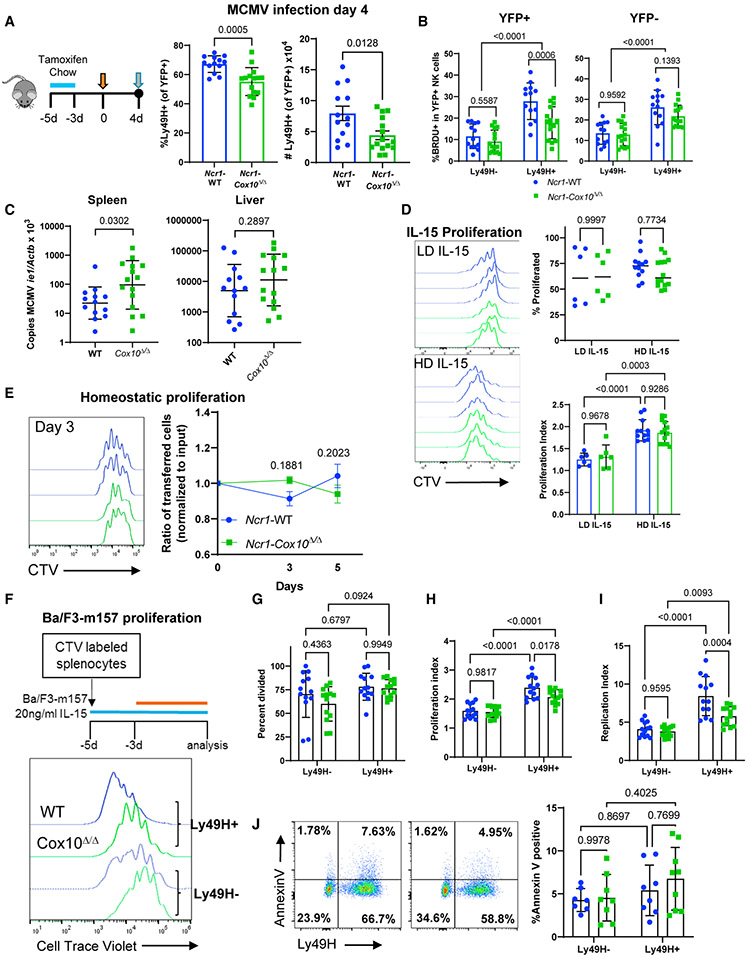
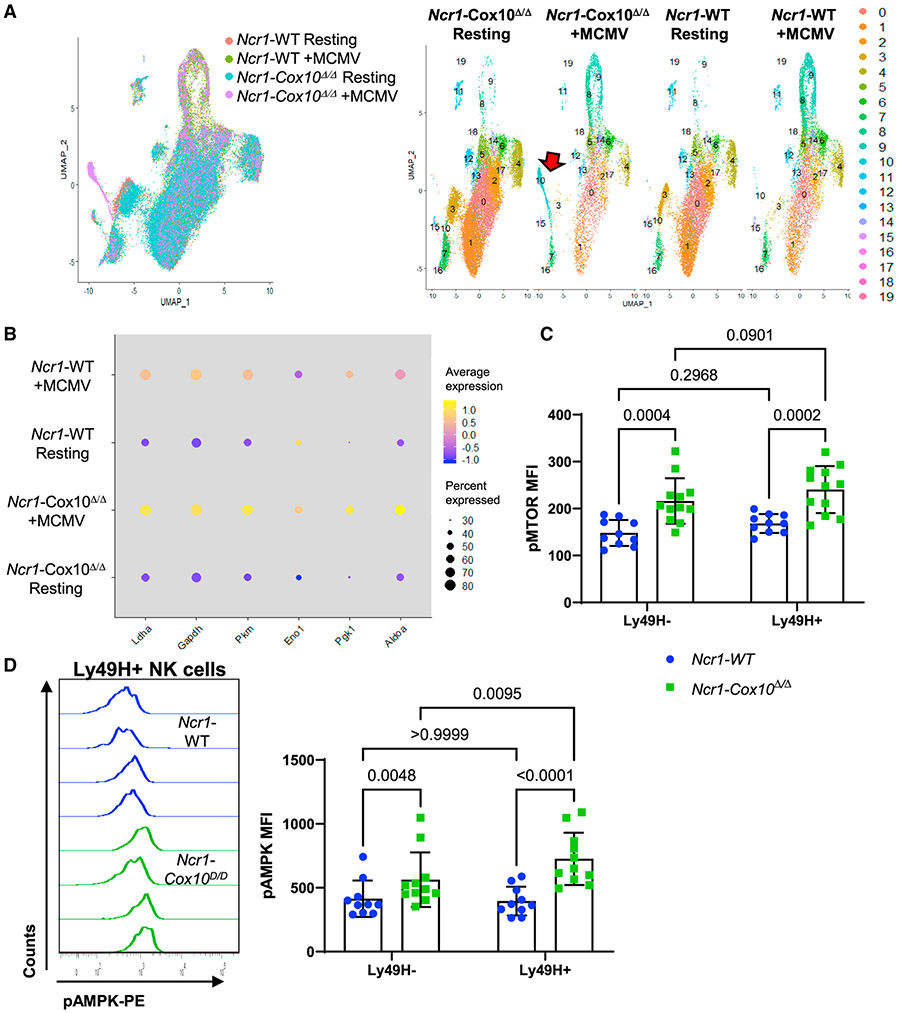
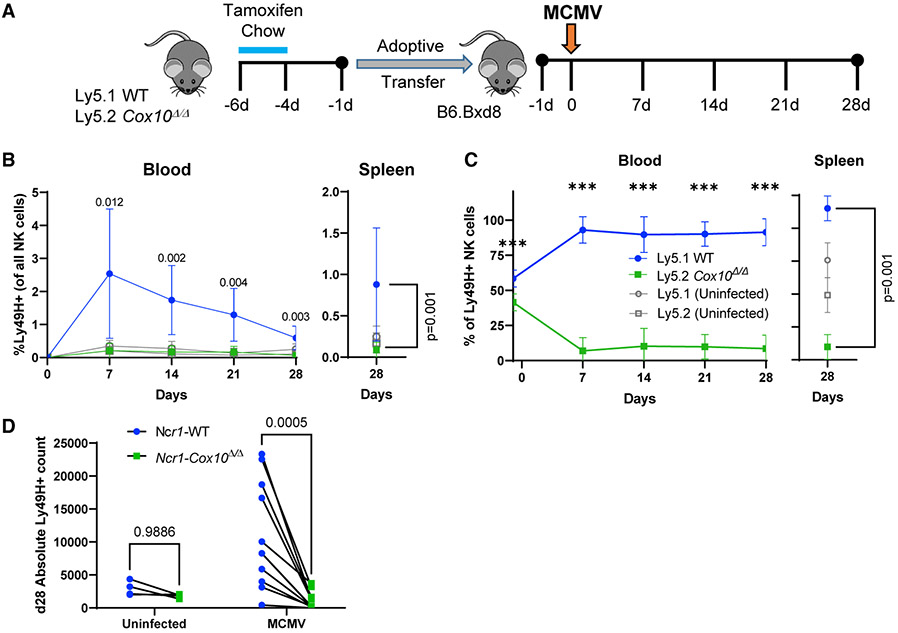
Natural killer (NK) cell effector functions are dependent on metabolic regulation of cellular function; however, less is known about in vivo metabolic pathways required for NK cell antiviral function. Mice with an inducible NK-specific deletion of Cox10, which encodes a component of electron transport chain complex IV, were generated to investigate the role of oxidative phosphorylation in NK cells during murine cytomegalovirus (MCMV) infection. Ncr1-Cox10Δ/Δ mice had normal numbers of NK cells but impaired expansion of antigen-specific Ly49H+ NK cells and impaired NK cell memory formation. Proliferation in vitro and homeostatic expansion were intact, indicating a specific metabolic requirement for antigen-driven proliferation. Cox10-deficient NK cells upregulated glycolysis, associated with increased AMP-activated protein kinase (AMPK) and mammalian target of rapamycin (mTOR) activation, although this was insufficient to protect the host. These data demonstrate that oxidative metabolism is required for NK cell antiviral responses in vivo.

Keywords: Cox10; NK cells; metabolism; murine cytomegalovirus; oxidative phosphorylation; proliferation.


Conflict of interest statement

Declaration of interests The authors declare no competing interests.

Figures

Figure 1.
Figure 1.. Phenotype of NK cells in inducible Ncr1-Cox10Δ/Δ mice
(A) Mice were fed tamoxifen-containing chow for 2 days and then analyzed after 3 or 7 days. Representative flow of Cre induction by the YFP reporter (day 3) is shown. (B) Cox10 transcript (day 3), normalized to YFP cells from Ncr1-Cox10Δ/Δ mice (Mann-Whitney test, n = 2–5 mice/group, two independent experiments, error bars represent SEM). (C) Absolute numbers of YFP+ NK cells in the spleen, bone marrow (BM), and liver (two-way ANOVA, n = 8 mice/group, three independent experiments, pooled data shown, error bars represent SD). (D) NK maturation of YFP+ cells by CD11b and CD27; stage 2 = CD27+CD11b, stage 3 = CD27+CD11b+, stage 4 = CD27CD11b+ (two-way ANOVA, n = 8 mice/group, three independent experiments with all p > 0.1000, except as shown, error bars represent SD). (E) Normal expression of Ly49H (day 3, n = 4 mice/group, paired t test, error bars represent SEM). (F) Degranulation of NK cells (CD107a) was similar (n = 9–10 mice/group, three independent experiments, two-way ANOVA, error bars represent SD). (G) Killing of YAC-1 targets demonstrates similar cytotoxic capacity (day 3, n = 3 mice/group, two-way ANOVA, one experiment shown representative of three independent experiments, error bars represent SD). (H) Percentage of IFN-γ+ NK cells following stimulation with cytokines (IL12+IL-15 or IL-12+IL-18) or activating receptors (anti-Ly49H, anti-Ly49H+IL-15, and anti-NK1.1) (mixed effects analysis with Sidak’s multiple comparisons test, n = 5–6 mice/group, two independent experiments, pooled data shown, error bars represent SD). (I–M) Extracellular flux assay of YFP+ NK cells cultured with IL-2. (I and J) Oxygen consumption rate (OCR; I) and OCR/ECAR (extracellular acidification rate) ratio (J) during Mito Stress test (Agilent Technologies). (K) Cox10-deficient NK cells had a lower baseline OCR and higher ECAR, with a decreased OCR/ECAR ratio. (L and M) Spare respiratory capacity (SRC; L) and maximal OCR (M) after carbonyl cyanide-p-trifluoromethoxyphenylhydrazone (FCCP) were similar (n = 3-5 technical replicates using n = 5–8 pooled mice, unpaired Student’s t test, error bars show SEM).
Figure 2.
Figure 2.. Cox10-deficient NK cells have impaired proliferation in response to activating ligand stimulation during MCMV infection
(A–C) Female Ncr1-Cox10Δ/Δ and Ncr1-WT mice were infected with 5 × 10⁴ plaque-forming units (PFU) of MCMV and analyzed at day 4. (A) The percentage and number of YFP+Ly49H+ NK cells were significantly lower in Ncr1-Cox10Δ/Δ mice. (B) BrdU incorporation was lower in Ly49H+ NK cells lacking Cox10 (YFP+ Ly49H cells from Ncr1-Cox10Δ/Δ mice), demonstrating a defect in proliferation in antigen-specific NK cells. (C) MCMV copy number normalized to β-actin was higher in Ncr1-Cox10Δ/Δ mice. Data in (A)–(C) represent four separate experiments (individual mice are shown), analyzed using an unpaired t test for (A), a two-way ANOVA for (B), and an unpaired t test of log-transformed data for (C). (D) NK cell proliferation following 3 days of IL-15 culture. Representative CTV histograms are shown for WT (blue) or Cox10-deficient (green) NK cells with low-dose IL-15 (LD, 5–10 ng/mL) or high-dose IL-15 (HD, 100 ng/mL). The percentage of proliferated cells was the same between the LD and HD groups. The proliferation index was the same between WT and Cox10-deficient cells and was higher with HD IL-15 compared to LD IL-15 (n = 6–14/group in four independent experiments, pooled data shown, two-way ANOVA). (E) WT and Cox10-deficient NK cells were co-transferred into Rag2−/− γc−/− host mice, with similar ratios of cells recovered. (n = 2 hosts/group in three independent experiments, pooled data analyzed by two-way ANOVA). (F) Ncr1-Cox10Δ/Δ and Ncr1-WT splenocytes cultured with IL-15 for 2 days followed by addition of Ba/F3-m157 cells for 3 days. Representative flow histograms of CTV for Ly49H+ and Ly49H NK cells (all YFP+) are shown. (G–I) There was no difference in percentage of cells that divided (G), but proliferation analysis demonstrated significantly reduced (H) proliferation index and (I) replication index in Ly49H+ Cox10-deficient NK cells compared to WT (two-way ANOVA, n = 13 mice/group in five independent experiments). (J) Annexin V staining was similar, representative flow plots with WT on the left and Cox10-deficient on the right and pooled data shown (two-way ANOVA, n = 7–9 mice/group, three independent experiments). For all experiments, error bars represent mean and SD.
Figure 3.
Figure 3.. Single-cell RNA-seq and evaluation of mTOR and AMPK activation in NK cells during MCMV infection
(A and B) Ncr1-Cox10Δ/Δ and Ncr1-WT NK cells were examined by single-cell sequencing 4 days after MCMV infection with uninfected controls. (A) UMAP clustering of expression data using 20 principal components. Clusters 8 and 9 were expanded in response to MCMV infection in both groups, but cluster 10 was primarily expanded only with Cox10-deficient infected mice, accounting for ~20% of NK cells. (B) Dot plot showing percentage of cells per sample expressing gene of interest (size) and average expression of gene (color) of transcriptionally regulated glycolytic genes upregulated during MCMV infection. (C and D) NK cells from Ncr1-Cox10Δ/Δ and Ncr1-WT mice 4 days after MCMV expressing phosphorylated (C) mTOR and (D) AMPK in Ly49H and Ly49H+ populations (mixed effects model with Tukey’s multiple comparison test, three independent experiments, n = 10–12 mice/group, pooled data, error bars represent SD). pAMPK was upregulated specifically in Ly49H+ Cox10-deficient NK cells.
Figure 4.
Figure 4.. Cox10 deficiency impairs MCMV-induced expansion required for memory formation
(A) Congenic Ncr1-WT and Ncr1-Cox10Δ/Δ mice NK cells were co-transferred at a similar ratio into Ly49H-deficient hosts, and infected with MCMV. The proportion of each cell type was tracked in the blood weekly and in the spleen at day 28. (B) Percentage of transferred Ly49H+ cells present among all NK cells in the host. (C) Ratio of WT to Cox10-deficient NK cells in the blood and spleen (two-way ANOVA for blood, and one-way ANOVA for the spleen, ***p < 0.0001). (D) Absolute number of transferred NK cells in the spleen at day 28 (two-way ANOVA). Pooled data are from three separate experiments; n = 11 recipient infected, 4 uninfected mice, error bars represent SD.

References

    1. Adams NM, Grassmann S, and Sun JC (2020). Clonal expansion of innate and adaptive lymphocytes. Nat. Rev. Immunol 20, 694–707. - PubMed
    1. Antonicka H, Leary SC, Guercin GH, Agar JN, Horvath R, Kennaway NG, Harding CO, Jaksch M, and Shoubridge EA (2003). Mutations in COX10 result in a defect in mitochondrial heme A biosynthesis and account for multiple, early-onset clinical phenotypes associated with isolated COX deficiency. Hum. Mol. Genet 12, 2693–2702. - PubMed
    1. Arase H, Mocarski ES, Campbell AE, Hill AB, and Lanier LL (2002). Direct recognition of cytomegalovirus by activating and inhibitory NK cell receptors. Science 296, 1323–1326. - PubMed
    1. Assmann N, O’Brien KL, Donnelly RP, Dyck L, Zaiatz-Bittencourt V, Loftus RM, Heinrich P, Oefner PJ, Lynch L, Gardiner CM, et al. (2017). Srebp-controlled glucose metabolism is essential for NK cell functional responses. Nat. Immunol 18, 1197–1206. - PubMed
    1. Buck MD, O’Sullivan D, Klein Geltink RI, Curtis JD, Chang CH, Sanin DE, Qiu J, Kretz O, Braas D, van der Windt GJ, et al. (2016). Mitochondrial dynamics controls T cell fate through metabolic programming. Cell 166, 63–76. - PMC - PubMed

Publication types

MeSH terms