. 2021 Jun 1;35(9):109195.
doi: 10.1016/j.celrep.2021.109195.

Type I interferon decreases macrophage energy metabolism during mycobacterial infection

Affiliations

Type I interferon decreases macrophage energy metabolism during mycobacterial infection

Gregory S Olson et al. Cell Rep. .

Abstract

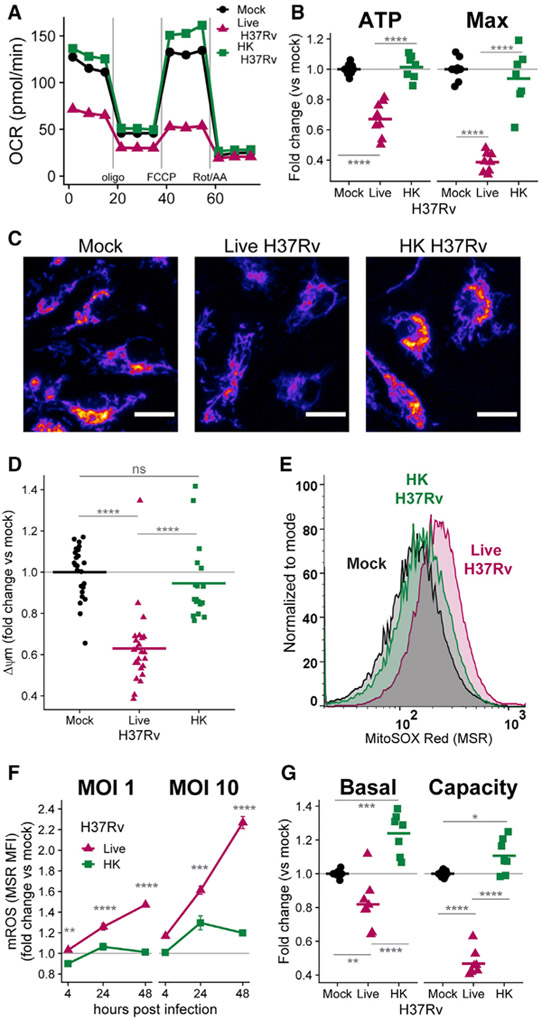
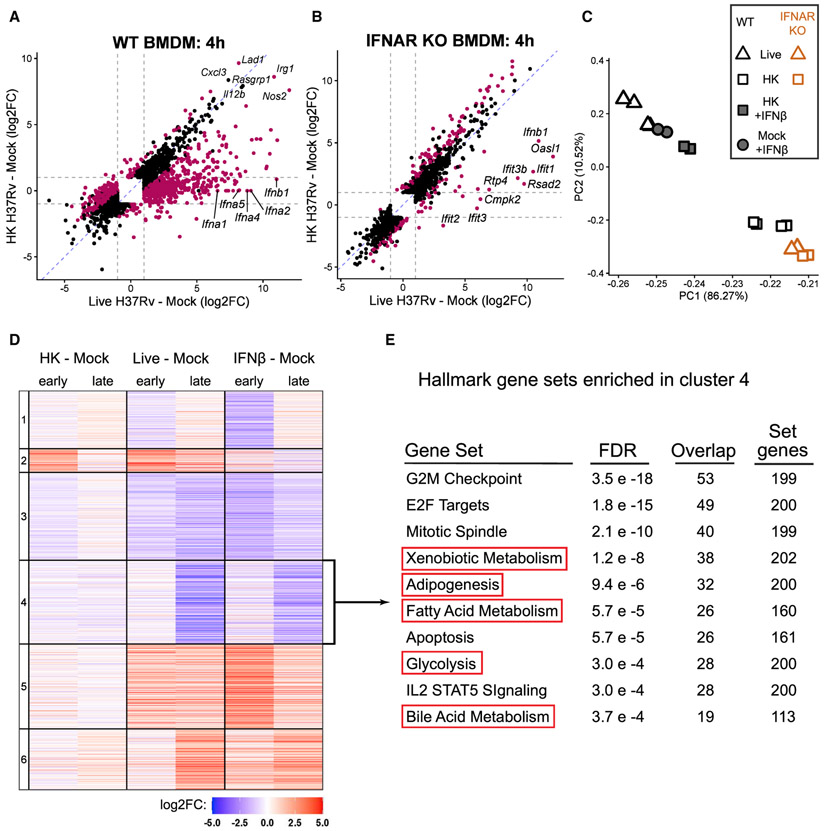
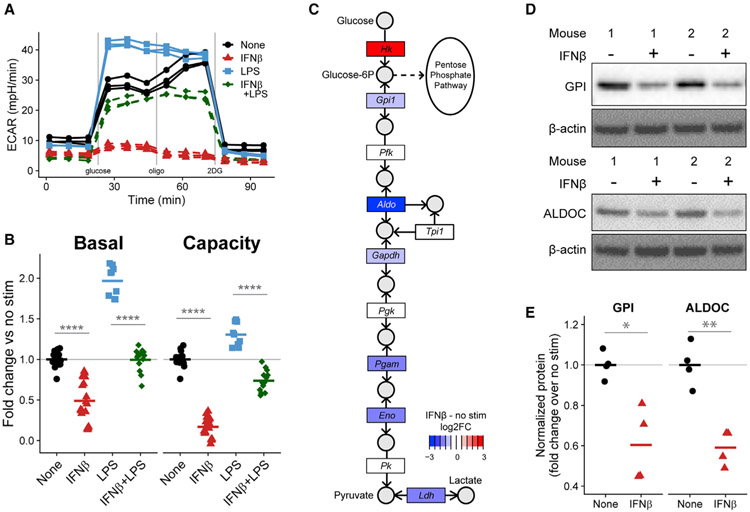
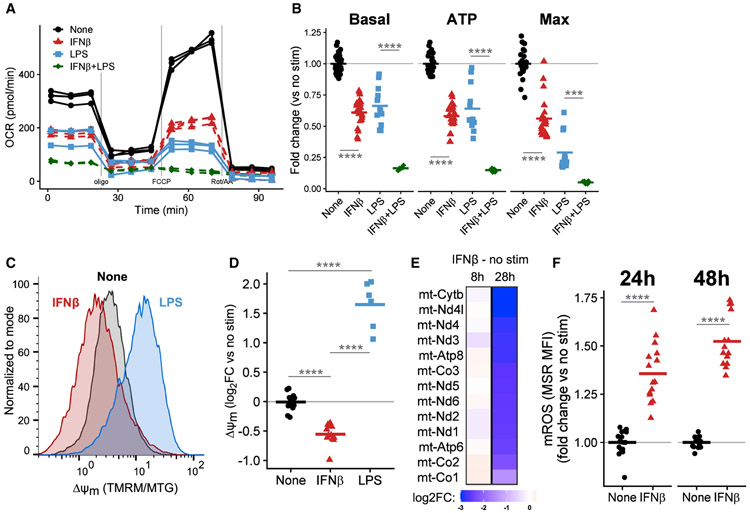
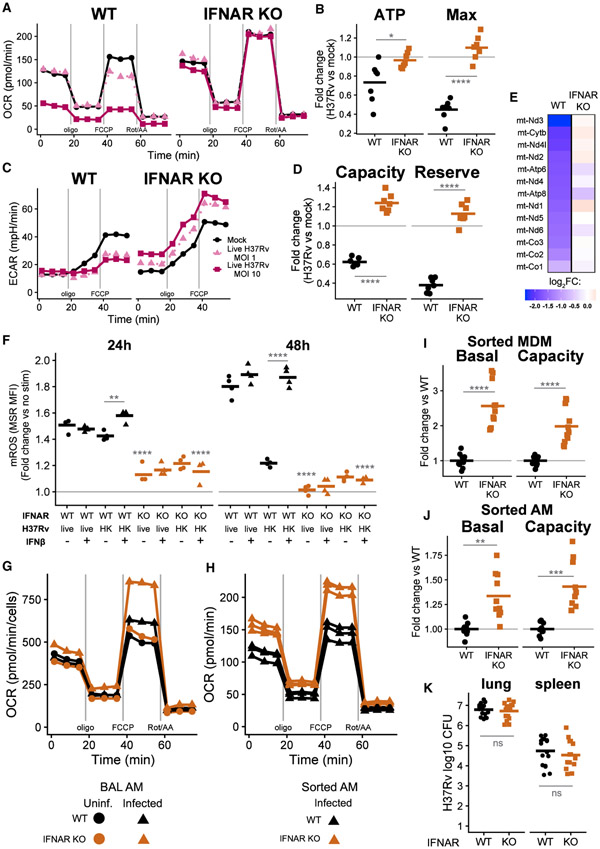
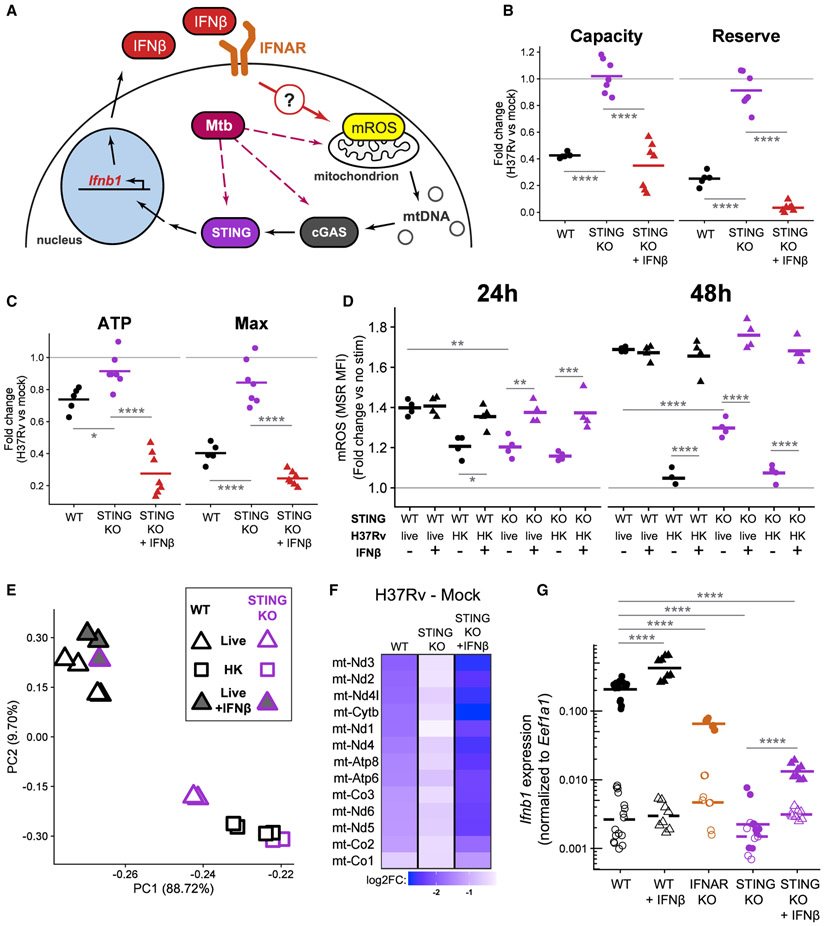
Metabolic reprogramming powers and polarizes macrophage functions, but the nature and regulation of this response during infection with pathogens remain controversial. In this study, we characterize the metabolic and transcriptional responses of murine macrophages to Mycobacterium tuberculosis (Mtb) in order to disentangle the underlying mechanisms. We find that type I interferon (IFN) signaling correlates with the decreased glycolysis and mitochondrial damage that is induced by live, but not killed, Mtb. Macrophages lacking the type I IFN receptor (IFNAR) maintain glycolytic flux and mitochondrial function during Mtb infection in vitro and in vivo. IFNβ itself restrains the glycolytic shift of inflammatory macrophages and initiates mitochondrial stress. We confirm that type I IFN acts upstream of mitochondrial damage using macrophages lacking the protein STING. We suggest that a type I IFN-mitochondrial feedback loop controls macrophage responses to mycobacteria and that this could contribute to pathogenesis across a range of diseases.

Keywords: STING; immunometabolism; macrophage; mitochondria; mycobacteria; tuberculosis; type I interferon.


Conflict of interest statement

Declaration of interests The authors declare no competing interests.

Figures

Figure 1.
Figure 1.. Live H37Rv decreases BMDM metabolism more than does heat-killed (HK) H37Rv
(A) Oxygen consumption rate (OCR) in WT BMDMs 24 h after mock infection or infection with live H37Rv or HK H37Rv at an MOI of 10. A single representative plate is shown. (B) Quantification of mitochondrial parameters derived from (A). The OCR dedicated to ATP production (ATP) or at maximal respiration (Max) was normalized to mock infection controls on each plate. Each dot represents a single well and bars represent the mean. Data from eight plates across three independent experiments. See also Figure S1. (C) Representative images (original magnification, x20) of BMDMs either mock infected (left) or infected with live (middle) or HK (right) H37Rv (MOI of 10) and stained 24 h later with the mitochondrial membrane potential (Δψm)-sensitive dye TMRM (tetramethylrhodamine, methyl ester). TMRM intensity depicted with the “Fire” LUT from Fiji (Schindelin et al., 2012). Scale bars, 15 μm. (D) Quantification of Δψm derived from (C). The TMRM mean fluorescence intensity (MFI) for each field of view was measured in CellProfiler (McQuin et al., 2018) and normalized to mock-infected wells. Each dot represents a single field of view collected across two independent experiments. (E) Representative histograms of MitoSOX Red (MSR) fluorescence quantified with flow cytometry to measure mitochondrial reactive oxygen species (mROS) in BMDMs either mock infected or infected with an MOI of 10 of live H37Rv or HK H37Rv for 24 h. (F) Quantification of mROS derived from (E). MSR MFI in each condition was normalized to mock-infected controls at each time point. Means for four technical replicates ± SEM are shown for a representative experiment of three independent experiments. (G) Fold change in basal glycolysis or glycolytic capacity was calculated relative to mock-infected controls on each plate. Each dot represents a well and bars represent the mean from eight plates across three independent experiments.
Figure 2.
Figure 2.. Type I IFN dominates BMDM transcriptional response to live Mtb and correlates with metabolic changes
(A) Scatterplot of log2FC values of the 2,210 genes differentially expressed (DE) (FDR < 0.001, ∣log2FO∣ > 1; gray dotted lines) across both comparisons in WT BMDMs. Magenta points represent genes significantly DE directly comparing the infection conditions (live H37Rv infected – HK H37Rv infected). (B) As in (A), except showing the 1,712 genes DE across the same comparisons in IFNAR KO BMDMs. See also Figure S2. (C) Principal-component analysis of WT or IFNAR KO BMDMs at 24 h post-infection with live H37Rv or HK H37Rv at an 10 of MOI. WT BMDMs were either left untreated or treated with 500 U/mL IFNβ. The percent of variance explained by the top two principal components is indicated. (D) Heatmap showing the cluster number (left) and log2FC of the 6,337 genes differentially expressed in any of the six comparisons in WT BMDMs. (E) The 1,411 genes from cluster 4 were tested for enrichment in the Hallmark gene sets from MSigDB (Liberzon et al., 2015; Subramanian et al., 2005) using a hypergeometric test for overlap. The 10 gene sets with the smallest FDR are shown.
Figure 3.
Figure 3.. IFNβ restrains BMDM glycolytic machinery
(A) Extracellular acidification rate (ECAR) of WT BMDMs either untreated or treated with 500 U/mL IFNβ, 10 ng/mL LPS, or both for 24 h. A single representative plate is shown. See also Figure S3. (B) Quantification of glycolytic parameters derived from (A). Each dot represents a single well and the bar is the mean from three (LPS alone), five (IFNβ), or four (both) independent experiments. (C) Log2FC (RNA-seq) in expression of gene families (rectangles) involved in the KEGG glycolysis pathway comparing WT BMDMs treated with 500 U/mL IFNβ for 28 h to untreated BMDMs. Key metabolites (circles) are labeled. (D) Western blots of cell lysates from two independent WT mice either untreated or treated with 500 U/mL IFNβ for 24 h. (E) Quantification of (D) showing four biological replicates across two independent experiments. The bars show the mean.
Figure 4.
Figure 4.. IFNβ impairs mitochondrial function and induces mitochondrial stress in BMDMs
(A) OCR of WT BMDMs untreated or treated with 500 U/mL IFNβ, 10 ng/mL LPS, or both for 24 h. A single representative plate is shown. (B) Quantification of mitochondrial parameters derived from (A). Each dot represents a single well and the bar is the mean from four (LPS conditions), six (IFNβ), or three (both) independent experiments. See also Figure S4. (C) Δψm was calculated by normalizing TMRM to MitoTracker Green (MTG) fluorescence measured by flow cytometry. Representative histograms of BMDMs untreated or treated with 500 U/mL IFNβ or 10 ng/mL LPS for 48 h. (D) Quantification of Δψm derived from (C). The TMRM/MTG ratio was normalized to the mean of uninfected wells. Each point is a single well and the bar is the mean from three experiments. (E) Log2FC in expression (RNA-seq) of the 13 protein coding genes encoded on mtDNA in WT BMDMs treated with 500 U/mL IFNβ compared to untreated cells for the indicated time. (F) Quantification of mROS in WT BMDMs untreated or treated with 500 U/mL IFNβ for indicated times. mROS were measured with MSR MFI normalized to untreated controls at each time point. Each point represents a single well and the bar is the mean from five independent experiments.
Figure 5.
Figure 5.. Type I IFN restrains macrophage metabolism during live Mtb infection
(A) OCR of WT BMDMs (left) or IFNAR KO BMDMs (right) either mock infected or infected with live H37v at an MOI of 1 or 10 for 24 h. A single representative plate is shown. (B) Quantification of mitochondrial parameters in BMDMs infected with live H37Rv (MOI of 10) derived from (A). Each point represents a single well and the bar is the mean from seven plates across two independent experiments. (C) ECAR from the same conditions as in (A). A single representative plate is shown. (D) Quantification of glycolytic parameters in BMDMs infected with live H37Rv (MOI of 10) derived from (C). Each point represents a single well and the bar is the mean from seven plates across two independent experiments. (E) Log2FC in expression (RNA-seq) of the 13 protein coding genes encoded on mtDNA in WT or IFNAR KO BMDMs infected with live H37Rv (MOI of 10) for 24 h compared to mock-infected cells of each genotype. (F) mROS in WT or IFNAR KO BMDMs infected with an MOI of 10 live H37Rv or HK H37Rv for either 24 or 48 h. BMDMs were either untreated or treated with 500 U/mL IFNβ. mROS measured with MSR MFI (flow cytometry) normalized to untreated, mock-infected controls at each time point. A representative experiment of two independent experiments is shown. Statistical tests shown comparing genotypes within the same infection and treatment conditions unless otherwise specified. (G) OCR during a mitochondrial stress test of alveolar macrophages (AMs) isolated by BAL from WT or IFNAR KO mice either uninfected or infected for 15 days with a high-dose aerosol challenge of H37Rv. One of six plates from two independent experiments is shown. (H) OCR during a mitochondrial stress test of AMs sorted by fluorescence-activated cell sorting (FACS) from WT or IFNAR KO mice 15 days after aerosol infection. Each line is a technical replicate (across three plates) from one of three independent experiments. (I and J) Basal glycolysis and glycolytic capacity for (I) monocyte-derived macrophages (MDMs) or (J) AMs sorted by FACS 15 days after aerosol infection. Points are technical replicates (across nine plates) and the bar is the mean for three independent experiments. See also Figure S5. (K) Bacterial burden in the lung and spleen of WT and IFNAR KO mice 14–15 days after high-dose aerosol infection. CFU were enumerated by serial dilution on 7H10 plates. Each dot is an individual mouse from three independent experiments and the bars represent the mean.
Figure 6.
Figure 6.. STING signaling is upstream of mitochondrial damage during Mtb infection
(A) Proposed model of positive feedback loop: IFNβ signaling through IFNAR causes mitochondrial damage, which could release mtDNA to be sensed by the cGAS-STING signaling pathway, leading to induction of Ifnb1 expression and IFNβ secretion. (B) Quantification of glycolytic parameters in BMDMs infected with live H37Rv (MOI of 10). The ECAR representing glycolytic capacity or the glycolytic reserve of infected WT, infected, untreated STING KO, or infected, IFNβ-treated STING KO BMDMs was normalized to mock-infected controls. Each point represents a single well and the bars are the mean from six plates from two independent experiments. See also Figure S6. (C) Quantification of mitochondrial parameters in BMDMs infected with live H37Rv (MOI of 10). The OCR dedicated to ATP production (ATP) or at maximal respiration (Max) was normalized to mock-infected, untreated controls. Each point represents a single well and the bars are the mean from six plates from two independent experiments. (D) Quantification of mROS in WT or STING KO BMDMs infected with an MOI of 10 live H37Rv or HK H37Rv for the indicated time. BMDMs were either untreated or treated with 500 U/mL IFNβ. mROS measured with MSR MFI (flow cytometry) normalized to untreated, mock-infected controls at each time point. A representative experiment of two independent experiments is shown. (E) Principal-component analysis of WT or STING KO BMDMs at 24 h post-infection with an MOI of 10 live H37Rv or HK H37Rv. BMDMs infected with live H37Rv were left untreated or treated with 500 U/mL IFNβ. The percent of variance explained by the top two principal components is indicated. (F) Log2FC in expression (RNA-seq) of the 13 protein coding genes encoded on mtDNA in BMDMs (either WT or STING KO) infected with live H37Rv at an MOI of 10 for 24 h compared to mock infection. STING KO BMDMs were either left untreated or treated with 500 U/mL IFNβ in addition to the infection. (G) Expression of Ifnb1 in WT, IFNAR KO, or STING KO BMDMs either mock infected (open symbols and dashed line) or infected with an MOI of 10 live H37Rv (filled symbols and solid line) for 4 h. WT and STING KO BMDMs were either left untreated or treated with 500 U/mL IFNβ. Ifnb1 expression was quantified by qRT-PCR. Each point represents a technical replicate and the bars are the mean from two independent experiments from each KO genotype. Statistics shown for comparisons of Ifnb1 expression after H37Rv infection.

References

    1. Ahmed D, Roy D, Jaworski A, Edwards A, Abizaid A, Kumar A, Golshani A, and Cassol E (2019). Differential remodeling of the electron transport chain is required to support TLR3 and TLR4 signaling and cytokine production in macrophages. Sci. Rep 9, 18801. - PMC - PubMed
    1. Antonelli LRV, Gigliotti Rothfuchs A, Gonçalves R, Roffê E, Cheever AW, Bafica A, Salazar AM, Feng CG, and Sher A (2010). Intranasal poly-IC treatment exacerbates tuberculosis in mice through the pulmonary recruitment of a pathogen-permissive monocyte/macrophage population. J. Clin. Invest 120, 1674–1682. - PMC - PubMed
    1. Ayres JS (2020). A metabolic handbook for the COVID-19 pandemic. Nat. Metab 2, 572–585. - PMC - PubMed
    1. Banks DA, Ahlbrand SE, Hughitt VK, Shah S, Mayer-Barber KD, Vogel SN, El-Sayed NM, and Briken V (2019). Mycobacterium tuberculosis inhibits autocrine type I IFN signaling to increase intracellular survival. J. Immunol 202, 2348–2359. - PMC - PubMed
    1. Berry MPR, Graham CM, McNab FW, Xu Z, Bloch SAA, Oni T, Wilkinson KA, Banchereau R, Skinner J, Wilkinson RJ, et al. (2010).An interferon-inducible neutrophil-driven blood transcriptional signature in human tuberculosis. Nature 466, 973–977. - PMC - PubMed

Publication types