. 2021 Jun 1;35(9):109196.
doi: 10.1016/j.celrep.2021.109196.

An acquired acyltransferase promotes Klebsiella pneumoniae ST258 respiratory infection

Affiliations

An acquired acyltransferase promotes Klebsiella pneumoniae ST258 respiratory infection

Danielle Ahn et al. Cell Rep. .

Abstract

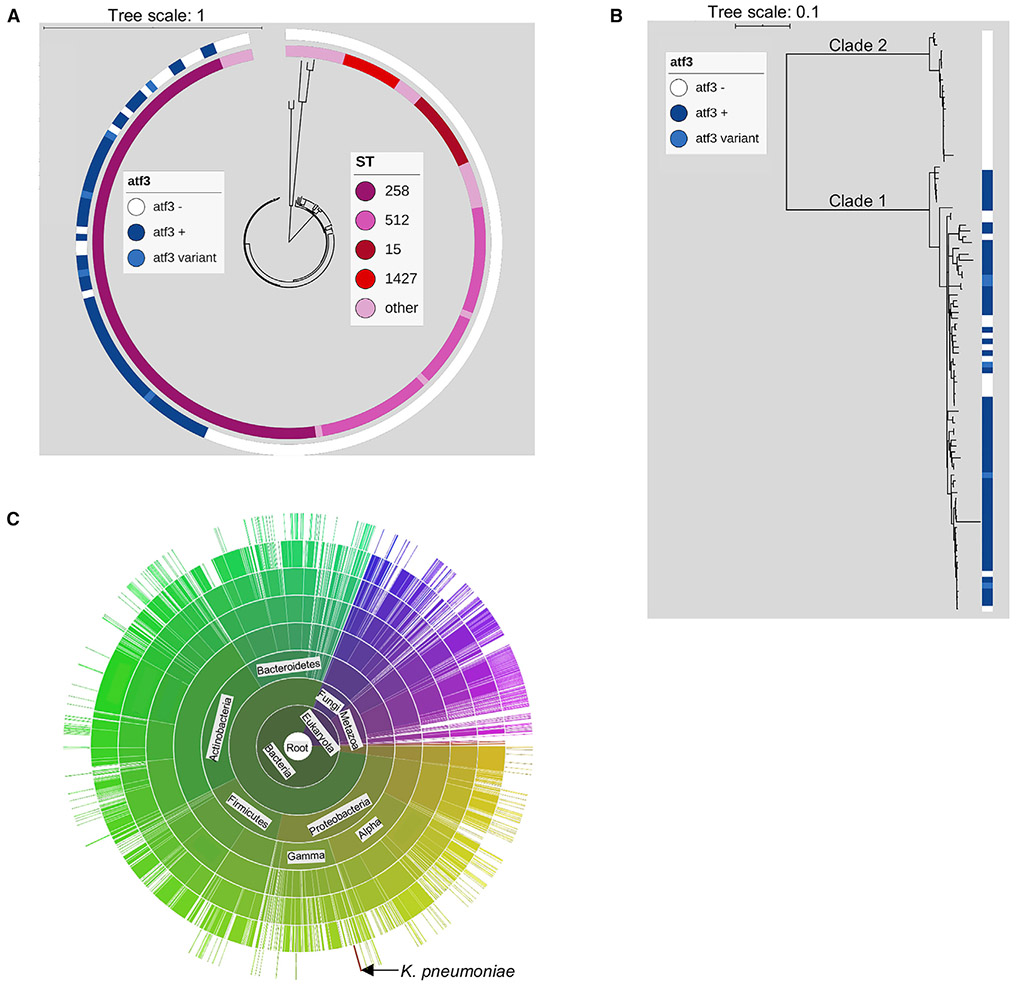
Klebsiella pneumoniae ST258 is a human pathogen associated with poor outcomes worldwide. We identify a member of the acyltransferase superfamily 3 (atf3), enriched within the ST258 clade, that provides a major competitive advantage for the proliferation of these organisms in vivo. Comparison of a wild-type ST258 strain (KP35) and a Δatf3 isogenic mutant generated by CRISPR-Cas9 targeting reveals greater NADH:ubiquinone oxidoreductase transcription and ATP generation, fueled by increased glycolysis. The acquisition of atf3 induces changes in the bacterial acetylome, promoting lysine acetylation of multiple proteins involved in central metabolism, specifically Zwf (glucose-6 phosphate dehydrogenase). The atf3-mediated metabolic boost leads to greater consumption of glucose in the host airway and increased bacterial burden in the lung, independent of cytokine levels and immune cell recruitment. Acquisition of this acyltransferase enhances fitness of a K. pneumoniae ST258 isolate and may contribute to the success of this clonal complex as a healthcare-associated pathogen.

Keywords: Klebsiella pneumoniae; acetylation; bacterial pneumonia; glycolysis; metabolism; sequence type 258.


Conflict of interest statement

Declaration of interests The authors declare no competing interests.

Figures

Figure 1.
Figure 1.. A novel acyltransferase of the superfamily 3 (atf3) is prevalent in K. pneumoniae ST258 isolates
(A) A phylogenetic tree of the publicly available assemblies of K. pneumoniae isolates. The inner ring represents the ST group to which the isolate belongs and the outer ring is the screen for the atf3 gene, with isolates designated as a variant if it contained at least 1 point mutation. (B) A concentrated phylogenetic tree of ST258 isolates only. (C) A sunburst visualization of species, considering taxonomic lineage, with members of the acyltransferase superfamily 3.
Figure 2.
Figure 2.. The growth rate and lipid A structure for KP35 are unchanged with the deletion of the atf3 gene
(A) Schematic of the KP35 atf3 gene locus using Geneious version 10. (B) Serial optical density at wavelength of 600 nm (OD600) measurements of bacteria were taken over 18 h with intermittent shaking at 37°C in LB. n = 3; each point is the mean value, with bars representing the SEMs. (C) Negative ion mode MALDI-TOF MS lipid A spectra are shown for KP35, Δaft3, and Δatf3atf3 (n = 1). The strains were grown at 37°C in LB for 18 h. Additions of a hydroxyl group (Δm/z 16) and an aminoarabinose group (Δm/z 131) are observed among all 3 strains. The ion at m/z 1972 demonstrates both modifications. In addition, loss of a phosphate (Δm/z 80) is likely a result of harsh lipid A extraction conditions. The ion at m/z 2063 represents the addition of a palmitate (C16, Δm/z 238) acyl chain. (D) Representative structures are shown for the ions at m/z 1825 and m/z 1972. The ion at m/z 1956/1972 represents lipid A species with the addition of 1 aminoarabinose moiety, whereas the ion at m/z 2103 represents the addition of 2 aminoarabinose moieties.
Figure 3.
Figure 3.. Enhanced metabolic properties of K. pneumoniae ST258 in the presence of atf3
(A) Shotgun RNA-seq of bacteria alone, Illumina platform, heatmap of variance stabilized counts. n = 1. (B) KEGG pathway analysis showing the top 10 pathways increased in KP35 with respect to the isogenic mutant. (C) Heatmap of the fold expression of the genes involved in glycolysis and TCA cycle enzymes expressed by KP35 over Δatf3 (n= 1). (D) Single carbon source assimilation (Biolog) (n = 2). KPPR1 = laboratory reference strain ATCC 43816. (E–H) Glycolysis as measured by (E) extracellular acidification rates (ECARs) and (F) oxygen consumption rates (OCRs) as measured by Seahorse analyzer of bacteria alone (n = 4) and (G) and (H) with THP1 s (n = 5). 1 = glucose, 2 = oligomycin, 3 = 2-deoxyglucose; each point is the mean value with bars representing the SEM; *p < 0.05 between KP35 and Δatf3, 2-way ANOVA. (I–K) Intracellular reactive oxygen species (ROS) measured by Mitosox (Invitrogen) dye via flow cytometry (n = 4) (I). (J) Total ATP production (Abcam) (n = 8). For (I) and (J), columns are mean values with bars representing the SEM; ****p < 0.001, 1-way ANOVA, Tukey’s test for multiple comparisons. Heatmap of the fold expression of the Na-independent and -dependent NADH:quinone oxidoreductases expressed by KP35 over Δatf3 via (K) RNA-seq (n = 1) and confirmed with standard qRT-PCR (n = 3, 2 technical replicates per sample). *p < 0.05, **p < 0.01, ***p < 0.005, ****p < 0.001; multiple t tests with a false discovery rate (FDR) of 1%.
Figure 4.
Figure 4.. Post-translational acetylation of glycolysis and TCA cycle enzymes are increased in the presence of atf3
Acetyl-lysine motifs of KP35 and the isogenic mutant were captured with an immunoaffinity bead kit (Cell Signaling). Tandem liquid chromatography/mass spectrometry (LC/LC/MS) was then performed to measure the abundance of acetylation motifs at unique positions (row label) of detected proteins. Heatmaps represent fold abundance of KP35 as compared to the isogenic mutant, with statistically significant differences represented with stars within specific boxes (n = 5). *p < 0.05, **p < 0.01, ***p < 0.005, ****p < 0.001; multiple t tests with a FDR of 1%. Student’s t test performed for datasets with a single acetylation site. Proteins highlighted in gray boxes are members of the metabolic switchboard for glucose utilization.
Figure 5.
Figure 5.. Accumulation of intracellular metabolites in KP35 reflect enhanced glycolysis and TCA cycle activity when atf3 is present
(A) PCA plot of targeted polar intracellular bacterial metabolites measured by LC/MS. n = 5, each point represents a biologic replicate. (B–E) Individual metabolites (B) ATP/ADP, (C) pentose phosphate pathway (purple), (D) glycolysis (gray), and (E) the TCA cycle (blue) were then compared (n = 5). Box and whisker plots with min/max. *p < 0.05, **p < 0.01; multiple t tests with FDR of 1%.
Figure 6.
Figure 6.. The presence of atf3 alters the airway metabolome in KP35 infection
WT C57BL/6J mice were intranasally infected with 1–2 × 10⁸ CFU. (A) Glucose levels measured in BALF of WT mice infected for 48 h via calorimetric assay (Abcam). n = 5 (PBS) or 9–10 (infected); columns are mean values with bars representing SEM; p<0.05 (Mann-Whitney), ****p<0.0001 (one-way ANOVA, Tukey’s test for multiple comparisons); recovered CFUs are shown in Figure 7B. (B) Bacterial CFU recovered from BALF of infected mice of over a time course of infection. (C) PCA plot for metabolites measured from the BALF supernatant of these mice via targeted LC/MS of polar metabolites (n = 2–3, each point represents 1 mouse). (D–H) Selected peak metabolite levels involved in (D) glycolysis, (E) TCA cycle, (F) carnitine-related metabolites, (G) choline-related metabolites, and (H) amino acids measured in BALF at 48 h of infection are shown via heatmap. *p < 0.05, ***p < 0.005; multiple t tests with a FDR of 1%, compared to PBS control.
Figure 7.
Figure 7.. atf3 promotes CRKP persistence in the lung
WT C57BL/6J mice were intranasally infected with 1–2 × 10⁸ CFU for 48 h. (A) In a competition experiment, mice were infected with increasing proportions of KP35:Δatf3 (1:1, 1:5, 1:10), or single isolates alone. BALF recovered and CFU enumerated by serial dilutions, and proportion of bacteria containing atf3 (+) or lacking (−) was measured via PCR amplification with nested primers for atf3. n = 1 for control groups, n = 4 for experimental groups; horizontal lines are median values, and each data point represents an individual mouse; columns are mean values, with bars representing the SD. (B) KP35, Δatf3, and Δatf3atf3 (comp) clearance from bronchoalveolar lavage fluid (BALF), lung homogenate, and spleen homogenate, #, the lower limit of detection. Horizontal lines represent median values, and each data point represents an individual mouse. All of the data were compiled from 3 independent experiments. n = 9–13 per condition. (C) Percentage of the cohort at 168 h that grew bacteria from the BALF above the limit of detection (102 CFU/mL) (n = 3–9). For the mouse experiments, a Mann-Whitney test was performed between control and experimental conditions; *p < 0.05, **p < 0.005. (D) Histopathology of pneumonia with KP35 and Δatf3 with PBS control in H&E-stained sections of lung. Scale bars, 500 μm. (E and F) Selected cytokine and chemokine content of BALF quantified by multiplex assay. The heatmap represents mean values. n = 6 per time point. (Box and whiskers presented in Figure S3.) (G) Cellular response to infection in BALF determined by flow cytometry-monocytic myeloid-derived suppressor cells (M-MDSCs) (CD45+CD11b+MHCIIlo−Ly6ChiLy6Glo) and granulocytic myeloid-derived suppressor cells/neutrophils (G-MDSCs/NEUT) (CD45+CD11b+MHCIIloLy6ChiLy6Ghi). Horizontal lines represent median values, and each data point represents an individual mouse. All of the data were compiled from 2 independent experiments. n = 3–9. (H) A gentamicin protection assay was performed using THP-1 cells stimulated with phorbol 12-myristate 13-acetate (PMA) (1 μM) × 24 h. Data are presented as CFU per live cell, with columns as mean values and bars representing SEMs (n= 4).

References

    1. Ahn D, Peñaloza H, Wang Z, Wickersham M, Parker D, Patel P, Koller A, Chen EI, Bueno SM, Uhlemann AC, and Prince A (2016). Acquired resistance to innate immune clearance promotes Klebsiella pneumoniae ST258 pulmonary infection. JCI Insight 1, e89704. - PMC - PubMed
    1. Andersson DI, and Hughes D (2010). Antibiotic resistance and its cost: is it possible to reverse resistance? Nat. Rev. Microbiol 8, 260–271. - PubMed
    1. Bachman MA, Breen P, Deornellas V, Mu Q, Zhao L, Wu W, Cavalcoli JD, and Mobley HL (2015). Genome-Wide Identification of Klebsiella pneumoniae Fitness Genes during Lung Infection. MBio 6, e00775. - PMC - PubMed
    1. Bera A, Biswas R, Herbert S, and Götz F (2006). The presence of peptidoglycan O-acetyltransferase in various staphylococcal species correlates with lysozyme resistance and pathogenicity. Infect. Immun 74, 4598–4604. - PMC - PubMed
    1. Blin C, Passet V, Touchon M, Rocha EPC, and Brisse S (2017). Metabolic diversity of the emerging pathogenic lineages of Klebsiella pneumoniae. Environ. Microbiol 19, 1881–1898. - PubMed

Publication types

MeSH terms