. 2021 Jun 1;35(9):109185.
doi: 10.1016/j.celrep.2021.109185.

Mineralocorticoid receptors dampen glucocorticoid receptor sensitivity to stress via regulation of FKBP5

Affiliations

Mineralocorticoid receptors dampen glucocorticoid receptor sensitivity to stress via regulation of FKBP5

Jakob Hartmann et al. Cell Rep. .

Abstract

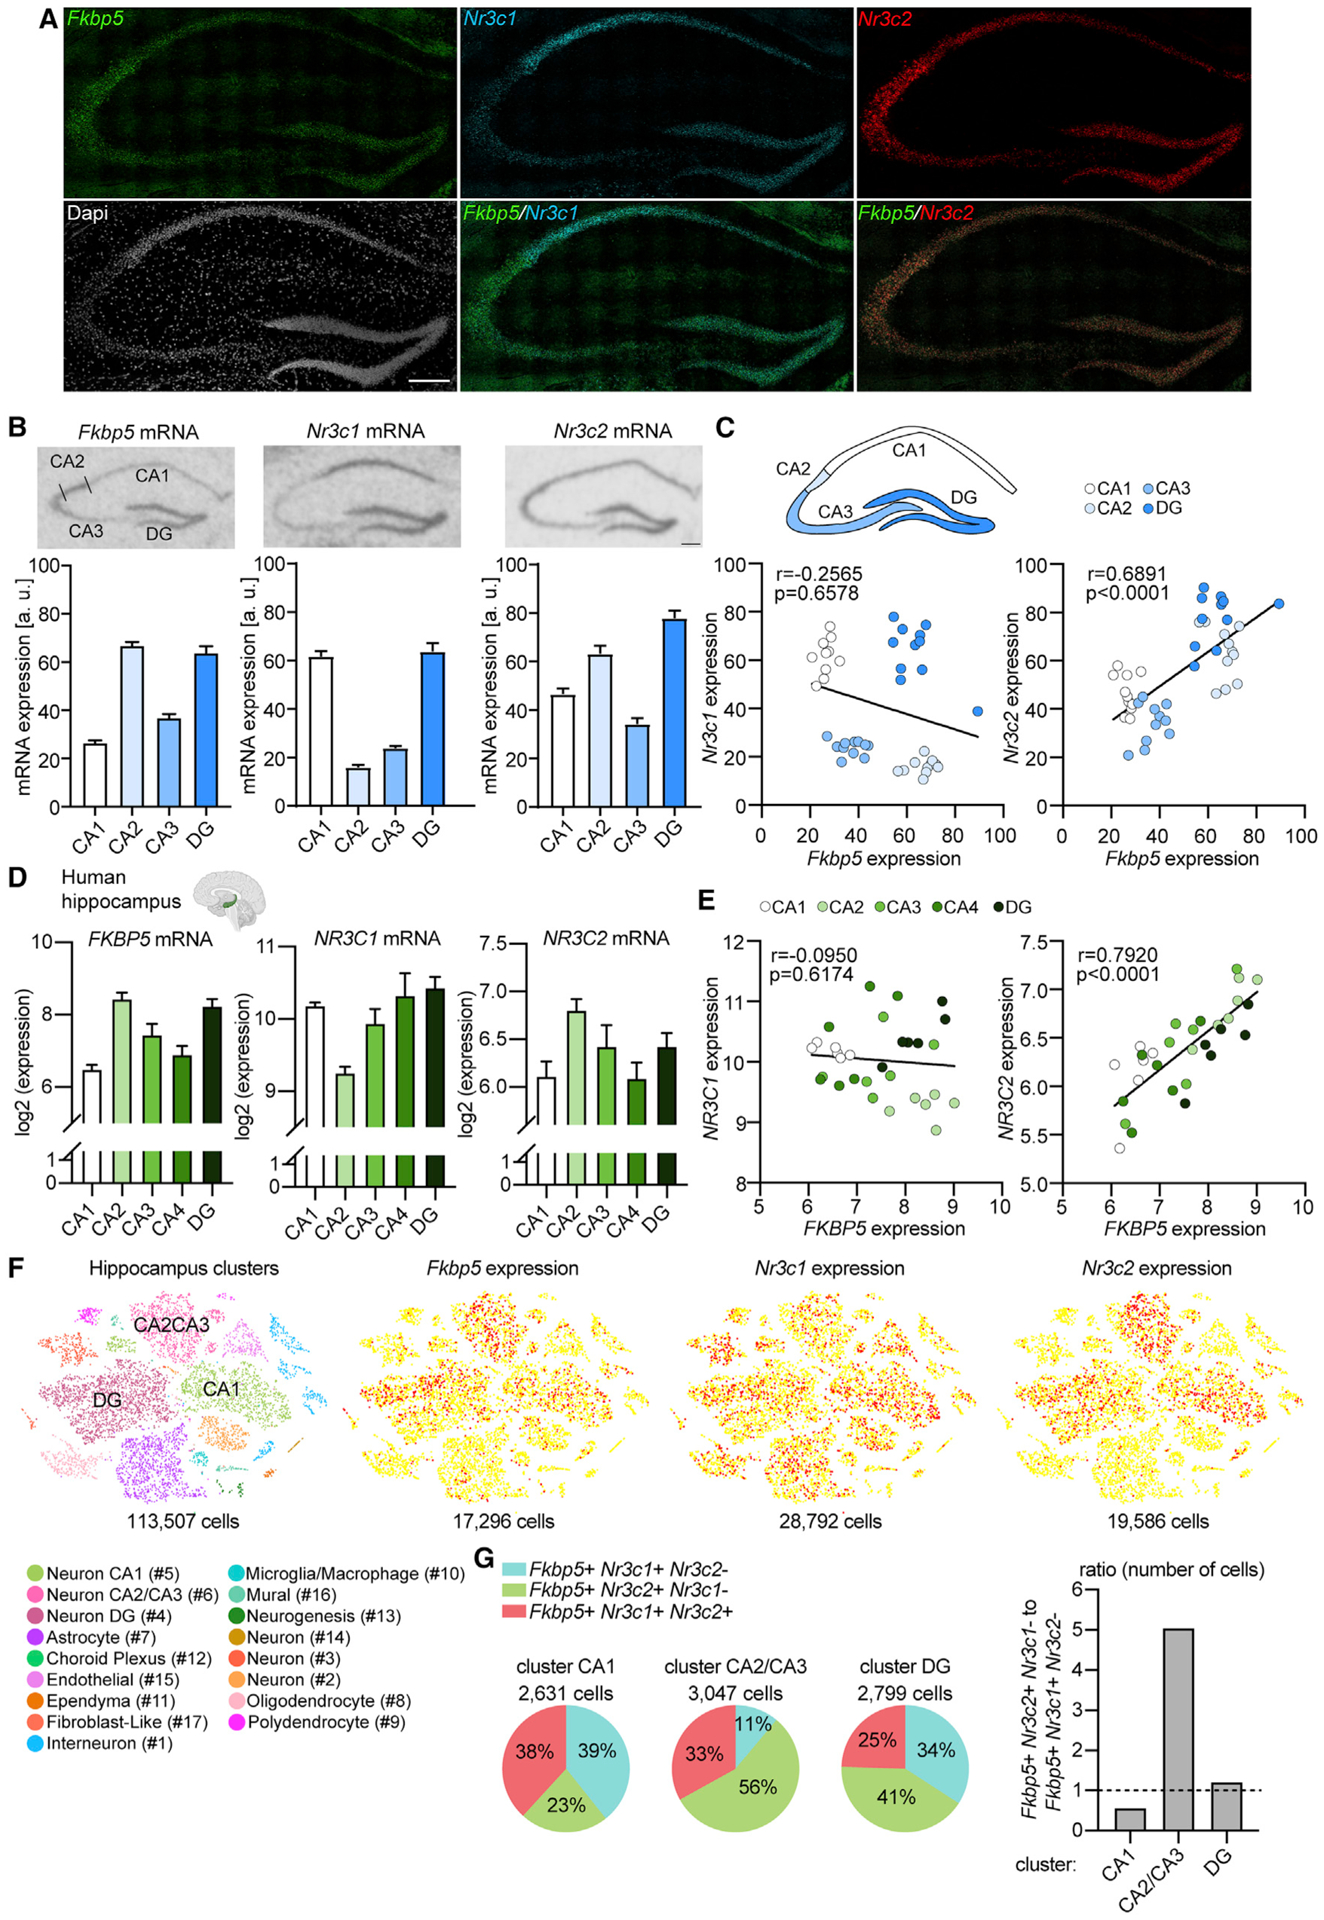
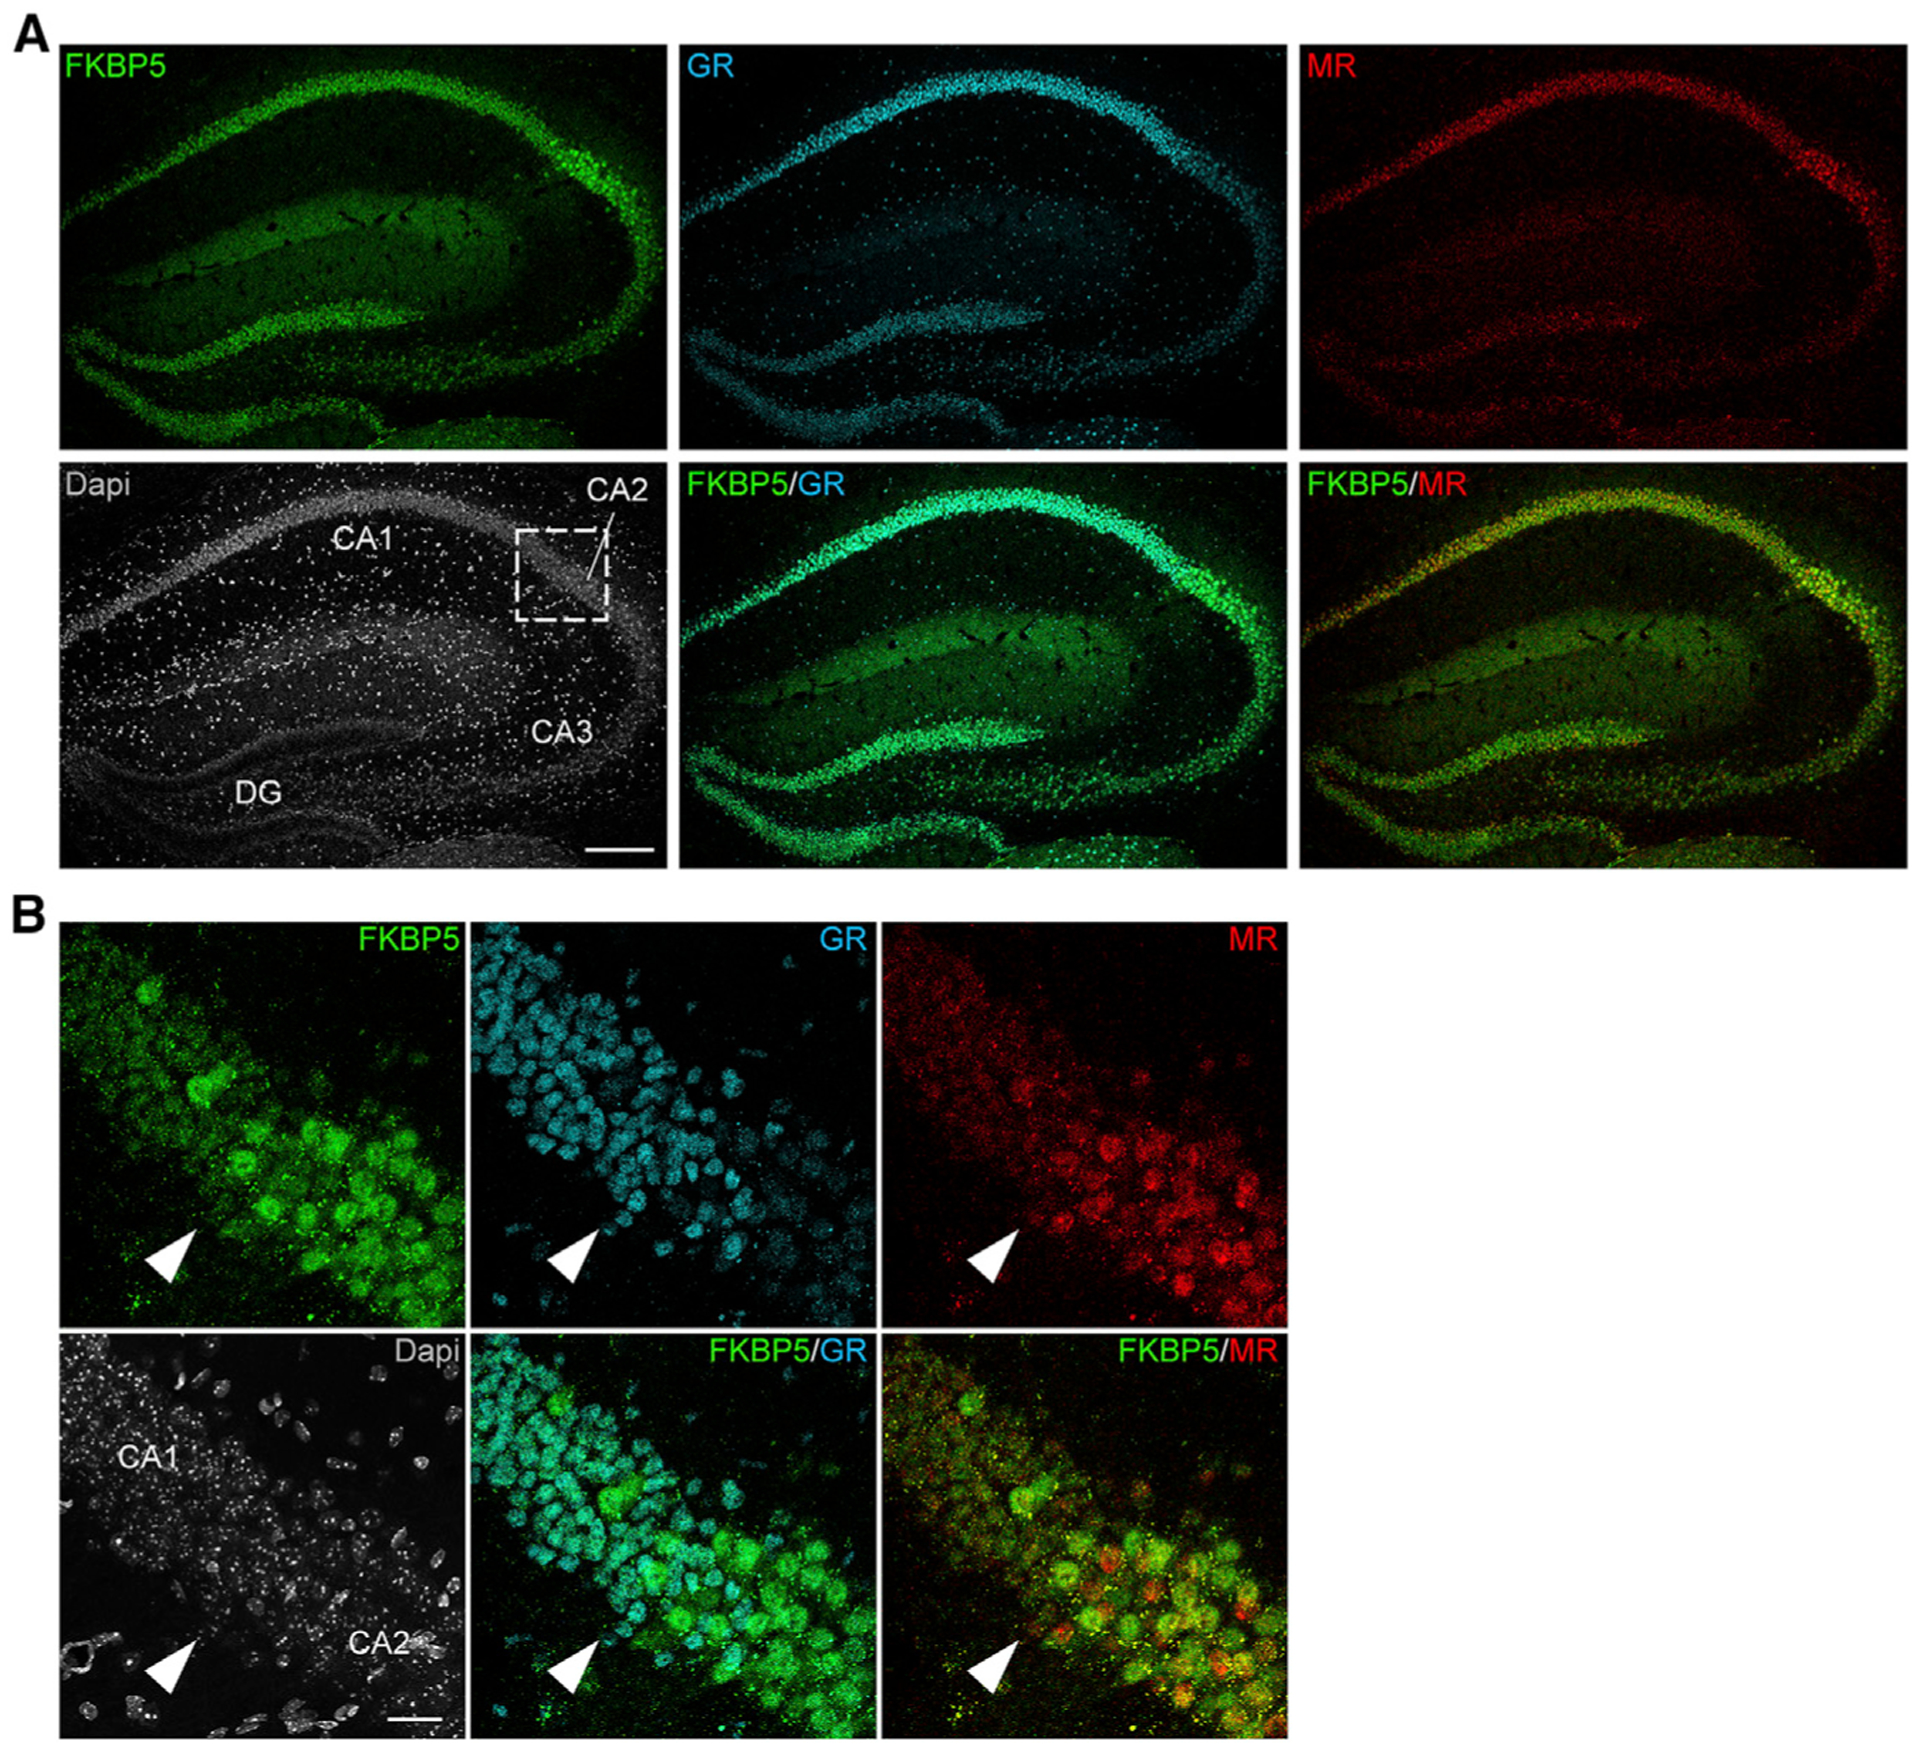
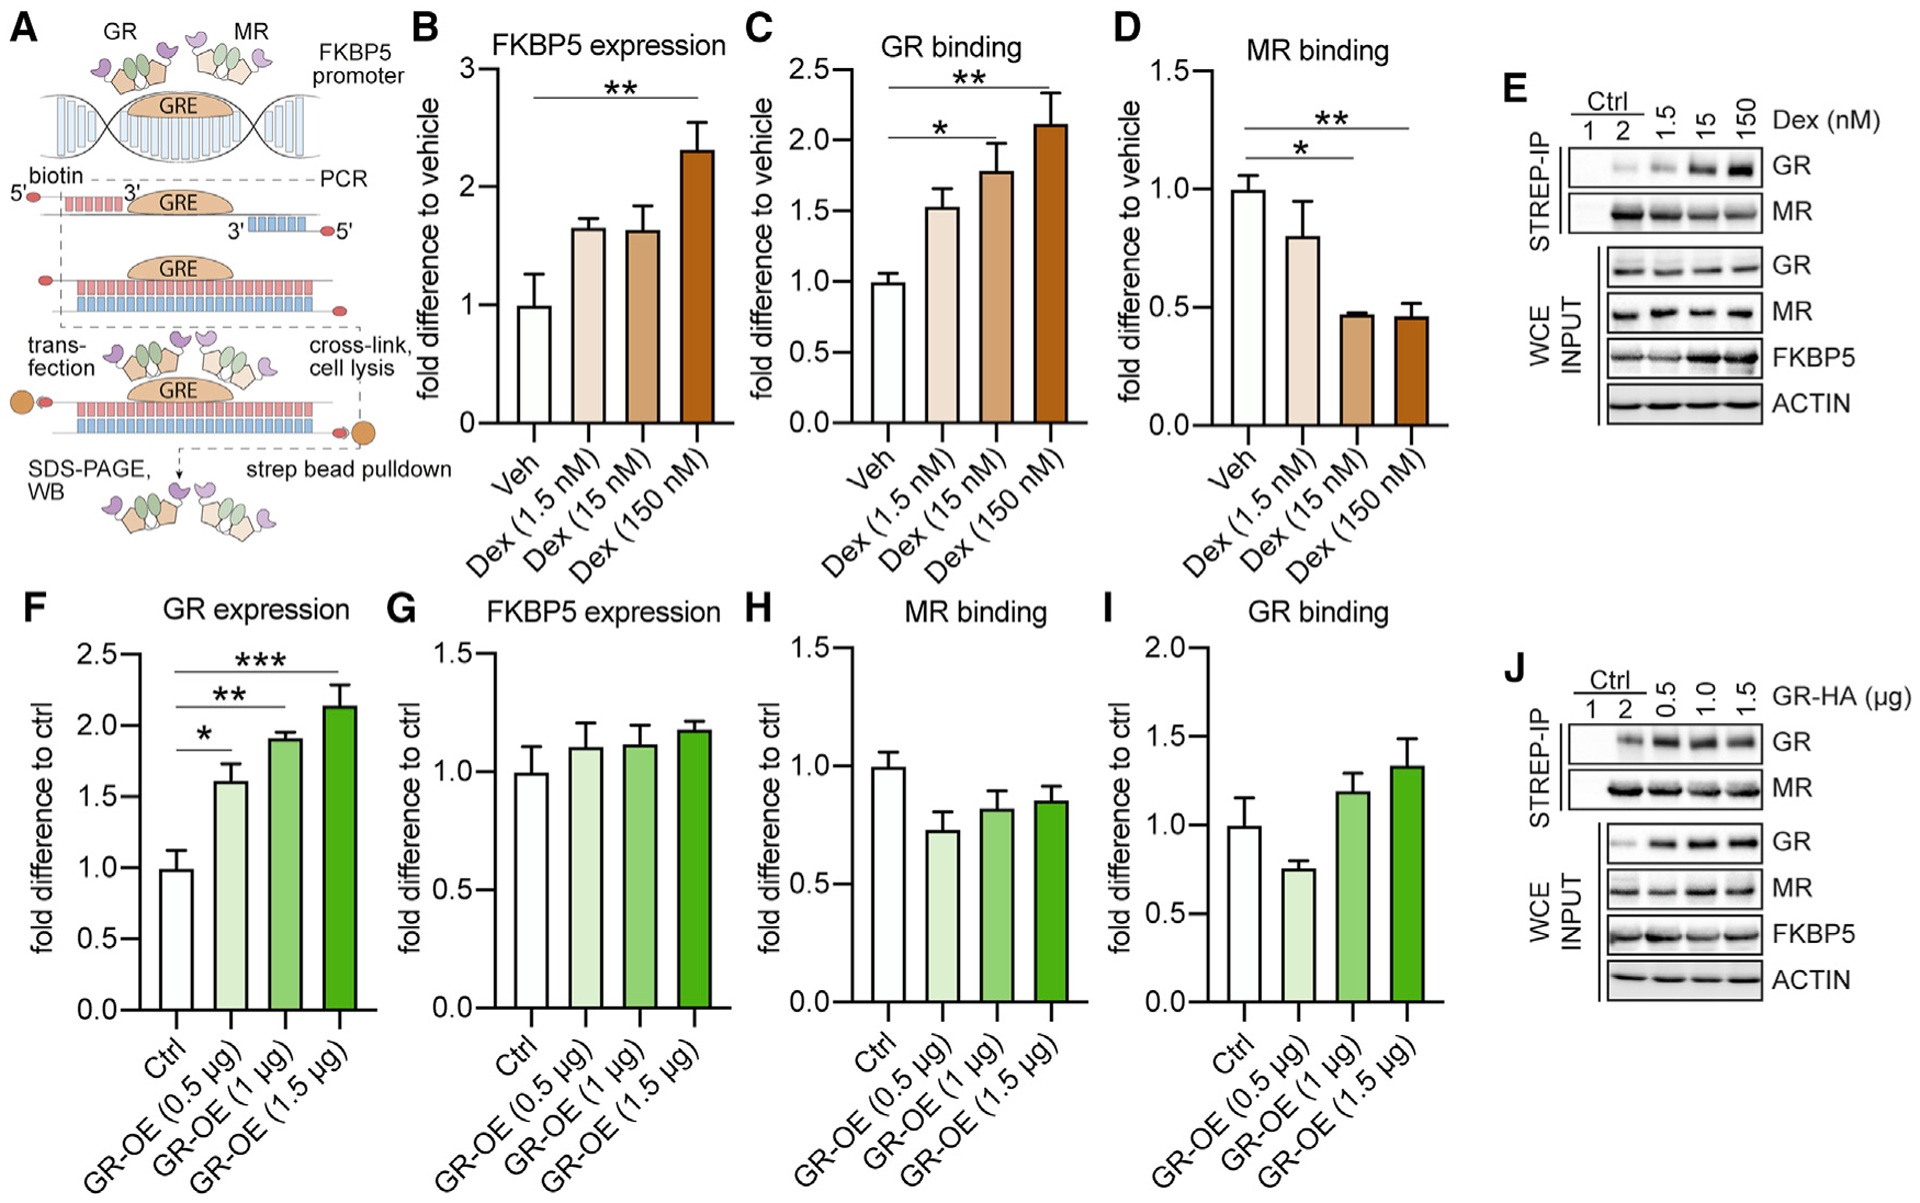
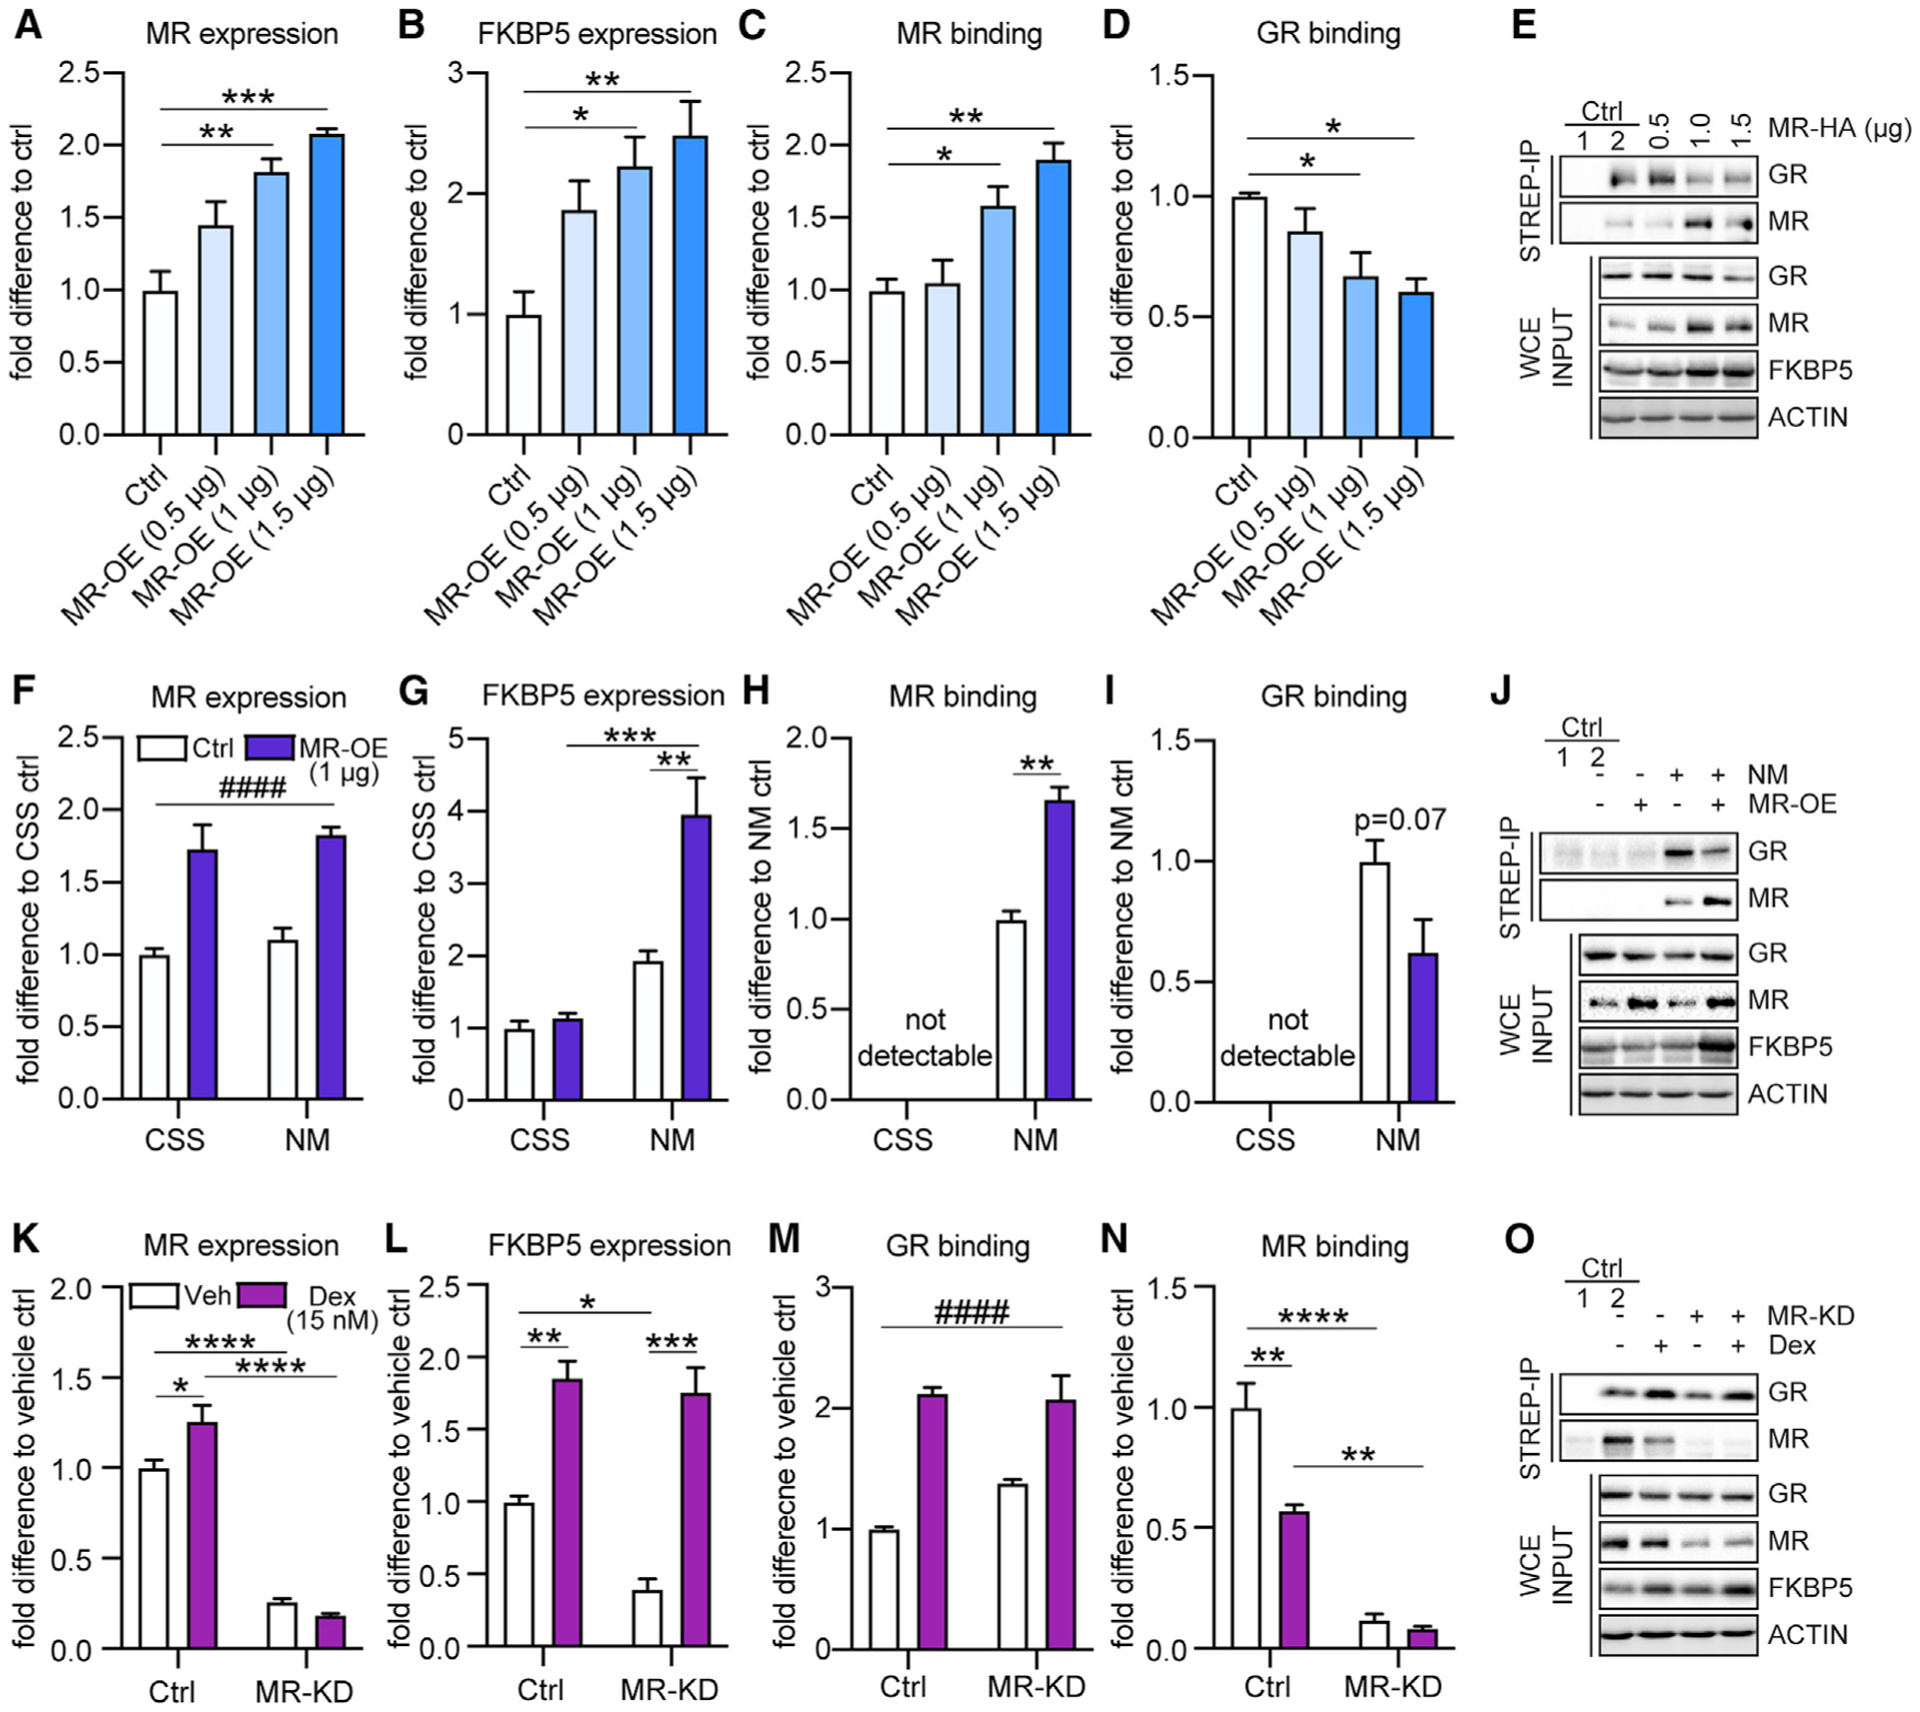
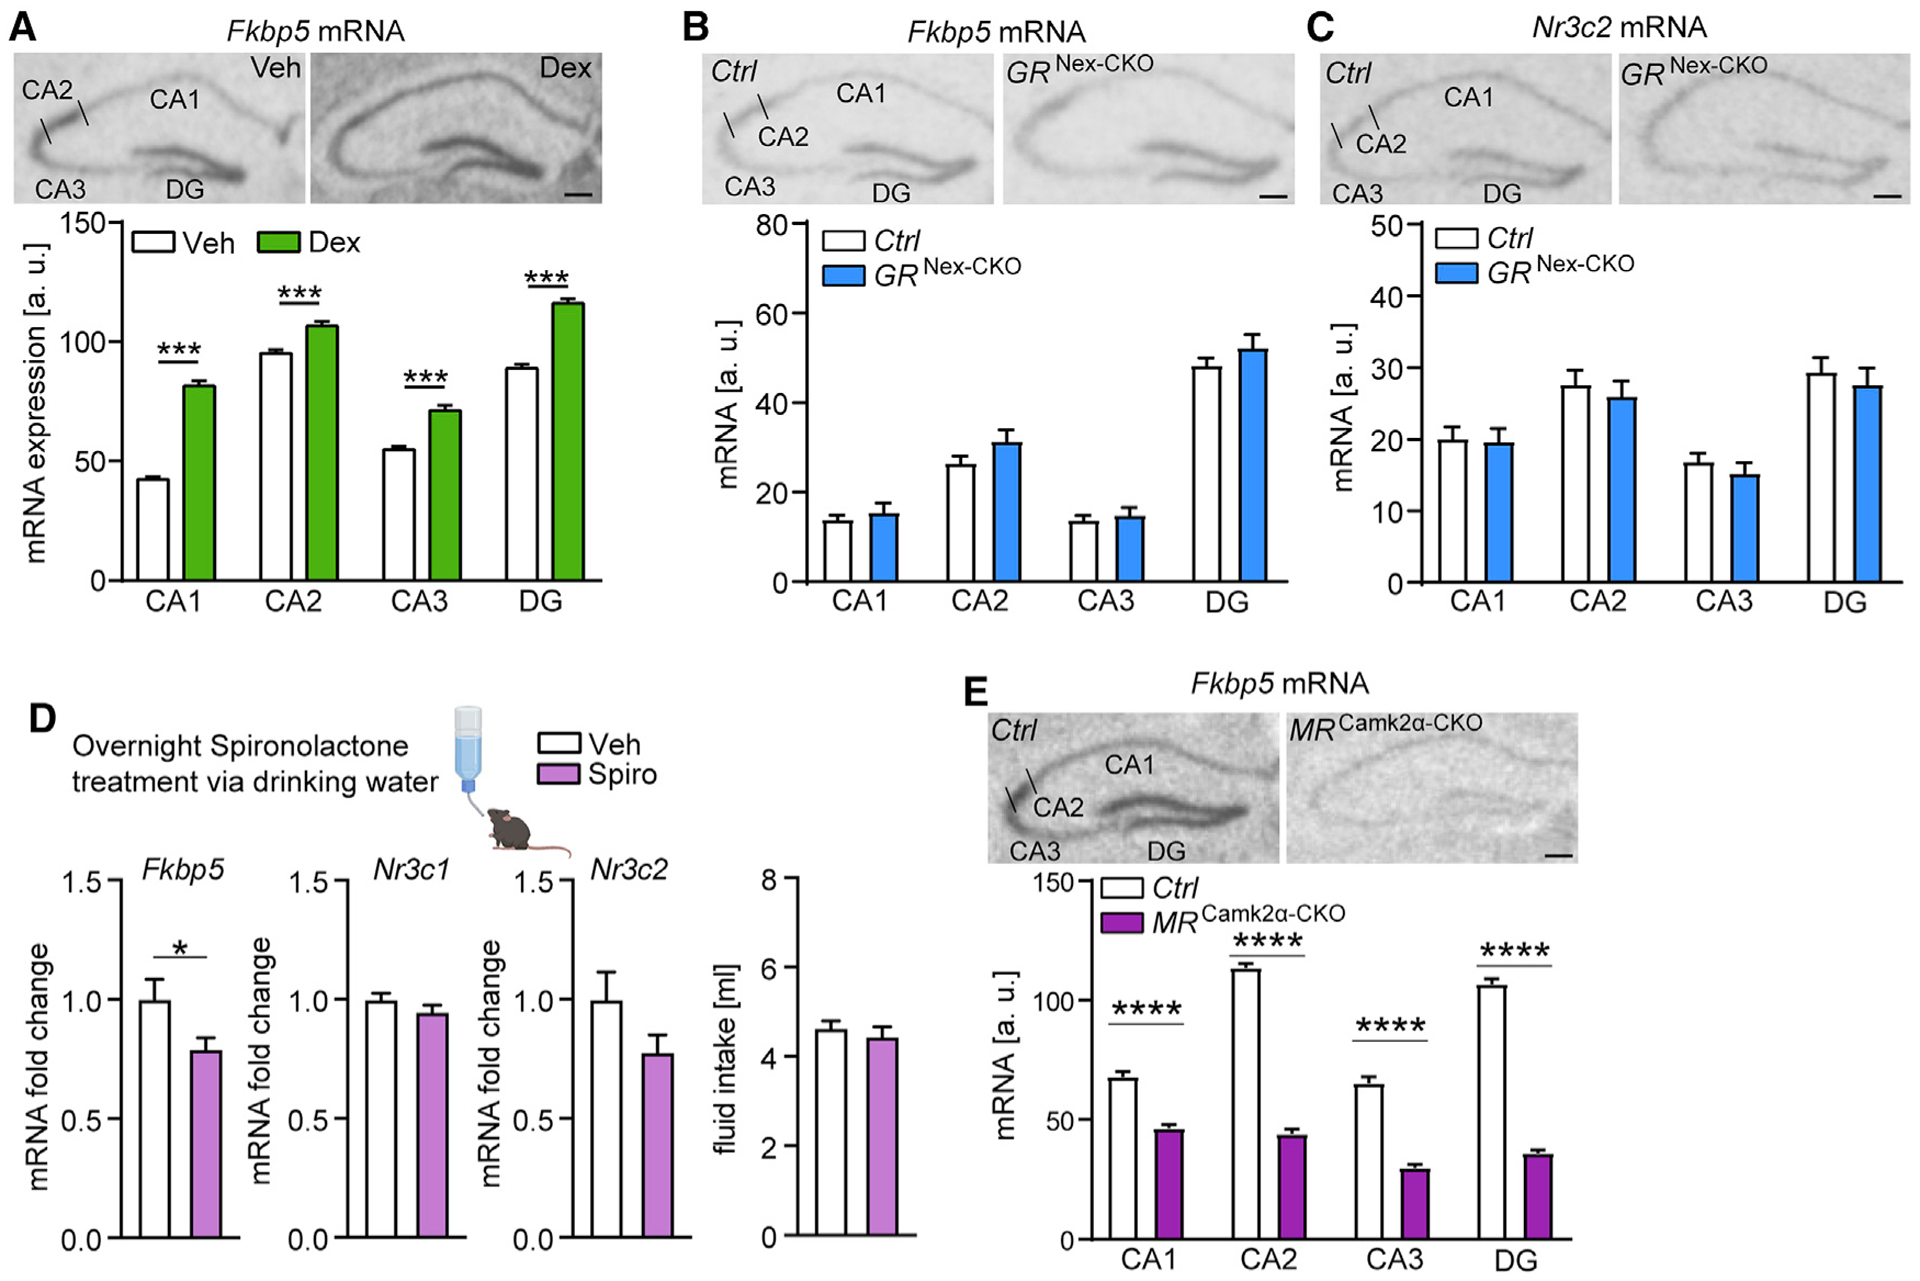
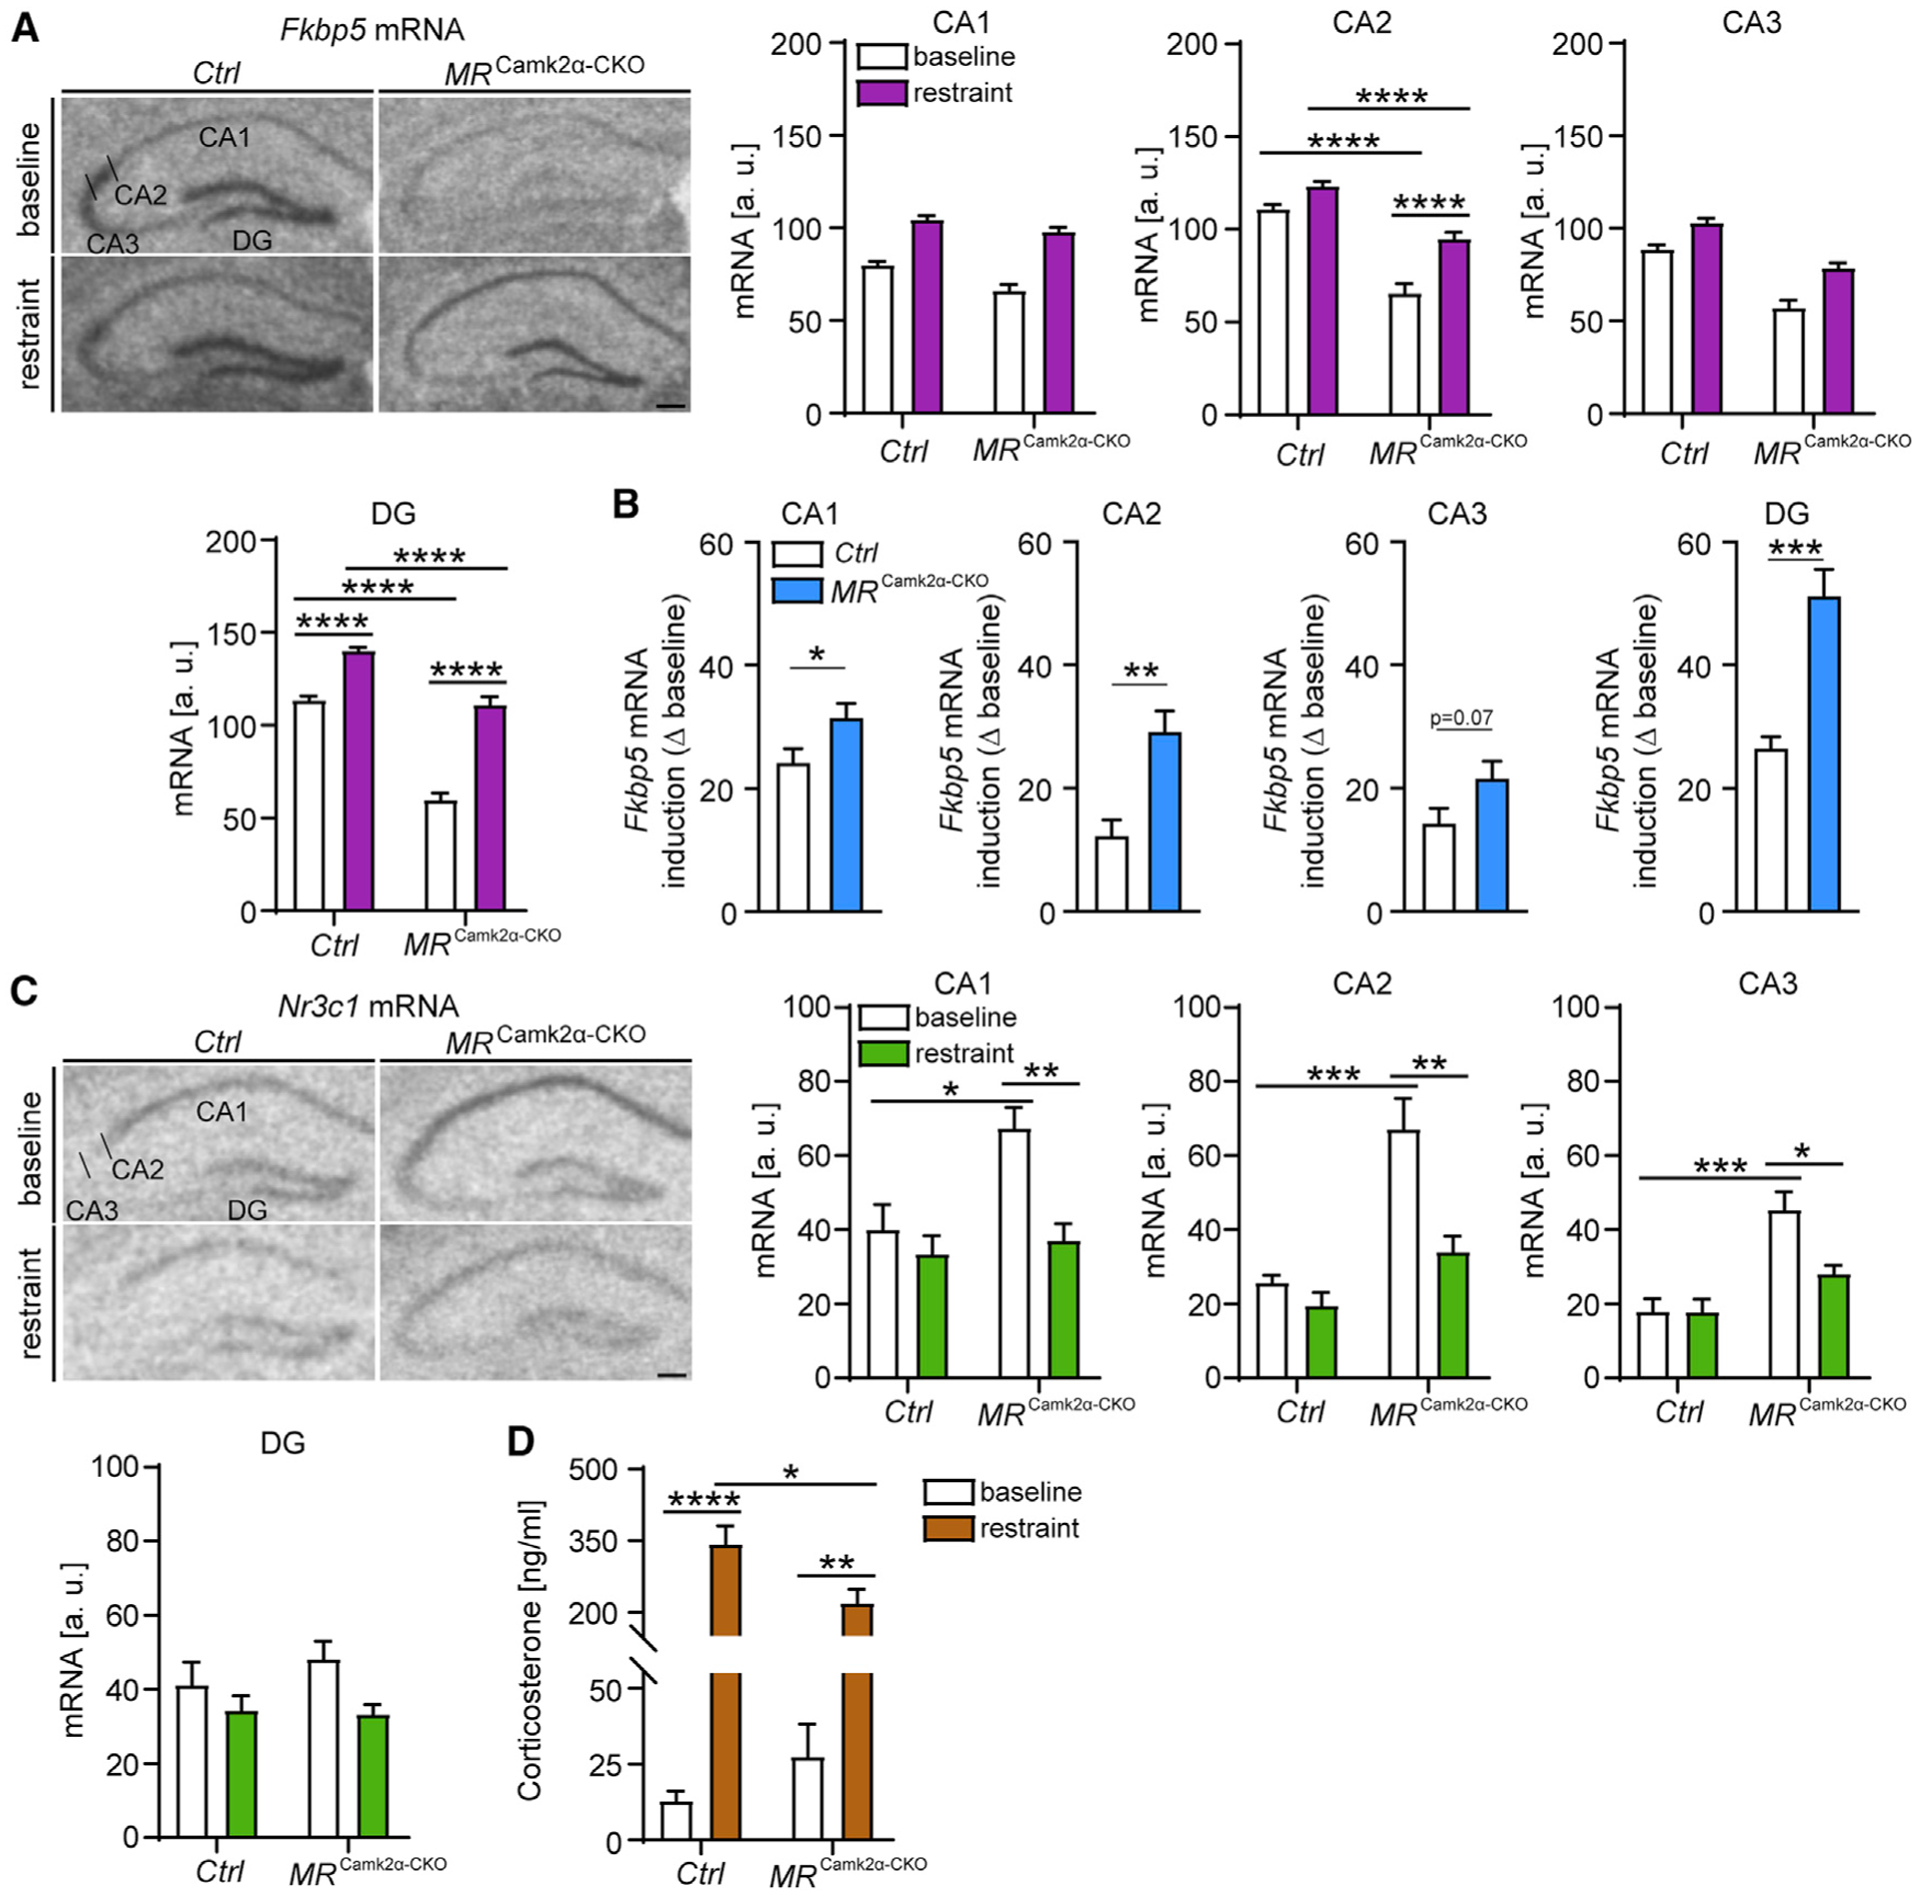
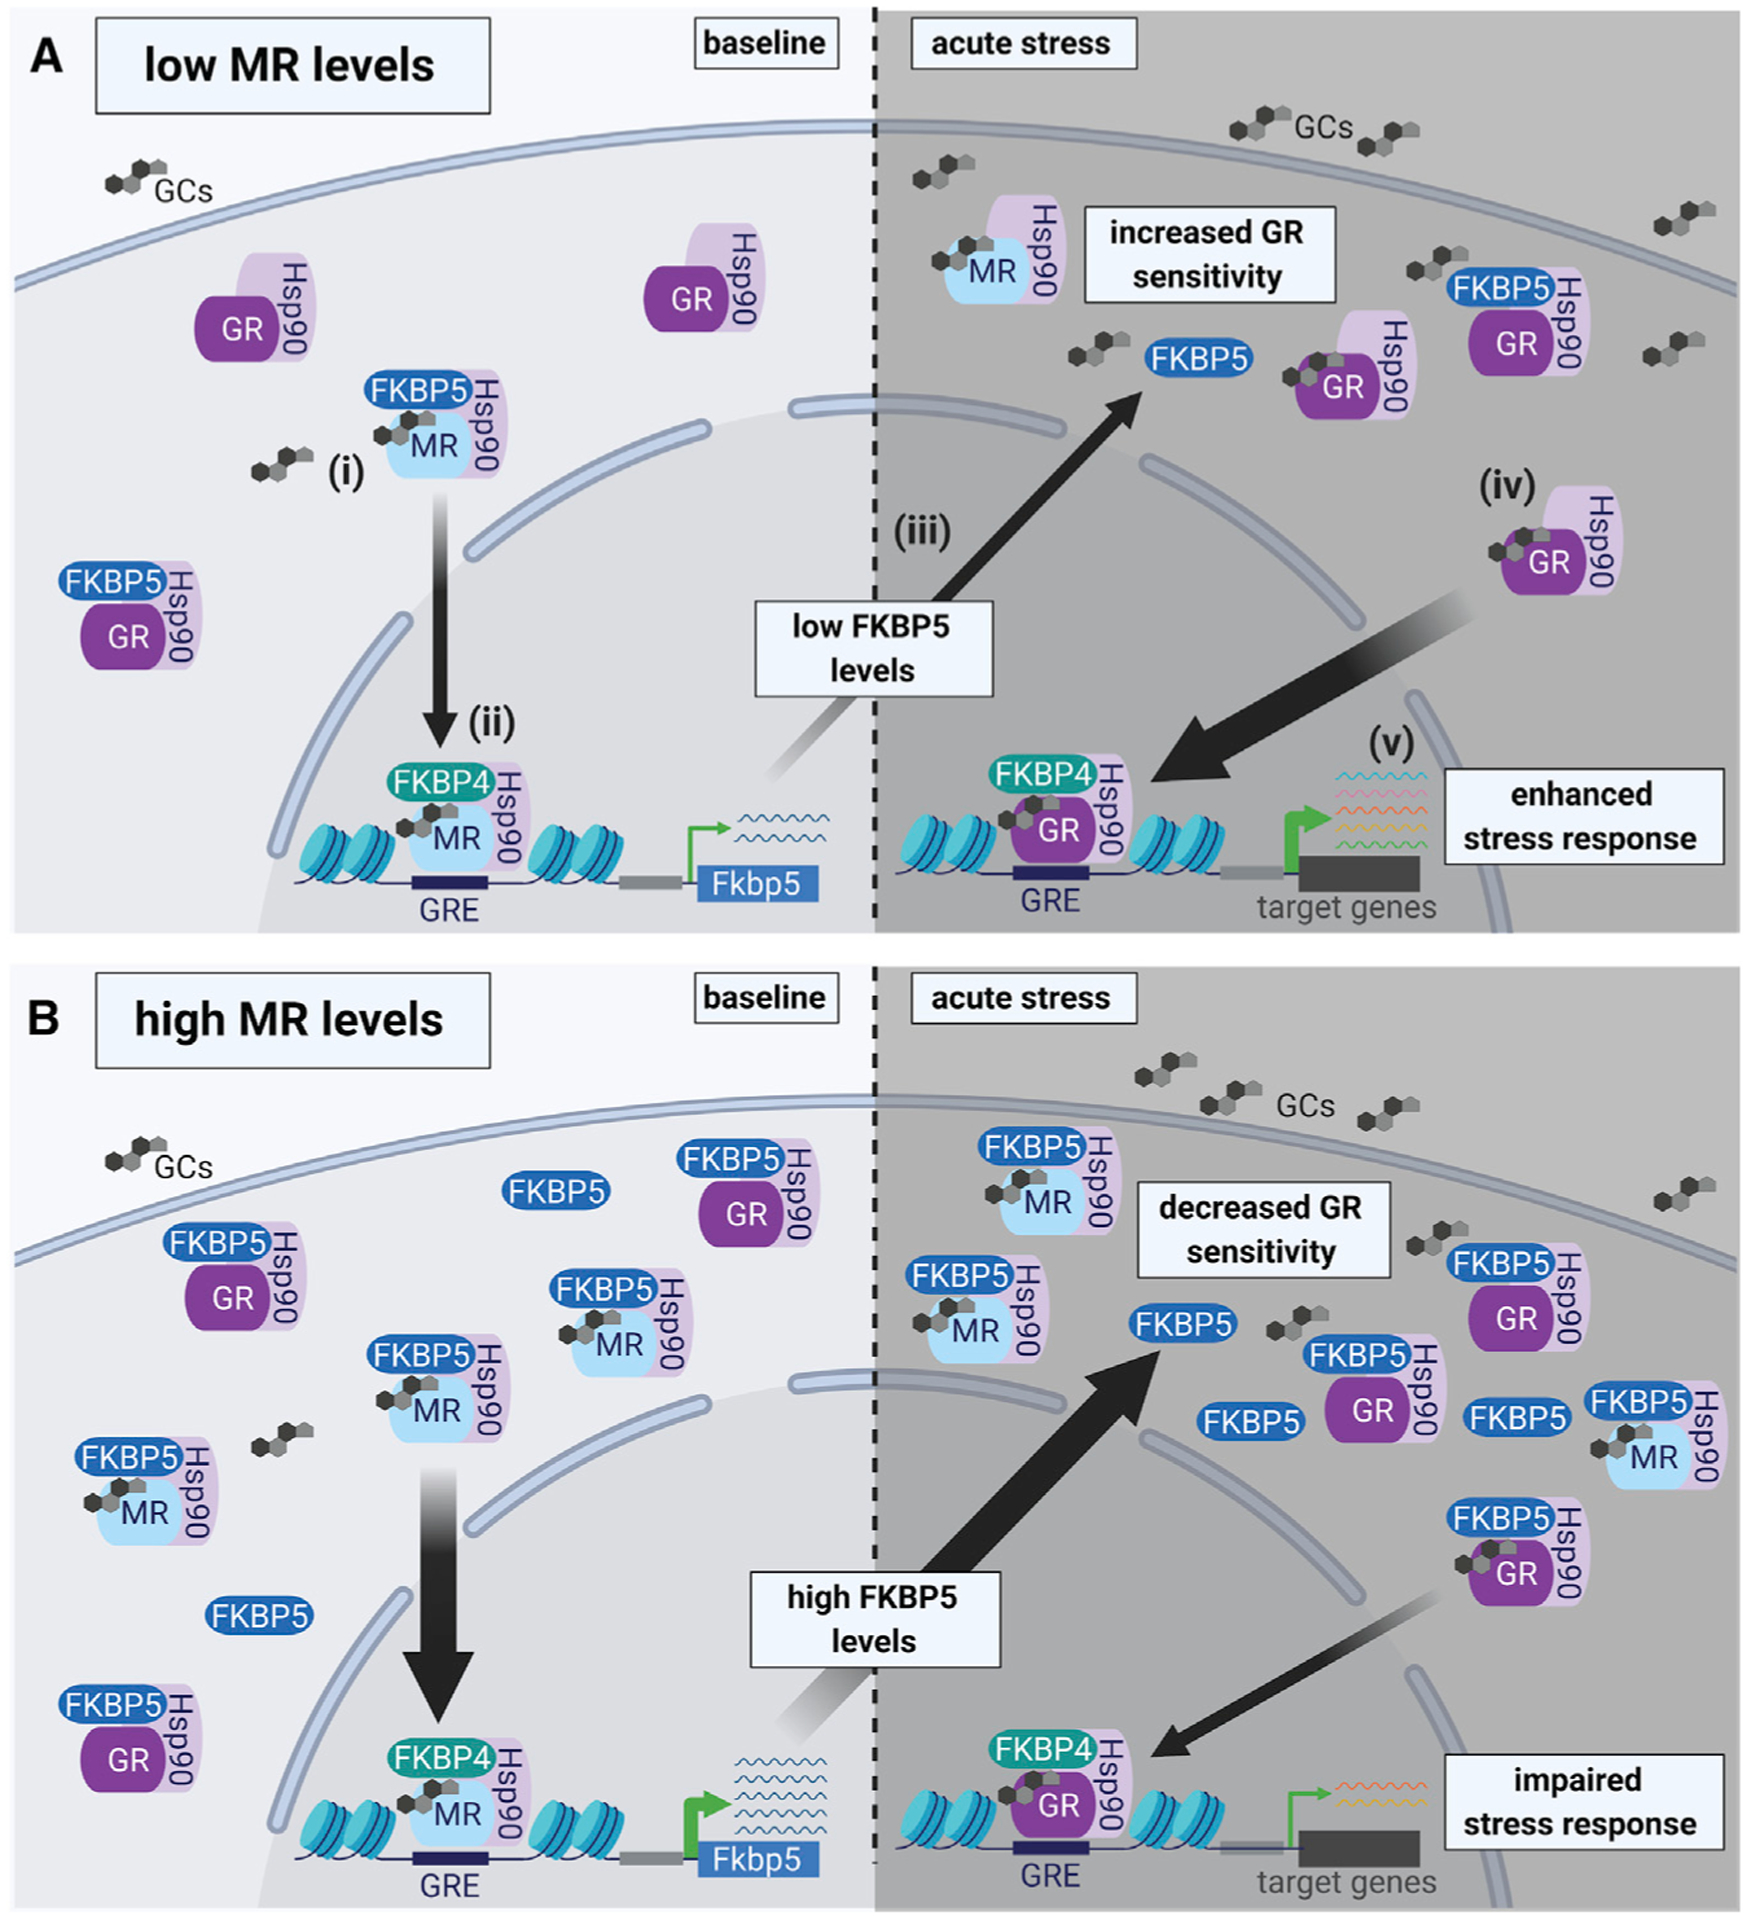
Responding to different dynamic levels of stress is critical for mammalian survival. Disruption of mineralocorticoid receptor (MR) and glucocorticoid receptor (GR) signaling is proposed to underlie hypothalamic-pituitary-adrenal (HPA) axis dysregulation observed in stress-related psychiatric disorders. In this study, we show that FK506-binding protein 51 (FKBP5) plays a critical role in fine-tuning MR:GR balance in the hippocampus. Biotinylated-oligonucleotide immunoprecipitation in primary hippocampal neurons reveals that MR binding, rather than GR binding, to the Fkbp5 gene regulates FKBP5 expression during baseline activity of glucocorticoids. Notably, FKBP5 and MR exhibit similar hippocampal expression patterns in mice and humans, which are distinct from that of the GR. Pharmacological inhibition and region- and cell type-specific receptor deletion in mice further demonstrate that lack of MR decreases hippocampal Fkbp5 levels and dampens the stress-induced increase in glucocorticoid levels. Overall, our findings demonstrate that MR-dependent changes in baseline Fkbp5 expression modify GR sensitivity to glucocorticoids, providing insight into mechanisms of stress homeostasis.

Keywords: FKBP5; GR; HPA axis; MR; MR:GR balance; PTSD; hippocampus; major depression disorder; posttraumatic stress disorder; stress.


Conflict of interest statement

Declaration of interests N.D. is currently an employee of Sunovion Pharmaceuticals. K.M.M. is currently an employee of Encoded Therapeutics Inc. N.P.D. has served as a paid consultant for Sunovion Pharmaceuticals and is on the scientific advisory board for Sentio Solutions, Inc. for unrelated work. K.J.R. has received consulting income from Alkermes and Bio X Cell and is on scientific advisory boards for Janssen and Verily for unrelated work. He has also received a sponsored research grant support from Takeda, Alto Neuroscience, and Brainsway for unrelated work. T.K. has received consulting income from Alkermes for unrelated work. The remaining authors declare no competing interests.

Figures

Figure 1.
Figure 1.. Fkbp5, Nr3c1, and Nr3c2 mRNA expression patterns in the human and mouse hippocampus
(A) Fkbp5, Nr3c1, and Nr3c2 mRNA expression in the mouse hippocampus determined by RNAscope. Fkbp5 mRNA (green) and Nr3c2 mRNA (red) are strongly expressed in CA2 and dentate gyrus (DG). Nr3c1 mRNA (cyan) is prominently expressed in CA1 and DG. DAPI stain (gray) shows area examined. Overlay of Fkbp5 and Nr3c2 reveals strong overlap in expression of Fkbp5 and Nr3c2 specifically in the CA2. Fkbp5 and Nr3c1 expression does not show a high a degree of overlap in the CA1, CA2, or CA3. n = 4 mice. Scale bar, 250 μm. (B) Hippocampal Fkbp5, Nr3c1 (glucocorticoid receptor [GR]), and Nr3c2 (mineralocorticoid receptor [MR]) mRNA expression determined by in situ hybridization (ISH) in C57BL/6J mice. Fkbp5 and Nr3c2 exhibit similar expression patterns in the hippocampus, which is distinct from that of Nr3c1. (Top panel) Representative autoradiographs of hippocampal Fkbp5, Nr3c1, and Nr3c2 mRNA expression. (Lower panel) Quantified expression of Fkbp5, Nr3c1, and Nr3c2 mRNA. Areas of interest are CA1, CA2, CA3, and DG. n = 11 mice. Scale bar, 250 μm. (C) Correlation of Fkbp5 and Nr3c1 (left; Pearson correlation coefficient, r = −0.2565, p = 0.6578) or Nr3c2 (right; r = 0.6891, p < 0.0001) mRNA levels in hippocampal subregions CA1, CA2, CA3, and DG. Each dot represents the levels of Fkbp5 and the respective receptor in the same mouse. (D) Microarray data from the Allen Brain Institute (Hawrylycz et al., 2012) showing FKBP5, NR3C1, and NR3C2 mRNA expression in human hippocampal subregions CA1, CA2, CA3, CA4, and DG. n = 6 subjects (see also Table S1). (E) Correlation of FKBP5 and NR3C1 (left; Pearson correlation coefficient, r = −0.0950, p = 0.6174) or NR3C2 (right; r = 0.7920, p < 0.0001) mRNA levels in human hippocampal subregions CA1, CA2, CA3, CA4, and DG. Each dot represents the levels of FKBP5 and the respective receptor in one individual. (F) Single-cell RNA sequencing data (Saunders et al., 2018) of the mouse hippocampus (n = 113,507 cells) depicts several different cell types (left) and the expression plots for Fkbp5, Nr3c1, and Nr3c2. (G) Percentage of Fkbp5-positive cells expressing either only Nr3c1, only Nr3c2, or both receptors in individual neuronal clusters CA1, CA2/CA3, and DG (left). (Right) Ratio of the number of cells expressing Fkbp5 and only Nr3c2 to cells expressing Fkbp5 and only Nr3c1 in neuronal clusters CA1, CA2/CA3, and DG (Yates’ chi-square = 854.177; p < 2.2e–16). Data are presented as mean + SEM.
Figure 2.
Figure 2.. FKBP5, GR, and MR protein expression patterns in the mouse hippocampus
(A) Coronal sections of C57BL/6J mice (n = 5) were stained for FKBP5 (FK506-binding protein 51), GR, and MR protein as well as DAPI (4′,6-diamidino-2-phenylindole). FKBP5 and MR exhibit similar expression patterns in the hippocampus, which is distinct from that of the GR. Scale bar, 250 μm. (B) Higher magnification images of the approximate CA1–CA2 boundary (white arrow) in the hippocampus. FKBP5 and MR expression is most prominent in hippocampal subregion CA2, whereas GR expression is strongly expressed in the CA1. Scale bar, 25 μm. See also Figure S1.
Figure 3.
Figure 3.. GRs regulate FKBP5 expression under Dex-stimulated, but not under baseline, conditions in mouse primary hippocampal neurons
The effects of altered GR levels on FKBP5 expression and on MR and GR binding to two Fkbp5-glucocorticoid response elements (GREs) were examined under baseline conditions and following dexamethasone (Dex) stimulation in primary hippocampal neurons, using biotinylated oligonucleotide immunoprecipitation (oligoIP). (A) Schematic summary of the experimental setup. After oligoIP, MR and GR binding to the Fkbp5-GRE oligonucleotide were quantified by western blotting using antibodies specific for the respective receptor. In addition, FKBP5, MR, or GR expression levels were quantified by western blotting from whole-cell extracts (WCEs). (B) Dex treatment increased FKBP5 levels in a concentration-dependent manner (F3,8 = 7.278, p < 0.05). (C and D) GR binding to the Fkbp5-GRE oligonucleotide was increased following Dex treatment (F3,8 = 8.9, p < 0.01), while MR binding was decreased (F3,8 = 10.35, p < 0.01). (E) Example blots of (B)–(D). Ctrl (control) 1: magnetic beads lacking conjugated streptavidin. Ctrl 2: cells treated with vehicle (Veh). (F) Transfection with a GR-expressing plasmid concentration dependently increased GR protein expression (F3,8 = 19.25, p < 0.001). (G–I) FKBP5 expression and MR and GR binding to the Fkbp5-GRE oligonucleotide are not altered following GR overexpression (OE) under baseline conditions. (J) Example blots of (F)–(I). Ctrl 1: magnetic beads lacking conjugated streptavidin. Ctrl 2: cells transfected with empty Ctrl vector. One-way analysis of variance (ANOVA) + Bonferroni post hoc test: *p < 0.05, **p < 0.01, ***p < 0.001. Data are presented as mean + SEM (n = mean derived from three independent experiments).
Figure 4.
Figure 4.. MR drives FKBP5 expression under baseline conditions, which fine-tunes GR stress responsiveness in mouse primary hippocampal neurons
The effects of altered MR levels on FKBP5 expression as well as on receptor binding to GREs within Fkbp5’s promoter region were examined under baseline conditions, in medium supplemented with charcoal-stripped serum (CSS, steroid-free; resulting in no receptor activation) and following Dex stimulation using biotinylated oligoIP in primary hippocampal neurons. (A) Transfection of a MR-expressing plasmid concentration dependently increased MR protein expression (F3,8 = 18.30, p < 0.001). (B–D) Under baseline conditions, OE of MR significantly increased FKBP5 expression (F3,8 = 7.578, p < 0.01) as well as MR binding to the Fkbp5-GRE oligonucleotide (F3,8 = 12.98, p < 0.01), while GR binding was decreased (F3,8 = 6.461, p < 0.05). (E) Example blots of (A)–(D). Ctrl 1: magnetic beads lacking conjugated streptavidin. Ctrl 2: cells transfected with empty Ctrl vector. (F–I) Only under normal media (NM) conditions, OE of MR (main treatment effect F1,8 = 57.60, p < 0.0001) significantly increased FKBP5 expression (treatment-by-condition interaction F1,8 = 12.71, p < 0.01) as well as MR binding to the Fkbp5-GRE oligonucleotide (t4 = 8.241, p < 0.01), while GR binding was decreased (t4 = 2.351, p = 0.07). These effects were abolished in neurons cultured in medium supplemented with CSS. (J) Example blots of (F)–(I). Ctrl 1: magnetic beads lacking conjugated streptavidin. Ctrl 2: cells transfected with empty Ctrl vector. (K) Knockdown (KD) of MR led to significantly reduced MR expression under vehicle (Veh) and Dex conditions. In addition, Dex treatment increased MR expression under control conditions (treatment-by-condition interaction F1,8 = 11.71, p < 0.01). (L) MR KD significantly reduced FKBP5 expression under vehicle conditions. In contrast, Dex treatment significantly increased FKBP5 expression, which was even more pronounced under MR KD conditions (treatment-by-condition interaction F1,8 = 5.168, p < 0.05). (M) Dex treatment significantly increased GR binding to the Fkbp5-GRE oligonucleotide independent of MR expression (main treatment effect F1,8 = 83.18, p < 0.0001). (N) KD of MR significantly decreased MR binding to the Fkbp5-GRE oligonucleotide. MR binding was significantly decreased following Dex treatment under control conditions (treatment-by-condition interaction F1,8 = 14.34, p < 0.01). (O) Example blots of (K)–(N). Ctrl 1: magnetic beads lacking conjugated streptavidin. Ctrl 2: vehicle treated cells transfected with scrambled small interfering RNA (scr-siRNA) Ctrl vector. One-way ANOVA + Bonferroni post hoc test, two-way ANOVA + Bonferroni post hoc test, and unpaired, two-tailed Student’s t test for simple comparisons: *p < 0.05, **p < 0.01, ***p < 0.001, ****p < 0.0001; ####p < 0.0001 (two-way ANOVA main treatment effect). Data are presented as mean + SEM; n = mean of three independent experiments.
Figure 5.
Figure 5.. Basal Fkpb5 mRNA levels in the hippocampus are regulated by the MR
(A) GR activation (Dex injection) leads to increased hippocampal Fkbp5 mRNA expression in C57BL/6J mice determined by ISH. (Top panel) Representative autoradiographs of hippocampal Fkbp5 mRNA expression. (Lower panel) Quantified expression of Fkbp5 mRNA (treatment-by-subregion interaction F3,180 = 25.72, p < 0.0001; n = 23–24 mice per group). (B and C) No alterations in hippocampal Fkbp5 (B) and Nr3c2 (C) mRNA expression in glutamatergic GR knockout mice (n = 9–11 mice per group). (Top panel) Representative autoradiographs of hippocampal Fkbp5 or Nr3c2 mRNA expression determined by ISH. (Lower panel) Quantified expression of Fkbp5 or Nr3c2 mRNA. (D) Fkbp5 mRNA expression is decreased in the hippocampus of C57BL/6J mice following overnight treatment with the MR antagonist spironolactone (Fkbp5, t19 = 2.108, p < 0.05; n = 10–11 mice per group), while Nr3c1 and Nr3c2 mRNA levels are not altered. Overnight fluid intake did not differ between vehicle- and spironolactone-treated mice. (E) MR deletion in forebrain neurons (MRCamk2α-CKO) leads to lower hippocampal Fkbp5 mRNA expression determined by ISH (genotype-by-hippocampal subregion interaction F3,88 = 77.2, p < 0.0001; n = 10–14 mice per group). (Top panel) Representative autoradiographs of hippocampal Fkbp5 mRNA expression. (Lower panel) Quantified expression of Fkbp5 mRNA. Areas of interest are CA1, CA2, CA3, and DG. Two-way ANOVA + Bonferroni post hoc test and unpaired, two-tailed Student’s t test for simple comparisons: *p < 0.05, ***p < 0.001, ****p < 0.0001. Data are presented as mean + SEM. Scale bars, 250 μm. See also Figures S2 and S3.
Figure 6.
Figure 6.. Forebrain-specific MR deletion leads to GR hypersensitivity during the acute stress response
(A) (Left) Representative autoradiographs of hippocampal Fkbp5 mRNA expression in MRCamk2α-CKO mice. CA1, CA2, CA3, and DG show quantified expression of Fkbp5 mRNA. Fkbp5 levels are decreased in the CA1, CA2, CA3, and DG of conditional forebrain MR knockout mice. 4 h of restraint stress increases Fkbp5 expression in the hippocampus, which is even more pronounced in MRCamk2α-CKO mice (CA1: main condition effect, F1,21 = 137.8, p < 0.0001; main genotype effect, F1,21 = 18.03, p < 0.001; CA2: genotype-by-condition interaction, F1,21 = 6.183, p < 0.05; CA3: main condition effect, F1,21 = 36.71, p < 0.0001; main genotype effect, F1,21 = 88.06, p < 0.0001; DG: genotype-by-condition interaction, F1,21 = 16.5, p < 0.001). (B) The induction of Fkbp5 mRNA by 4-h restraint stress (delta to baseline) in CA1, CA2, and DG of MRCamk2α-CKO mice is increased compared to littermate controls (CA1, t11 = 2.315, p < 0.05; CA2, t11 = 4.179, p < 0.01; CA3, t11 = 2.01, p = 0.07; DG, t11 = 5.717, p < 0.0001). (C) (Left) Representative autoradiographs of hippocampal Nr3c1 mRNA expression in MRCamk2α-CKO mice. CA1, CA2, CA3, and DG show quantified expression of Nr3c1 mRNA. Nr3c1 levels are increased in the CA1, CA2, and CA3 of conditional forebrain MR knockout mice under baseline conditions. In contrast, 4 h of restraint stress decreases Nr3c1 expression in the hippocampus of MRCamk2α-CKO mice, while no changes are observed in littermate controls (CA1: genotype-by-condition interaction, F1,19 = 4.794, p < 0.05; CA2: genotype-by-condition interaction, F1,19 = 6.144, p < 0.05; CA3: genotype-by-condition interaction, F1,19 = 5.399, p < 0.05). No significant changes in Nr3c1 mRNA expression were observed in the DG. (D) 4 h of restraint stress leads to increased corticosterone levels, an effect that is significantly blunted in in MRCamk2α-CKO mice (genotype-by-condition interaction, F1,19 = 6.228, p < 0.05). Two-way ANOVA + Bonferroni post hoc test and unpaired, two-tailed Student’s t test for simple comparisons: *p < 0.05, **p < 0.01, ***p < 0.001, ****p < 0.0001. Data are presented as mean + SEM; n = 4–7 mice per group. Scale bars, 250 μm.
Figure 7.
Figure 7.. Working model of MR-dependent changes in baseline FKBP5 expression that modify GR sensitivity to glucocorticoids and subsequent HPA axis activity
In the hippocampus MRs are largely occupied under basal glucocorticoid conditions, whereas GR occupancy is increased when glucocorticoid levels rise following acute stress. Upon glucocorticoid binding to the MR under baseline conditions (i), FKBP5 is replaced by FKBP4, which promotes the translocation of the MR-Hsp90 complex into the nucleus and subsequent DNA binding (to FKBP5 GREs) (ii). Thereby, the MR increases FKBP5 transcription and translation (iii), which can impact GR sensitivity (iv) and the subsequent stress response during acute stress (v). (A) Low MR levels result in low FKBP5 expression under baseline conditions. In turn, low FKBP5 levels lead to increased GR sensitivity during acute stress, resulting in an enhanced stress response. (B) In contrast, high levels of MR promote increased FKBP5 expression under baseline conditions. High levels of FKBP5 result in decreased GR sensitivity during acute stress, which leads to an impaired stress response. Of note, MRs and GRs can function either as homodimers or heterodimers (de Kloet et al., 2005; Mifsud and Reul, 2016). For simplicity, we did not include homodimers and heterodimers of corticosteroid receptors in this illustration. GCs, glucocorticoids; Hsp90, heat shock protein 90; FKBP4, FK506-binding protein 4.

References

    1. Ahima R, Krozowski Z, and Harlan R (1991). Type I corticosteroid receptor-like immunoreactivity in the rat CNS: Distribution and regulation by corticosteroids. J. Comp. Neurol 313, 522–538. - PubMed
    1. Arnett MG, Muglia LM, Laryea G, and Muglia LJ (2016). Genetic approaches to hypothalamic-pituitary-adrenal axis regulation. Neuropsychopharmacology 41, 245–260. - PMC - PubMed
    1. Arriza JL, Simerly RB, Swanson LW, and Evans RM (1988). The neuronal mineralocorticoid receptor as a mediator of glucocorticoid response. Neuron 1, 887–900. - PubMed
    1. Berger S, Wolfer DP, Selbach O, Alter H, Erdmann G, Reichardt HM, Chepkova AN, Welzl H, Haas HL, Lipp H-P, and Schütz G (2006). Loss of the limbic mineralocorticoid receptor impairs behavioral plasticity. Proc. Natl. Acad. Sci. USA 103, 195–200. - PMC - PubMed
    1. Binder EB (2009). The role of FKBP5, a co-chaperone of the glucocorticoid receptor in the pathogenesis and therapy of affective and anxiety disorders. Psychoneuroendocrinology 34 (Suppl 1), S186–S195. - PubMed

Publication types

MeSH terms

Substances

LinkOut - more resources