. 2021 Jul 6;144(1):52-73.
doi: 10.1161/CIRCULATIONAHA.120.047978. Epub 2021 Jun 3.

Regulation of the Methylation and Expression Levels of the BMPR2 Gene by SIN3a as a Novel Therapeutic Mechanism in Pulmonary Arterial Hypertension

Affiliations

Regulation of the Methylation and Expression Levels of the BMPR2 Gene by SIN3a as a Novel Therapeutic Mechanism in Pulmonary Arterial Hypertension

Malik Bisserier et al. Circulation. .

Abstract

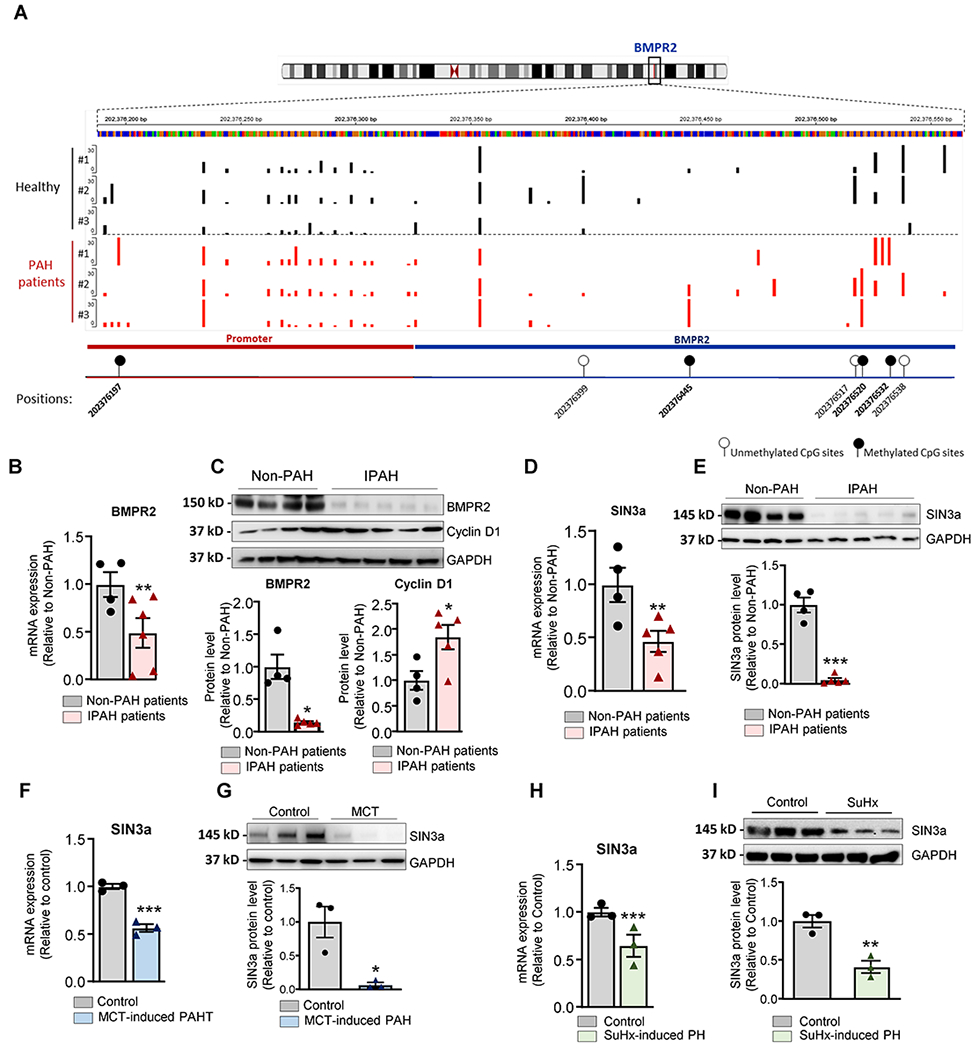
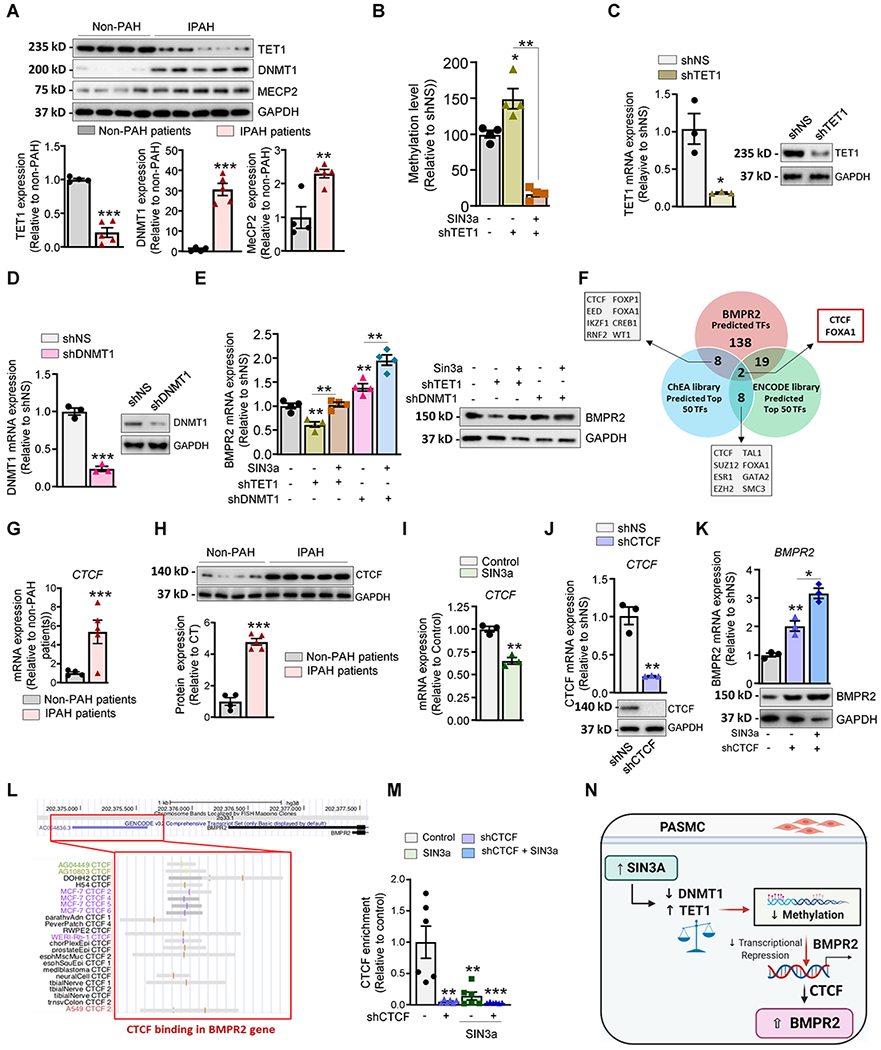
Background: Epigenetic mechanisms are critical in the pathogenesis of pulmonary arterial hypertension (PAH). Previous studies have suggested that hypermethylation of the BMPR2 (bone morphogenetic protein receptor type 2) promoter is associated with BMPR2 downregulation and progression of PAH. Here, we investigated for the first time the role of SIN3a (switch-independent 3a), a transcriptional regulator, in the epigenetic mechanisms underlying hypermethylation of BMPR2 in the pathogenesis of PAH.

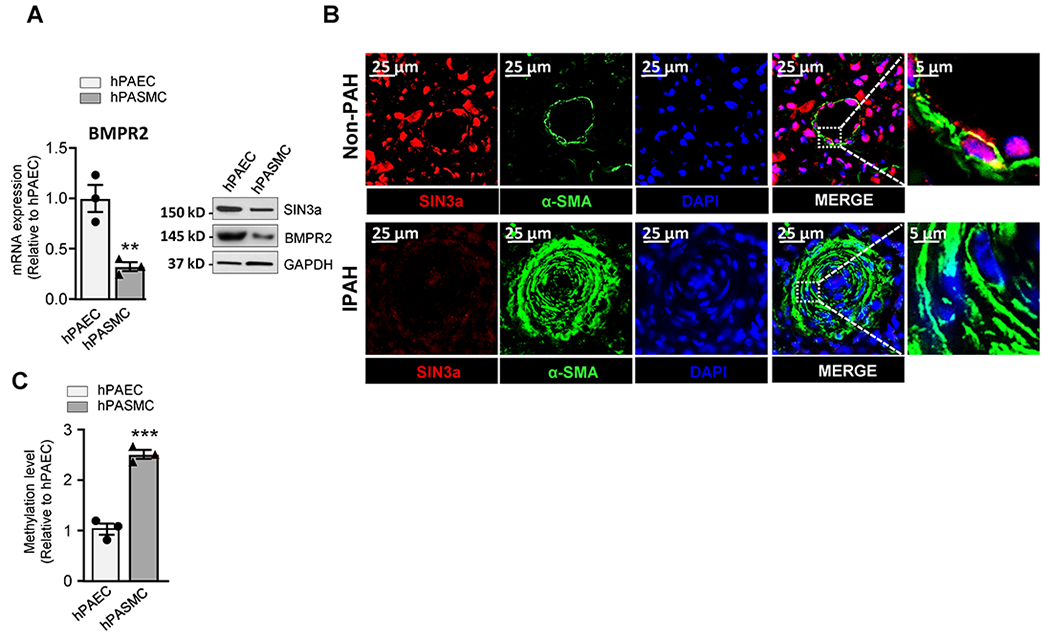
Methods: We used lung samples from PAH patients and non-PAH controls, preclinical mouse and rat PAH models, and human pulmonary arterial smooth muscle cells. Expression of SIN3a was modulated using a lentiviral vector or a siRNA in vitro and a specific adeno-associated virus serotype 1 or a lentivirus encoding for human SIN3a in vivo.

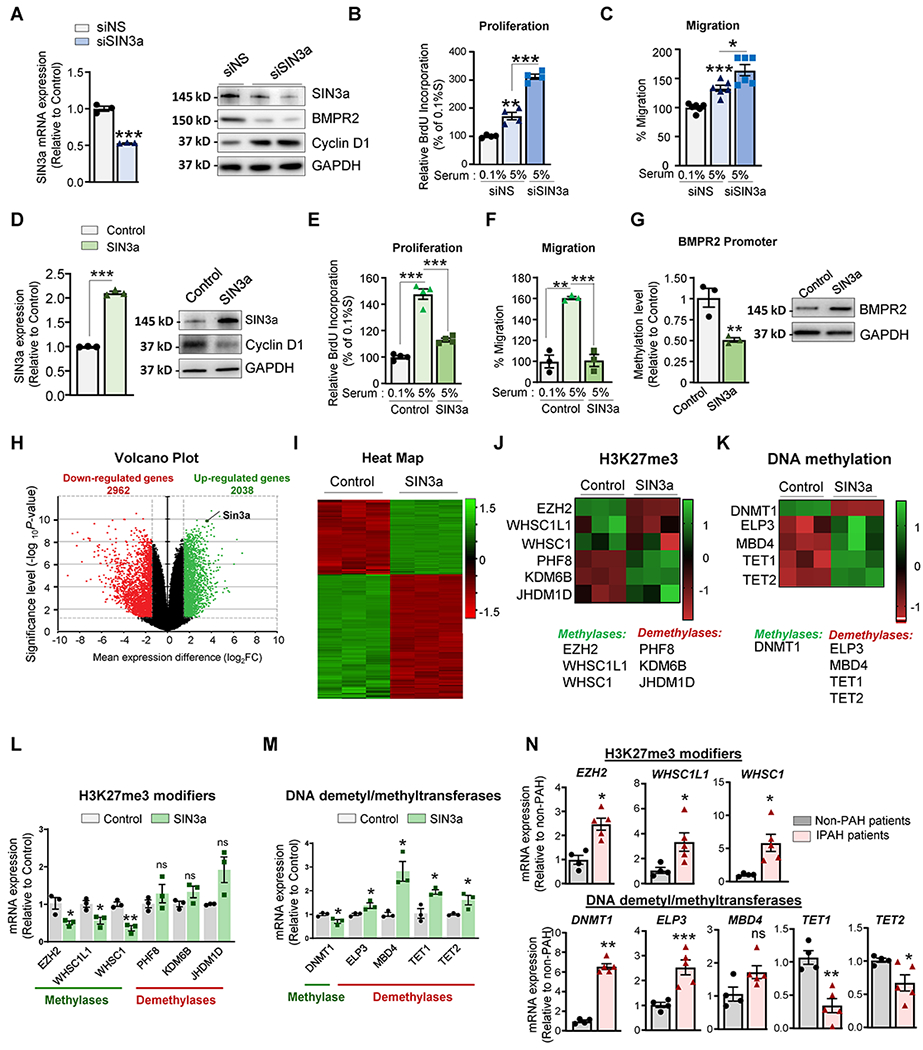
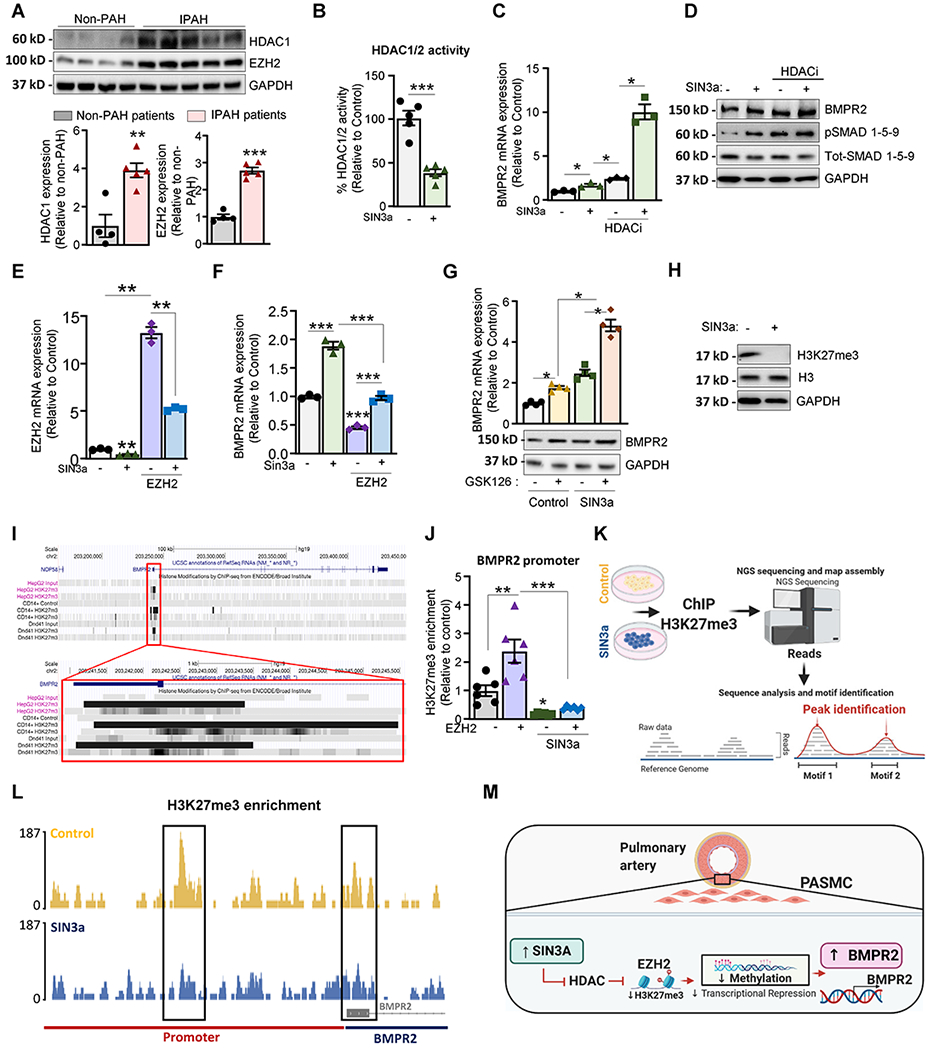
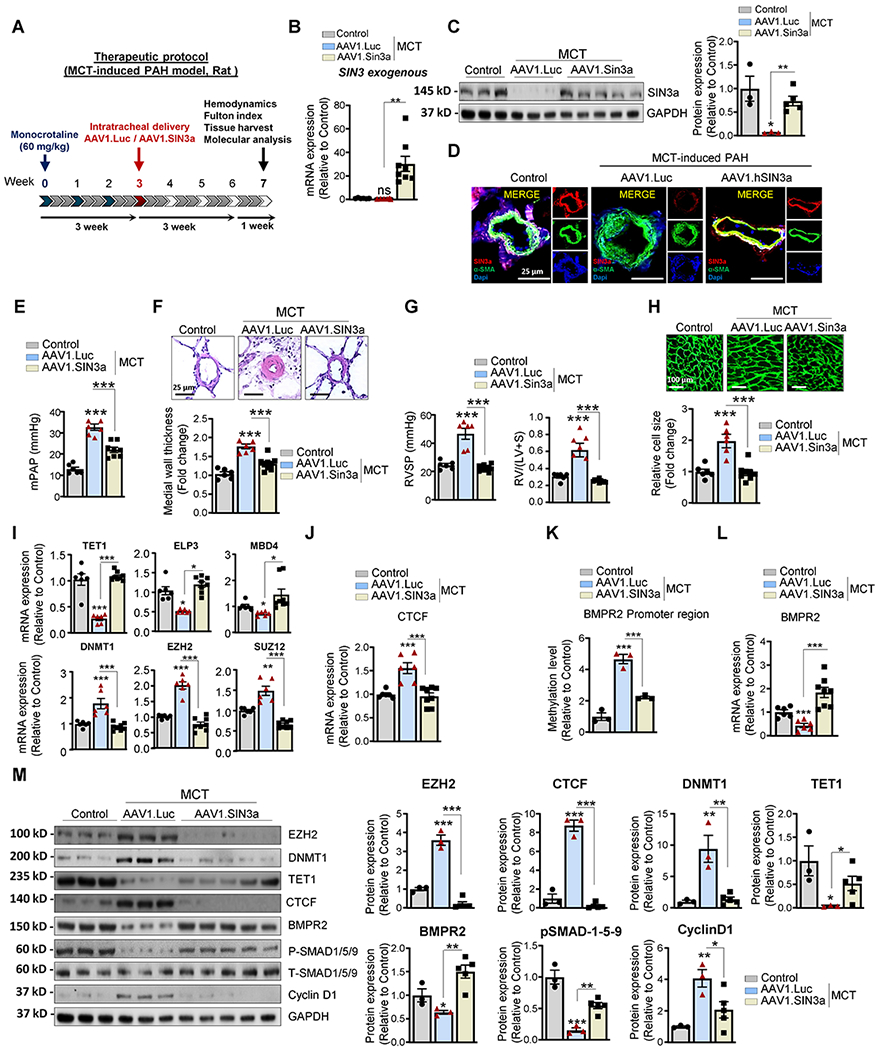
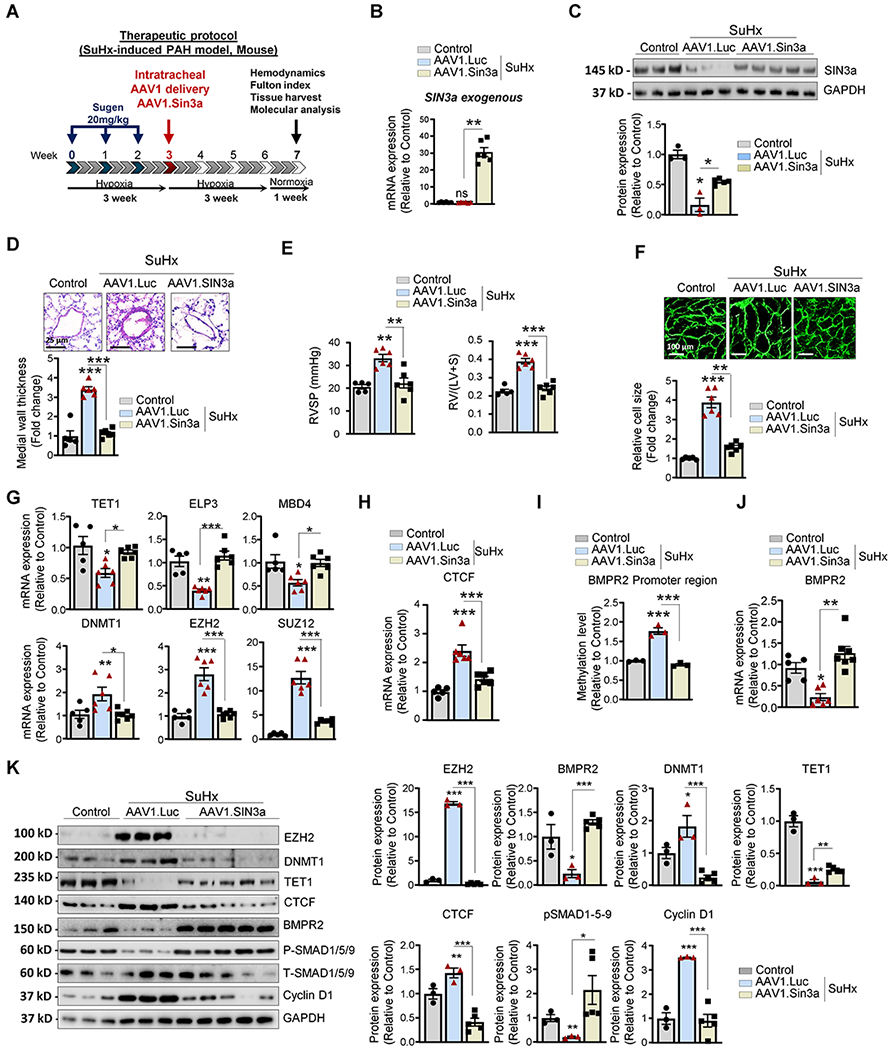
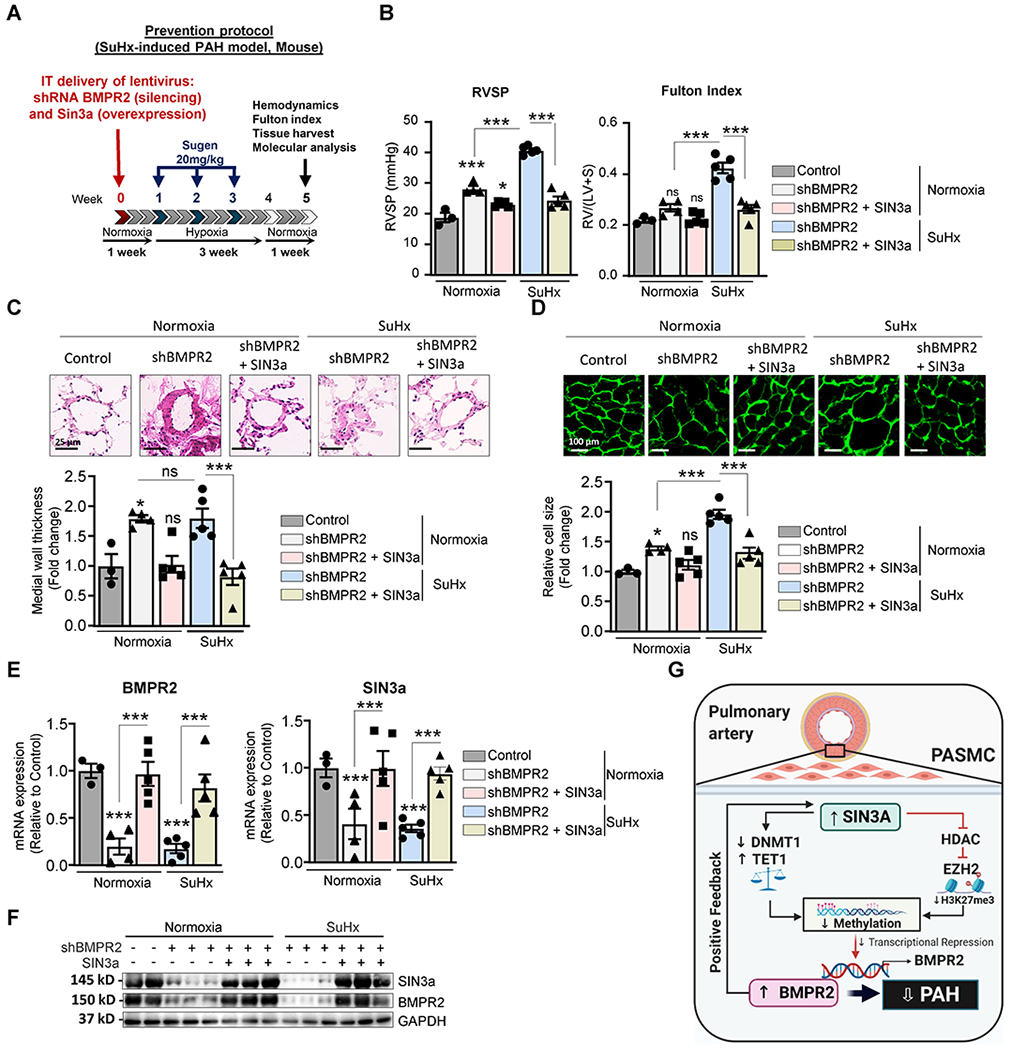
Results: SIN3a is a known transcriptional regulator; however, its role in cardiovascular diseases, especially PAH, is unknown. It is interesting that we detected a dysregulation of SIN3 expression in patients and in rodent models, which is strongly associated with decreased BMPR2 expression. SIN3a is known to regulate epigenetic changes. Therefore, we tested its role in the regulation of BMPR2 and found that BMPR2 is regulated by SIN3a. It is interesting that SIN3a overexpression inhibited human pulmonary arterial smooth muscle cells proliferation and upregulated BMPR2 expression by preventing the methylation of the BMPR2 promoter region. RNA-sequencing analysis suggested that SIN3a downregulated the expression of DNA and histone methyltransferases such as DNMT1 (DNA methyltransferase 1) and EZH2 (enhancer of zeste 2 polycomb repressive complex 2) while promoting the expression of the DNA demethylase TET1 (ten-eleven translocation methylcytosine dioxygenase 1). Mechanistically, SIN3a promoted BMPR2 expression by decreasing CTCF (CCCTC-binding factor) binding to the BMPR2 promoter. Last, we identified intratracheal delivery of adeno-associated virus serotype human SIN3a to be a beneficial therapeutic approach in PAH by attenuating pulmonary vascular and right ventricle remodeling, decreasing right ventricle systolic pressure and mean pulmonary arterial pressure, and restoring BMPR2 expression in rodent models of PAH.

Conclusions: All together, our study unveiled the protective and beneficial role of SIN3a in pulmonary hypertension. We also identified a novel and distinct molecular mechanism by which SIN3a regulates BMPR2 in human pulmonary arterial smooth muscle cells. Our study also identified lung-targeted SIN3a gene therapy using adeno-associated virus serotype 1 as a new promising therapeutic strategy for treating patients with PAH.

Keywords: DNA; dependovirus; epigenesis, genetic; genetic therapy; hypertension; methylation; pulmonary; pulmonary arterial hypertension.


Conflict of interest statement

Disclosures

The authors report no conflicts.

Figures

Figure 1.
Figure 1.. Hypermethylation of BMPR2 promoter correlates with decreased SIN3a expression in human PAH and PAH-animal model.
A. Methylation sites within the BMPR2 promoter region were identified by targeted-bisulfite sequencing. B. BMPR2 mRNA expression was analyzed by RT-qPCR in lung tissue from patients with idiopathic PAH (IPAH, n=5) and human non-PAH controls (n= 4). C. Upper panel, Representative BMPR2 and Cyclin D1 Western blot. Lower panel, the bar graph represents the quantification of BMPR2 and Cycin D1after correction for GAPDH by scanning densitometry. Data show fold stimulation with respect to control non-PAH. D. SIN3a mRNA expression was analyzed by RT-qPCR in lung homogenate tissue from patients with idiopathic PAH (IPAH, n=5) and non-PAH control lungs (n= 4). E. A representative blot of SIN3a protein expression (Upper Panel). Lower panel, bar graph represents the quantification of SIN3a correction for GAPDH. Data show fold stimulation with respect to control non-PAH. F. SIN3a mRNA expression was analyzed by RT-qPCR in lung tissue from control and MCT-induced PAH (n=3). G. SIN3a protein expression was assessed by Western blot in lung tissue from control and MCT-induced PAH (n=3). H. SIN3a mRNA expression was analyzed by RT-qPCR in lung tissue from control and Sugen Hypoxia-induced PAH mouse model (n=3). I. SIN3a protein expression was analyzed by western blot in lung tissue from control and Sugen Hypoxia-induced PAH mouse model (n=3). Data are presented as mean ±SEM; * = p<0.05, ** = p<0.01, *** P < 0.001.
Figure 2.
Figure 2.. Higher levels of BMPR2 promoter methylation is associated with lower BMPR2 and SIN3a expression in hPASMC.
A. BMPR2 (left) mRNA and protein (right) expression of indicated proteins were analyzed by RT-qPCR and immunoblotting in hPASMC and hPAECs. A representative blot is shown. GAPDH was used as a loading control. B. Representative images of Sin3a (Red) and α-SMA (Green) co-immunostaining in lung sections of non-PAH controls and iPAH patients. Nuclei were stained with DAPI (blue). C. Methylation level of the BMPR2 promoter region was analyzed by MS-PCR in hPASMC and hPAECs. Data are presented as mean ±SEM; ns=not significant, ** = p<0.01, *** P < 0.001.
Figure 3.
Figure 3.. SIN3a overexpression inhibits proliferation and potentiates BMPR2 expression in hPASMC.
A. SIN3a mRNA (left) or protein (right) expression of the indicated proteins in hPASMC expressing a non-silencing (siNS) or the designated siRNAs against SIN3a (siSIN3a) were analyzed by RT-qPCR and western blot. B-C. Proliferation and migration level were respectively measured by BrdU assay and Boyden chamber-based cell migration assay in hPASMC expressing a non-silencing (siNS) or SIN3a siRNA and cultured either in 0.1% or 5% FBS for 72 hrs. D. SIN3a mRNA (left) or protein (right) expression of the indicated proteins was analyzed by RT-qPCR and immunoblotting in hPASMC overexpressing either an empty vector (Vector) or SIN3a (SIN3a) lentivirus. E-F. Proliferation and migration level were respectively measured by BrdU assay and Boyden chamber-based cell migration assay in hPASMC overexpressing SIN3a or an empty vector as control. Cells were treated either with 0.1% or 5% FBS for 72 hrs. G. Methylation level of the BMPR2 promoter region (left) and protein expression (right) was analyzed by MS-PCR and immunoblotting in hPASMC overexpressing either a control vector or SIN3a. H. Volcano plots showed the log2-fold changes and statistical significance of each gene calculated after differential gene expression analysis. Every point represents a gene. Red points indicate significantly down-regulated genes; green points indicate upregulated genes. I. Heatmap, displaying gene expression for each sample in the RNA-seq dataset, is shown. Each row of the heatmap represents a gene, and each column represents a sample. J-K. Heatmaps illustrating the gene expression of H3K27 modifiers and DNA dimethyl/methyltransferases are shown. L. Transcript levels of EZH2, WHSC1L1, WHSC1, PHF8, KDM6B, and JHDM1 were measured by RT-qPCR in hPASMC overexpressing either an empty vector as a control or SIN3a. M. DNMT1, ELP3, MBD4, TET1, and TET2 mRNA expression level was measured by RT-qPCR in hPASMC overexpressing SIN3a vs. control. N. Transcript levels of the indicated genes were assessed by RT-qPCR lung samples from iPAH patients and non-PAH controls. Data are presented as mean ±SEM; ns=not significant, * = p<0.05, ** = p<0.01, *** P < 0.001.
Figure 4.
Figure 4.. SIN3a regulates BMPR2 expression by modulating the epigenetic landscape in hPASMC.
A. Lung homogenates from IPAH patients (n=5) and non-PAH controls (n=4) were analyzed by western blot to assess the protein expression of HDAC1 and EZH2. Upper panel, Representative HDAC1, and EZH2 Western blot. Lower panel, bar graph represents the quantification of HDAC and EZH2 normalized to GAPDH. B. HDAC1/2 activity was determined in hPASMC after the indicated treatments. C. hPASMC overexpressing either an empty vector as control or SIN3a were treated with Romidepsin (FK228, depsipeptide), a potent HDAC1 and HDAC2 inhibitor (HDACi), and BMPR2 mRNA level was determined by RT-qPCR. D. hPASMC overexpressing SIN3a alone or in combination with an HDAC1/2 inhibitor (HDACi) for 48 hr were analyzed by western blot for BMPR2, p-SMAD1/5/9, total-SMAD1/5/9, and GAPDH. E. EZH2 mRNA expression level was measured by RT-qPCR in hPASMC overexpressing SIN3a alone or in combination with lenti-EZH2. F. BMPR2 mRNA level was measured by RT-qPCR in the indicated conditions. G. BMPR2 mRNA (upper panel) and protein expression (lower panel) were analyzed by RT-qPCR and western blot in hPASMC treated with the potent EZH2 inhibitor (GSK126) for 48 hrs. alone or in combination with a lenti-SIN3a. H. hPASMC overexpressing either SIN3a or an empty vector were analyzed by immunoblotting for H3K27me3, Histone H3, and GAPDH. I. ENCODE H3K27me3-ChIP datasets were analyzed using UCSC genome browser to visualize H3K27me3-binding sites (highlighted in grey) at proximity of the promoter region of the human BMPR2 gene. J. ChIP-qPCR analysis of H3K27me3 at the BMPR2 promoter in hPASMC overexpressing either SIN3a or EZH2, alone or in combination. Promoter occupancy levels are expressed as the fold change relative to the control cells infected with an empty vector. K. ChIP-sequencing experimental procedure. L. H3K27me3 profile across the promoter region of BMPR2 on chromosome 2 in hPASMC overexpressing either a control vector or SIN3a. M. Schematic representation of the EZH2/H3K27me3 axis by which SIN3a regulates BMPR2 in hPASMC. Created with BioRender.com. Data are presented as mean ±SEM; * = p<0.05, ** = p<0.01, *** P < 0.001.
Figure 5.
Figure 5.. SIN3a overexpression decreased the methylation level of the BMPR2 promoter in hPASMC.
A. Representative immunoblot of TET1, DNMT1, and MECP2 expression in lung homogenates from non-PAH controls (n=4) and IPAH patients (n=5). The graph represents the quantification of the indicated proteins, normalized to GAPDH. B. TET1 mRNA (left) or protein (right) expression was analyzed by RT-qPCR and immunoblotting in hPASMC overexpressing either a non-silencing shRNA (shNS) or a specific shRNA against TET1 (shTET1). C. The methylation level of the BMPR2 promoter region was analyzed by MS-PCR in hPASMC overexpressing shTET1 alone or in combination with lenti-SIN3a. D. DNMT1 mRNA (left) or protein (right) expression was analyzed by RT-qPCR and immunoblotting in hPASMC overexpressing either a non-silencing shRNA (shNS) or a specific shRNA against DNMT1 (shDNMT1). E. BMPR2 mRNA and protein expression levels were measured by RT-qPCR and immunoblotting in the indicated conditions. F. RNA-seq datasets were analyzed using ChEA and encode library to identify the top 50 transcription factors that are regulated by SIN3a (TF). Comparative analysis was performed using the predicted TFs that regulate BMPR2 expression. G-H. CTCF mRNA and protein expression were assessed by RT-qPCR (G) and immunoblot (H) in lung homogenates from non-PAH controls (n=4) and iPAH patients (n=5). I. CTCF mRNA expression was assessed by RT-qPCR in hPASMC overexpressing either an empty vector as control or lenti-SIN3a. J. CTCF mRNA (left) or protein (right) expression was analyzed by RT-qPCR (left) and immunoblotting (right) in hPASMC overexpressing either a non-silencing shRNA (shNS) or a specific shRNA against CTCF (shCTCF). K. BMPR2 mRNA (left) and protein expression (right) were measured by RT-qPCR and immunoblot in hPASMC overexpressing shCTCF alone or in combination with lenti-SIN3a. L. ENCODE CTCF-ChIP datasets were analyzed using UCSC genome browser to visualize CTCF-binding sites (highlighted in grey) at proximity of the promoter region of the human BMPR2 gene. M. ChIP-qPCR analysis monitoring binding of CTCF at the BMPR2 promoter in CTCF-depleted hPASMC alone or in combination with SIN3a overexpression. Promoter occupancy levels are expressed as the fold change relative to the control cells infected with an empty vector. N. Schematic representation of the SIN3a/TET1 and SIN3a/DNMT1 axis promoting the demethylation of the BMPR2 promoter and restoring its expression level in hPASMC. Created with BioRender.com. Data are presented as mean ±SEM; * = p<0.05, ** = p<0.01, *** P < 0.001.
Figure 6.
Figure 6.. Therapeutic intratracheal delivery of AAV1.hSIN3a ameliorates MCT-induced PAH in rats.
A. Schematic of the experimental design to assess the therapeutic efficacy of AAV1.hSIN3a gene therapy in the rat MCT-induced PAH model. Tissues were collected at week 7 for molecular and histology analysis. B. Exogenous SIN3a mRNA level was assessed in lung tissues by RT-qPCR to determine the efficiency of the IT delivery of AAV1.hSIN3a gene transfer. C. SIN3a protein expression was assessed by immunoblotting in the sham control group, AAV1.CT+MCT and AAV1.hSIN3a+MCT groups. D. SIN3a expression (red) and α SMA (green) in pulmonary arterioles were detected by immunofluorescence using lung sections from the sham control group, AAV1.CT+MCT and AAV1.hSIN3a+MCT groups. Nuclei were counterstained with DAPI (blue). E. Pulmonary artery pressure (PAP) was assessed in control, and MCT-induced PAH rats treated either with AAV1.CT or AAV1.hSIN3a. F. Representative hematoxylin and eosin-stained lung sections of the indicated rats. The graph represents the quantification of the medial thickness. G. The right ventricular systolic pressure (RVSP) (left) and Fulton index RV/(LV + S) (right) were assessed in control and MCT-induced PAH rat treated either with AAV1.CT or AAV1.hSIN3a. H. RV sections were stained with fluorescence-tagged wheat germ agglutinin to examine RV cardiomyocyte cross-sectional area. I. Expression of the transcripts TET1, ELP3, MBD4, DNMT1, EZH2, SUZ12 were measured by RT-qPCR in lungs from control and MCT-induced PAH rats treated either with AAV1.CT or AAV1.hSIN3a. J. Expression of the transcripts CTCF was measured by RT-qPCR in lungs from control and MCT-induced PAH rats treated either with AAV1.CT or AAV1.hSIN3a. K. The methylation level of the BMPR2 promoter region was analyzed by methyl-specific PCR (MS-PCR) in control and MCT-induced PAH rats treated either with AAV1.CT or AAV1.hSIN3a. L. BMPR2 mRNA expression was assessed in the indicated groups by RT-qPCR. M. Lung homogenates were analyzed by western blot for the indicated proteins. Representative western blots (left panel) and respective densitometric quantitation (right panel) for EZH2, BMPR2, DNMT1, TET1, CTCF, pSMAD1/5/9, and Cyclin D1. Protein expression was normalized to Total-SMAD and GAPDH. Data are presented as mean ±SEM; ns=not significant, * = p<0.05, ** = p<0.01, *** P < 0.001.
Figure 7.
Figure 7.. Therapeutic intratracheal delivery of AAV1.hSIN3a reversed SuHx-induced PAH.
A. Schematic of the experimental design to assess the therapeutic efficacy of AAV1.hSIN3a gene therapy in the SuHx-induced PAH mouse model. Tissues were collected at week 7 for molecular and histology analysis. B. Exogenous SIN3a mRNA level was assessed in lung tissues by RT-qPCR in the mice lungs to determine the efficiency of the IT delivery of AAV1.hSIN3a gene transfer. C. SIN3a protein expression was assessed by immunoblotting. D. Representative hematoxylin and eosin-stained lung sections of the indicated mice. The graph represents the quantification of the medial thickness. E. RVSP (left) and Fulton’s index (right) were determined in control, and SuHx-induced PAH mice treated either with AAV1.CT or AAV1.hSIN3a. F. RV sections were stained with fluorescence-tagged wheat germ agglutinin to measure RV cardiomyocyte cross-sectional area. G. Expression of the transcripts TET1, ELP3, MBD4, DNMT1, EZH2, SUZ12 was measured by RT-qPCR in lungs from control, and SuHx-induced PAH mice treated either with AAV1.CT or AAV1.hSIN3a. H. mRNA expression of CTCF was measured by RT-qPCR. I. The methylation level of the BMPR2 promoter region was analyzed by MS-PCR in control, and SuHx-induced PAH mice treated either with AAV1.CT or AAV1.hSIN3a. J. BMPR2 mRNA expression was assessed in the indicated groups by RT-qPCR. K. Lung homogenates were analyzed by immunoblotting for the indicated proteins. Representative western blots and respective densitometric quantitation for EZH2, BMPR2, DNMT1, TET1, CTCF, pSMAD1/5/9, and Cyclin D1 are shown. Protein expression was normalized to Total-SMAD and GAPDH. Data are presented as mean ±SEM; ns=not significant, * = p<0.05, ** = p<0.01, *** P < 0.001.
Figure 8.
Figure 8.. Lentivirus-mediated SIN3a gene transfer attenuated SuHx-induced PAH in shRNA-mediated BMPR2 knockdown mice.
A. Schematic of the experimental design to assess the therapeutic efficacy of SIN3a lentivirus-mediated gene transfer using the SuHx-induced PAH mouse model. Tissues were collected at week 7 for molecular and histology analysis. B. RVSP (left) and Fulton’s index (right) were determined in the indicated conditions. C. Representative hematoxylin and eosin-stained lung sections of the indicated mice. The graph represents the quantification of the medial thickness. D. RV sections were stained with fluorescence-tagged wheat germ agglutinin to measure RV cardiomyocyte cross-sectional area. The graph represents the quantification of the cardiomyocyte size. E. mRNA expression of BMPR2 (left) and SIN3a (right) was assessed by RT-qPCR in the indicated conditions. F. Lung homogenates were analyzed by western blot to assess the protein expression of SIN3a and BMPR2 in control and SuHx-mice treated with shBMPR2 alone or in combination with SIN3a. G. Schematic representation of the molecular mechanisms by which SIN3a inhibits PAH. SIN3a restores BMPR2 expression by a dual mechanism in hPASMC. Our results showed that SIN3a inhibited EZH2 expression and the H3K27me3 contents within the BMPR2 promoter region while decreasing the methylation level of the BMPR2 promoter region by upregulating TET1 and repressing DNMT1 activity, which affects the CTCF binding to the BMPR2 promoter region. Created with BioRender.com. Data are presented as mean ±SEM; ns=not significant, * = p<0.05, *** P < 0.001.

Similar articles

Cited by

References

    1. Montani D, Girerd B, Gunther S, Riant F, Tournier-Lasserve E, Magy L, Maazi N, Guignabert C, Savale L, Sitbon O, Simonneau G, Soubrier F and Humbert M. Pulmonary arterial hypertension in familial hemiplegic migraine with ATP1A2 channelopathy. Eur Respir J. 2014;43:641–3. - PubMed
    1. Montani D, Chaumais MC, Guignabert C, Gunther S, Girerd B, Jais X, Algalarrondo V, Price LC, Savale L, Sitbon O, Simonneau G and Humbert M. Targeted therapies in pulmonary arterial hypertension. Pharmacol Ther. 2014;141:172–91. - PubMed
    1. Lai YC, Potoka KC, Champion HC, Mora AL and Gladwin MT. Pulmonary arterial hypertension: the clinical syndrome. Circ Res. 2014;115:115–30. - PMC - PubMed
    1. Thompson AAR and Lawrie A. Targeting Vascular Remodeling to Treat Pulmonary Arterial Hypertension. Trends Mol Med. 2017;23:31–45. - PubMed
    1. Guimaron S, Guihaire J, Amsallem M, Haddad F, Fadel E and Mercier O. Current Knowledge and Recent Advances of Right Ventricular Molecular Biology and Metabolism from Congenital Heart Disease to Chronic Pulmonary Hypertension. Biomed Res Int. 2018;2018:1981568. - PMC - PubMed

Publication types

MeSH terms

Substances