

Toward Dynamic Risk Prediction of Outcomes After Coronary Artery Bypass Graft: Improving Risk Prediction With Intraoperative Events Using Gradient Boosting
- PMID: 34078100
- PMCID: PMC8635167
- DOI: 10.1161/CIRCOUTCOMES.120.007363
Toward Dynamic Risk Prediction of Outcomes After Coronary Artery Bypass Graft: Improving Risk Prediction With Intraoperative Events Using Gradient Boosting
Abstract
Background: Intraoperative data may improve models predicting postoperative events. We evaluated the effect of incorporating intraoperative variables to the existing preoperative model on the predictive performance of the model for coronary artery bypass graft.
Methods: We analyzed 378 572 isolated coronary artery bypass graft cases performed across 1083 centers, using the national Society of Thoracic Surgeons Adult Cardiac Surgery Database between 2014 and 2016. Outcomes were operative mortality, 5 postoperative complications, and composite representation of all events. We fitted models by logistic regression or extreme gradient boosting (XGBoost). For each modeling approach, we used preoperative only, intraoperative only, or pre+intraoperative variables. We developed 84 models with unique combinations of the 3 variable sets, 2 variable selection methods, 2 modeling approaches, and 7 outcomes. Each model was tested in 20 iterations of 70:30 stratified random splitting into development/testing samples. Model performances were evaluated on the testing dataset using the C statistic, area under the precision-recall curve, and calibration metrics, including the Brier score.
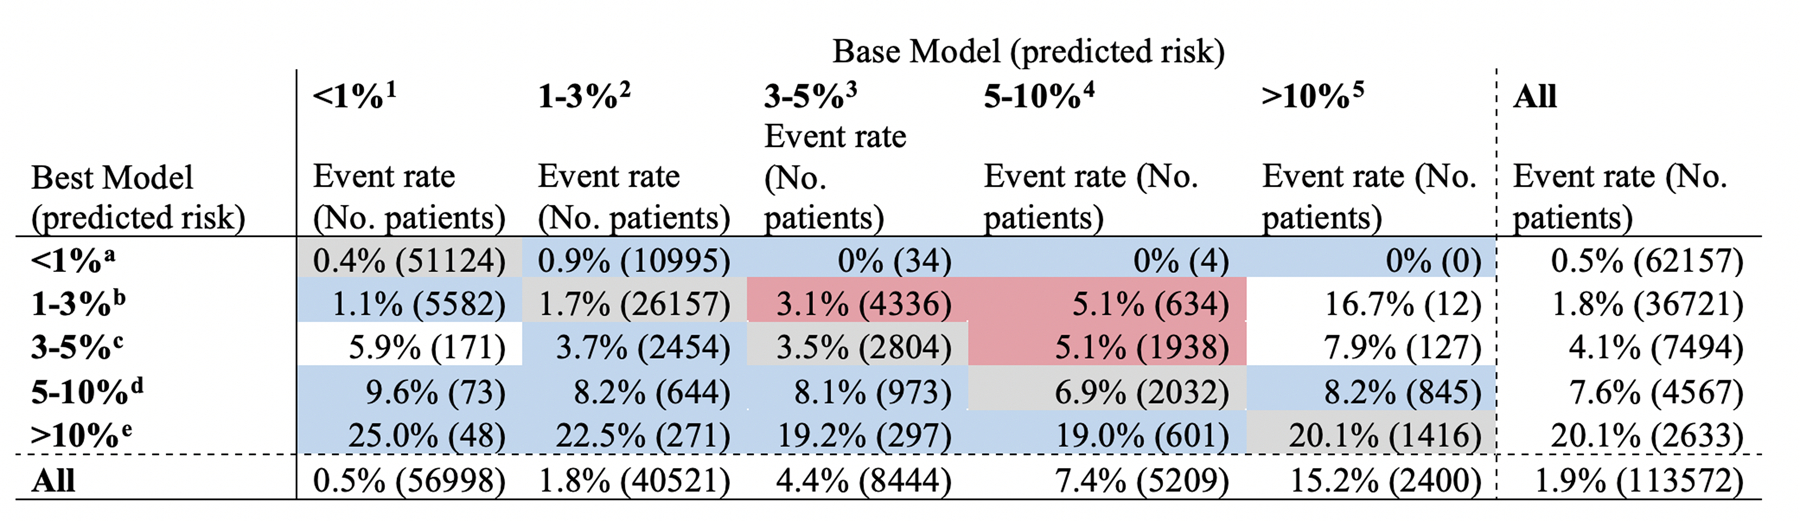
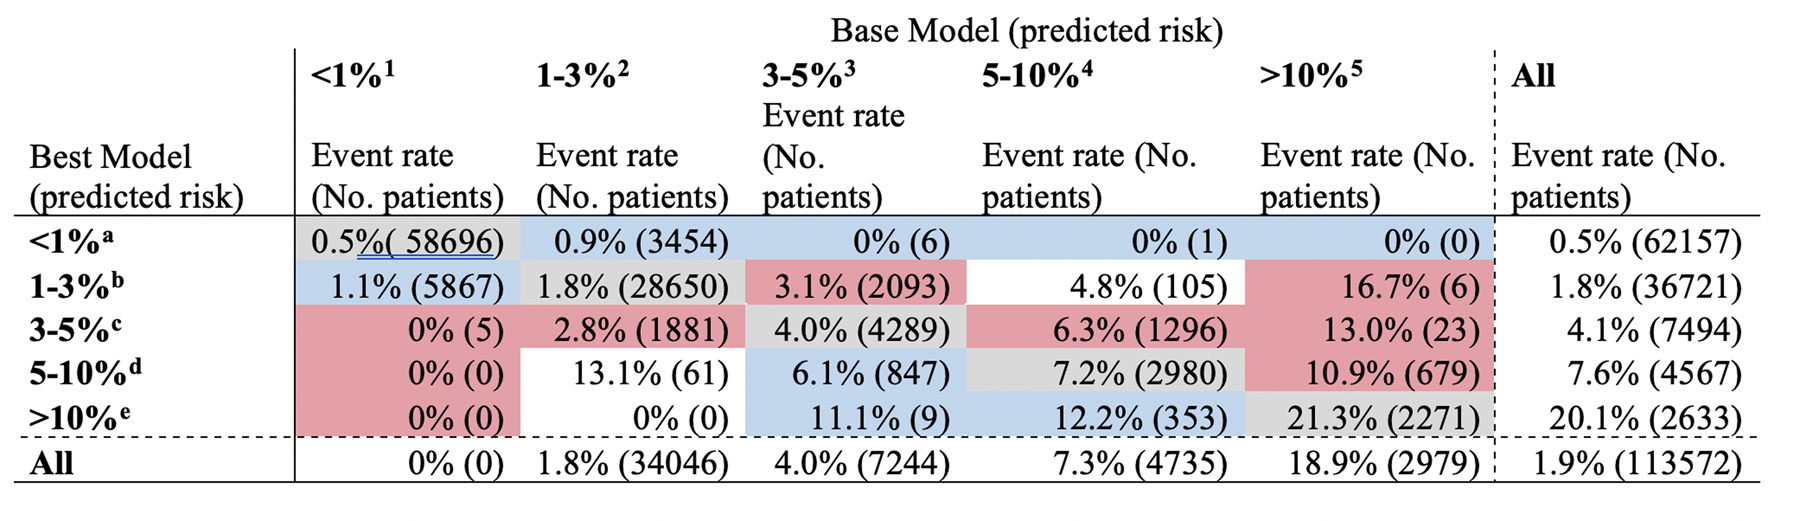
Results: The mean patient age was 65.3 years, and 24.7% were women. Operative mortality, excluding intraoperative death, occurred in 1.9%. In all outcomes, models that considered pre+intraoperative variables demonstrated significantly improved Brier score and area under the precision-recall curve compared with models considering pre or intraoperative variables alone. XGBoost without external variable selection had the best C statistics, Brier score, and area under the precision-recall curve values in 4 of the 7 outcomes (mortality, renal failure, prolonged ventilation, and composite) compared with logistic regression models with or without variable selection. Based on the calibration plots, risk restratification for mortality showed that the logistic regression model underestimated the risk in 11 114 patients (9.8%) and overestimated in 12 005 patients (10.6%). In contrast, the XGBoost model underestimated the risk in 7218 patients (6.4%) and overestimated in 0 patients (0%).
Conclusions: In isolated coronary artery bypass graft, adding intraoperative variables to preoperative variables resulted in improved predictions of all 7 outcomes. Risk models based on XGBoost may provide a better prediction of adverse events to guide clinical care.
Keywords: benchmarking; coronary artery bypass; machine learning; medical informatics; probability learning.
Figures


Similar articles
-
Machine learning model-based risk prediction of severe complications after off-pump coronary artery bypass grafting.Adv Clin Exp Med. 2023 Feb;32(2):185-194. doi: 10.17219/acem/152895. Adv Clin Exp Med. 2023. PMID: 36226692
-
Using machine learning to predict outcomes following suprainguinal bypass.J Vasc Surg. 2024 Mar;79(3):593-608.e8. doi: 10.1016/j.jvs.2023.09.037. Epub 2023 Oct 5. J Vasc Surg. 2024. PMID: 37804954
-
Pre-operative and intraoperative determinants for prolonged ventilation following adult cardiac surgery.Acta Anaesthesiol Scand. 2012 Feb;56(2):190-9. doi: 10.1111/j.1399-6576.2011.02538.x. Epub 2011 Oct 14. Acta Anaesthesiol Scand. 2012. PMID: 22091558
-
Unraveling the impact of time-dependent perioperative variables on 30-day readmission after coronary artery bypass surgery.J Thorac Cardiovasc Surg. 2022 Sep;164(3):943-955.e7. doi: 10.1016/j.jtcvs.2020.09.076. Epub 2020 Sep 29. J Thorac Cardiovasc Surg. 2022. PMID: 33127082
-
Risk factors of major bleeding detected by machine learning method in patients undergoing liver resection with controlled low central venous pressure technique.Postgrad Med J. 2023 Nov 20;99(1178):1280-1286. doi: 10.1093/postmj/qgad087. Postgrad Med J. 2023. PMID: 37794600 Review.
Cited by
-
Machine learning-based hybrid risk estimation system (ERES) in cardiac surgery: Supplementary insights from the ASA score analysis.PLOS Digit Health. 2025 Jun 23;4(6):e0000889. doi: 10.1371/journal.pdig.0000889. eCollection 2025 Jun. PLOS Digit Health. 2025. PMID: 40549810 Free PMC article.
-
Predictive Analytics in Cardiothoracic Care: Enhancing Outcomes with the Healthcare Enabled by Artificial Intelligence in Real Time (HEART) Project.J Maine Med Cent. 2024 Summer;6(2):11. doi: 10.46804/2641-2225.1195. Epub 2024 Sep 30. J Maine Med Cent. 2024. PMID: 40051776 Free PMC article.
-
Development and Validation of Machine Learning Models for Adverse Events after Cardiac Surgery.medRxiv [Preprint]. 2025 Feb 25:2025.02.24.25322811. doi: 10.1101/2025.02.24.25322811. medRxiv. 2025. PMID: 40061347 Free PMC article. Preprint.
-
Performance Drift in Machine Learning Models for Cardiac Surgery Risk Prediction: Retrospective Analysis.JMIRx Med. 2024 Jun 12;5:e45973. doi: 10.2196/45973. JMIRx Med. 2024. PMID: 38889069 Free PMC article.
-
Multiple Layers of Care and Risk: Comparing Cross-Specialty Outcomes Using Regional, Hospital, and Patient-Level Data.JACC Adv. 2022 Oct 28;1(4):100115. doi: 10.1016/j.jacadv.2022.100115. eCollection 2022 Oct. JACC Adv. 2022. PMID: 38939699 Free PMC article.
References
-
- Shahian DM; O’Brien SM; Filardo G; Ferraris VA; Haan CK; Rich JB; Normand SLT; DeLong ER; Shewan CM; Dokholyan RS et al. The Society of Thoracic Surgeons 2008 cardiac surgery risk models: part 1--coronary artery bypass grafting surgery. Ann Thorac Surg 2009;88:S2–22. doi:10.1016/j.athoracsur.2009.05.053 - DOI - PubMed
-
- Shahian DM; Jacobs JP; Badhwar V; Kurlansky PA; Furnary AP; Cleveland JC; Lobdell KW; Vassileva C; Wyler von Ballmoos MC; Thourani VH; et al. The Society of Thoracic Surgeons 2018 Adult Cardiac Surgery Risk Models: Part 1-Background, Design Considerations, and Model Development. Ann Thorac Surg 2018;105:1411–1418. doi:10.1016/j.athoracsur.2018.03.002 - DOI - PubMed
Publication types
MeSH terms
Grants and funding
LinkOut - more resources
Full Text Sources
Medical
