

Temporal trends in the prevalence of metabolic syndrome among middle-aged and elderly adults from 2011 to 2015 in China: the China health and retirement longitudinal study (CHARLS)
- PMID: 34078325
- PMCID: PMC8173844
- DOI: 10.1186/s12889-021-11042-x
Temporal trends in the prevalence of metabolic syndrome among middle-aged and elderly adults from 2011 to 2015 in China: the China health and retirement longitudinal study (CHARLS)
Abstract
Background: Metabolic syndrome (MetS) is a major risk factor for cardiovascular diseases. The objective of the study was to evaluate the updated prevalence of MetS and provide a comprehensive illustration of the possible temporal changes in MetS prevalence in China from 2011 to 2015.
Methods: The data for this study are from the 2011 and 2015 waves of the China Health and Retirement Longitudinal Study (CHARLS). CHARLS is a nationally representative survey targeting populations aged 45 and above from 28 provinces in mainland China. A total of 11,847 and 13,013 participants were eligible for data analysis at the two time points.
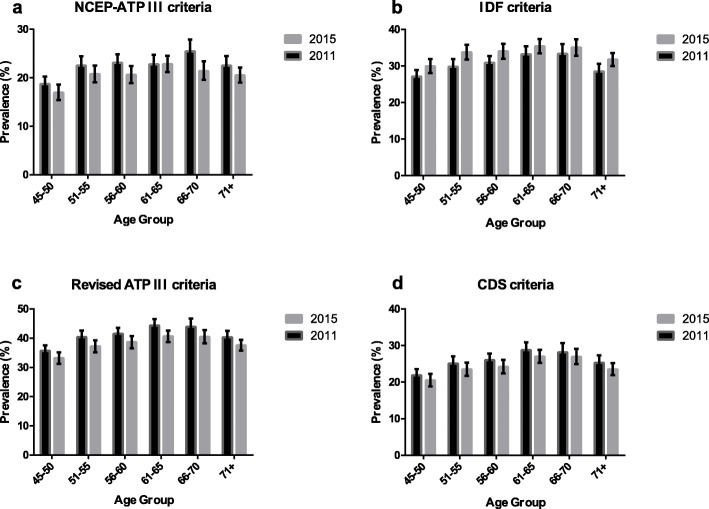
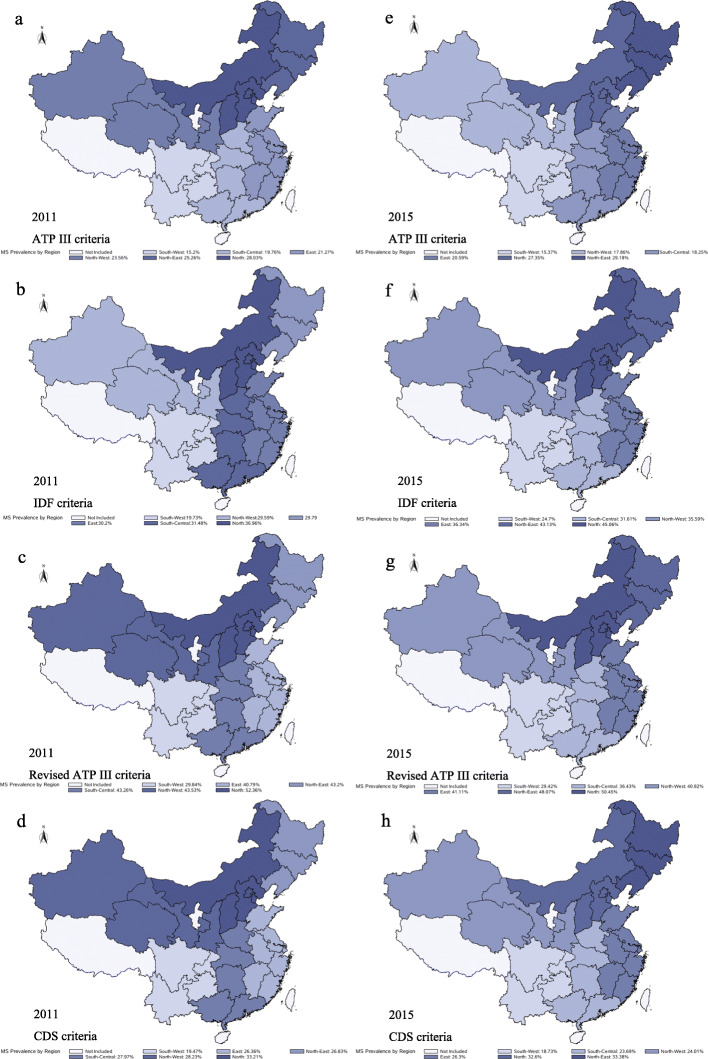
Results: The estimated prevalence of MetS in 2015 was 20.41% (95% CI: 19.02-21.8%) by the National Cholesterol Education Program (NCEP) Expert Panel on Detection, Evaluation, and Treatment of High Blood Cholesterol in Adults (ATP III) criteria, 34.77% (95% CI: 33.12-36.42%) by the International Diabetes Federation (IDF) criteria, 39.68% (95% CI: 37.88-41.47%) by the revised ATP III criteria, and 25.55% (95% CI: 24.19-26.91%) by the Chinese Diabetes Society (CDS) criteria. The prevalence was higher among women and elderly adults and in urban and northern populations. Furthermore, the trends in the prevalence decreased significantly between 2011 and 2015 by the ATP III, revised ATP III and CDS criteria. However, trends increased significantly from 2011 to 2015 by the IDF criteria.
Conclusions: A higher prevalence of MetS is found in those who reported being middle aged and elderly, women, residing in northern China or living in urban areas. Additionally, temporal changes in the prevalence of MetS varied according to different criteria. Increased attention to the causes associated with populations who have higher levels of MetS is warranted.
Keywords: China; Epidemiology; Metabolic syndrome; Prevalence; Trends.
Conflict of interest statement
The authors declare that they have no competing interests.
Figures

References
-
- Park S, Lee S, Kim Y, Lee Y, Kang MW, Han K, Han SS, Lee H, Lee JP, Joo KW, Lim CS, Kim YS, Kim DK. Altered risk for cardiovascular events with changes in the metabolic syndrome status: a Nationwide population-based study of approximately 10 million persons. Ann Intern Med. 2019;171(12):875–884. doi: 10.7326/M19-0563. - DOI - PubMed
-
- Raffaitin C, Gin H, Empana JP, Helmer C, Berr C, Tzourio C, Portet F, Dartigues JF, Alperovitch A, Barberger-Gateau P. Metabolic syndrome and risk for incident Alzheimer's disease or vascular dementia: the Three-City study. Diabetes Care. 2008;32(1):169–174. doi: 10.2337/dc08-0272. - DOI - PMC - PubMed
Publication types
MeSH terms
Grants and funding
LinkOut - more resources
Full Text Sources
Medical
