

A cross-sectional study measuring contact patterns using diaries in an urban and a rural community in South Africa, 2018
- PMID: 34078327
- PMCID: PMC8172361
- DOI: 10.1186/s12889-021-11136-6
A cross-sectional study measuring contact patterns using diaries in an urban and a rural community in South Africa, 2018
Abstract
Background: Describing contact patterns is crucial to understanding infectious disease transmission dynamics and guiding targeted transmission mitigation interventions. Data on contact patterns in Africa, especially South Africa, are limited. We measured and compared contact patterns in a rural and urban community, South Africa. We assessed participant and contact characteristics associated with differences in contact rates.
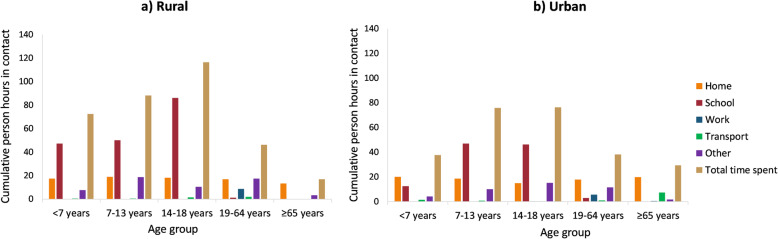
Methods: We conducted a cross-sectional study nested in a prospective household cohort study. We interviewed participants to collect information on persons in contact with for one day. We described self-reported contact rates as median number people contacted per day, assessed differences in contact rates based on participant characteristics using quantile regression, and used a Poisson model to assess differences in contact rates based on contact characteristics within age groups. We also calculated cumulative person hours in contact within age groups at different locations.
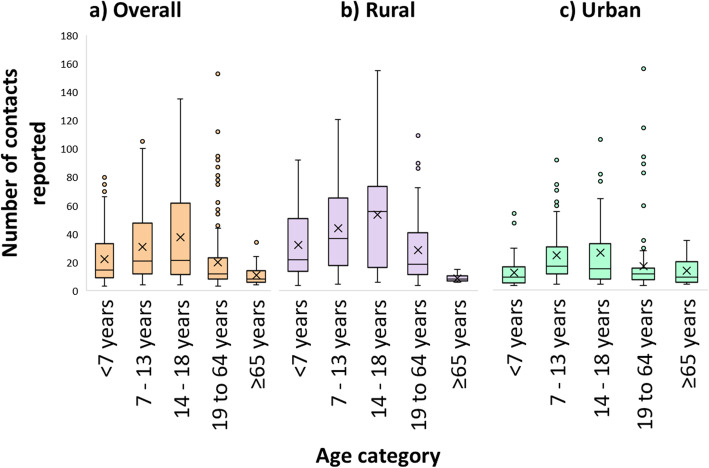
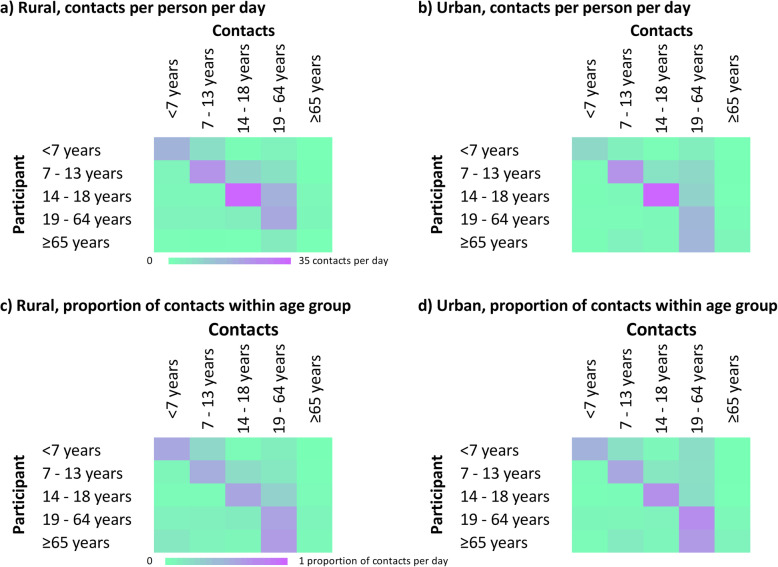
Results: We conducted 535 interviews (269 rural, 266 urban), with 17,252 contacts reported. The overall contact rate was 14 (interquartile range (IQR) 9-33) contacts per day. Those ≤18 years had higher contact rates at the rural site (coefficient 17, 95% confidence interval (95%CI) 10-23) compared to the urban site, for those aged 14-18 years (13, 95%CI 3-23) compared to < 7 years. No differences were observed for adults. There was a strong age-based mixing, with age groups interacting more with similar age groups, but also interaction of participants of all ages with adults. Children aged 14-18 years had the highest cumulative person hours in contact (116.3 rural and 76.4 urban).
Conclusions: Age played an important role in the number and duration of contact events, with children at the rural site having almost double the contact rate compared to the urban site. These contact rates can be utilized in mathematical models to assess transmission dynamics of infectious diseases in similar communities.
Keywords: Contact diaries; Infectious disease modelling; Rural; Urban.
Conflict of interest statement
CC has received grant support from Sanofi Pasteur, Advanced Vaccine Initiative, U.S. Centers for Disease Control and Prevention, and payment of travel costs from Parexel. All other authors have no competing/conflict of interest. All other authors have no competing/conflict of interest.
Figures
References
-
- GBD 2016 Causes of Death Collaborators Global, regional, and national age-sex specific mortality for 264 causes of death, 1980-2016: a systematic analysis for the global burden of disease study 2016. Lancet (London, England) 2017;390(10100):1151–1210. doi: 10.1016/S0140-6736(17)32152-9. - DOI - PMC - PubMed
Publication types
MeSH terms
LinkOut - more resources
Full Text Sources
Medical
