. 2021 Jun 2;21(1):175.
doi: 10.1186/s12911-021-01501-1.

Public health utility of cause of death data: applying empirical algorithms to improve data quality

Collaborators, Affiliations

Public health utility of cause of death data: applying empirical algorithms to improve data quality

Sarah Charlotte Johnson et al. BMC Med Inform Decis Mak. .

Abstract

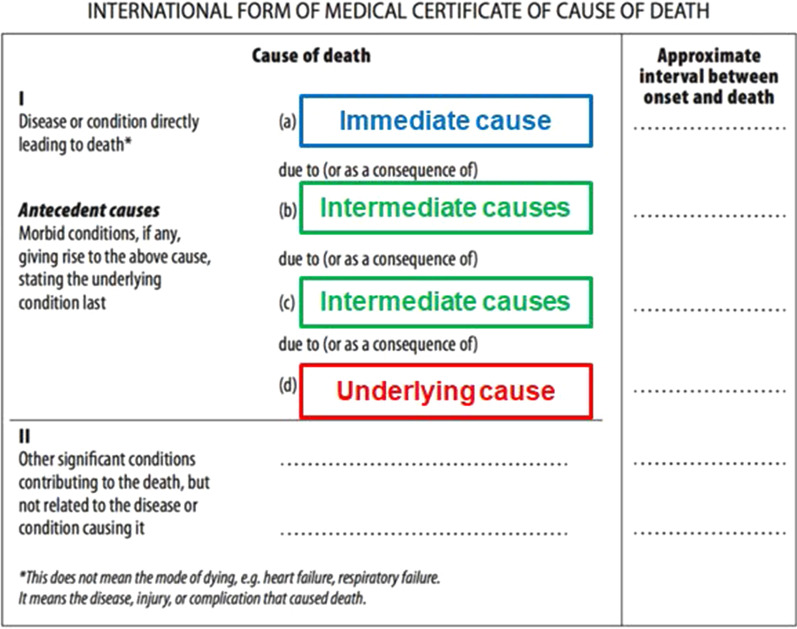
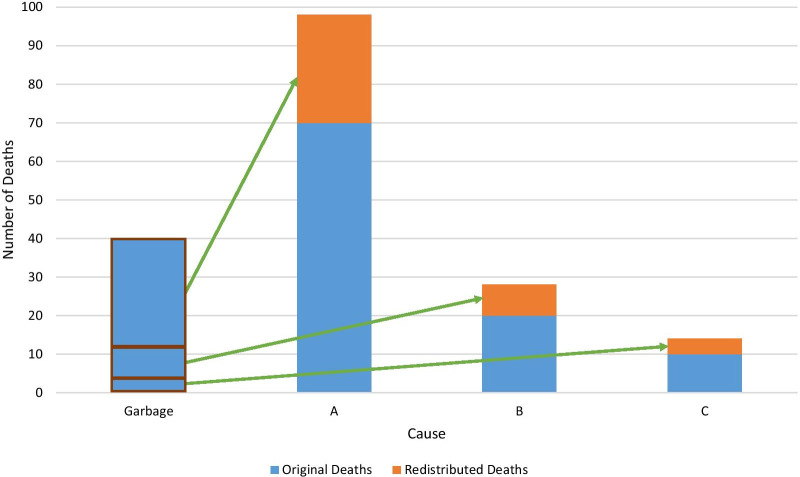
Background: Accurate, comprehensive, cause-specific mortality estimates are crucial for informing public health decision making worldwide. Incorrectly or vaguely assigned deaths, defined as garbage-coded deaths, mask the true cause distribution. The Global Burden of Disease (GBD) study has developed methods to create comparable, timely, cause-specific mortality estimates; an impactful data processing method is the reallocation of garbage-coded deaths to a plausible underlying cause of death. We identify the pattern of garbage-coded deaths in the world and present the methods used to determine their redistribution to generate more plausible cause of death assignments.

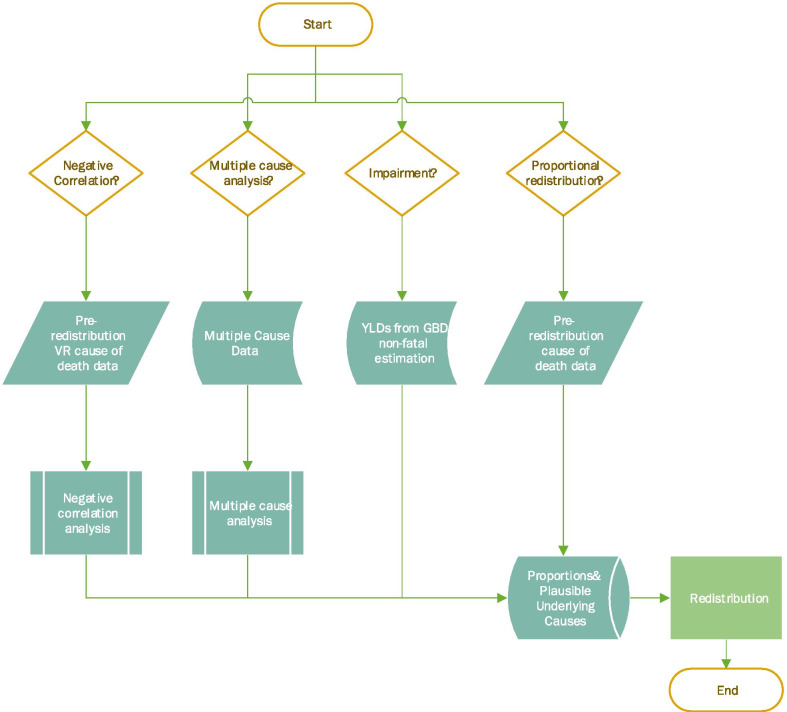
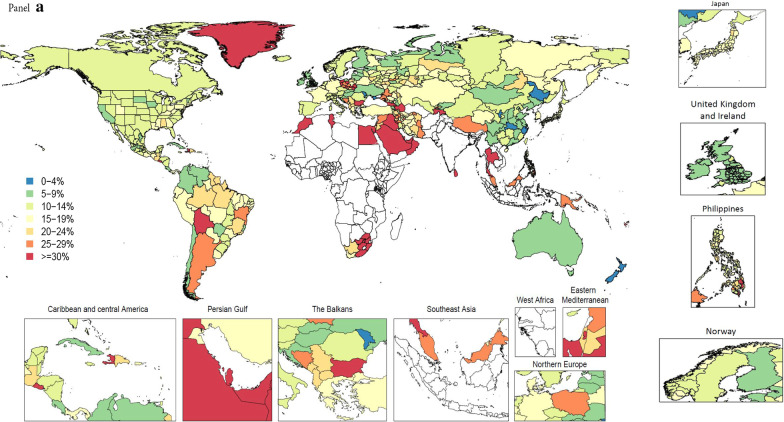
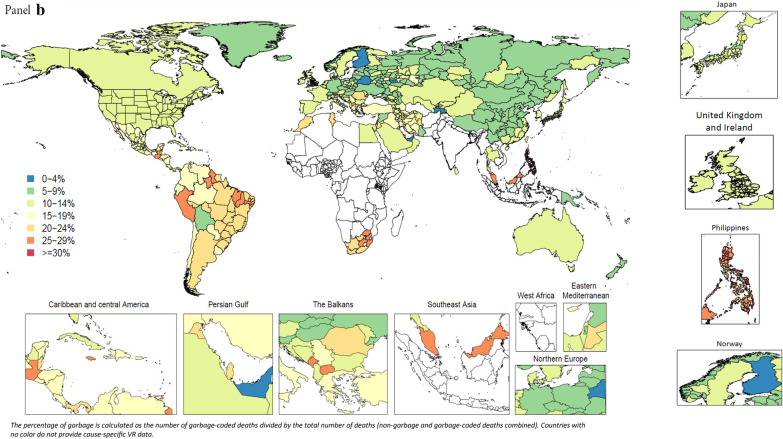
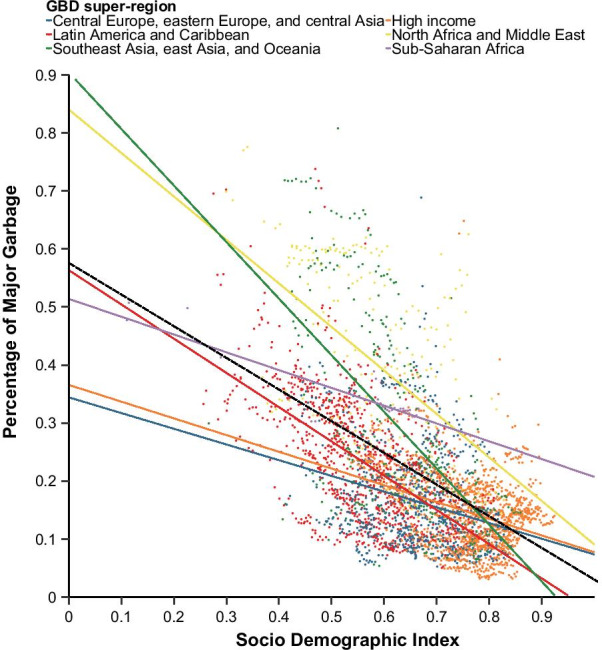
Methods: We describe the methods developed for the GBD 2019 study and subsequent iterations to redistribute garbage-coded deaths in vital registration data to plausible underlying causes. These methods include analysis of multiple cause data, negative correlation, impairment, and proportional redistribution. We classify garbage codes into classes according to the level of specificity of the reported cause of death (CoD) and capture trends in the global pattern of proportion of garbage-coded deaths, disaggregated by these classes, and the relationship between this proportion and the Socio-Demographic Index. We examine the relative importance of the top four garbage codes by age and sex and demonstrate the impact of redistribution on the annual GBD CoD rankings.

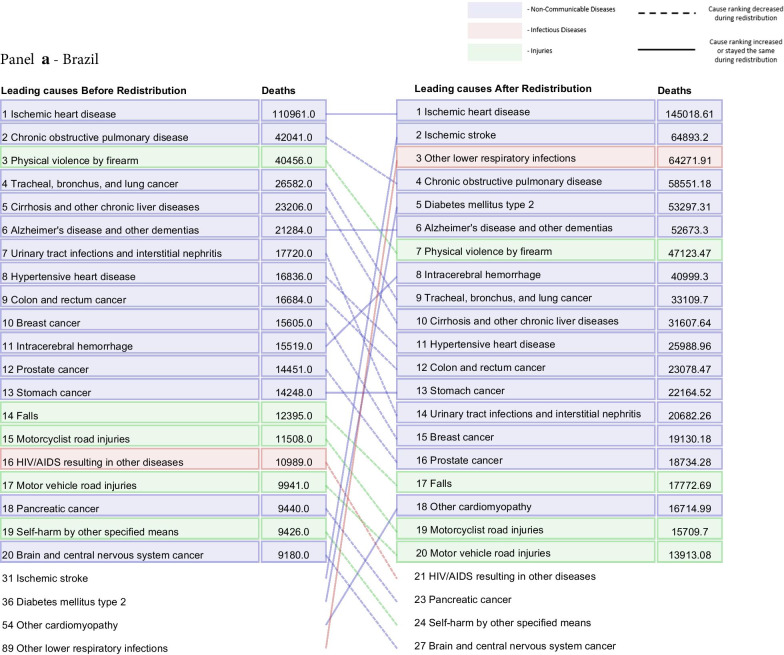
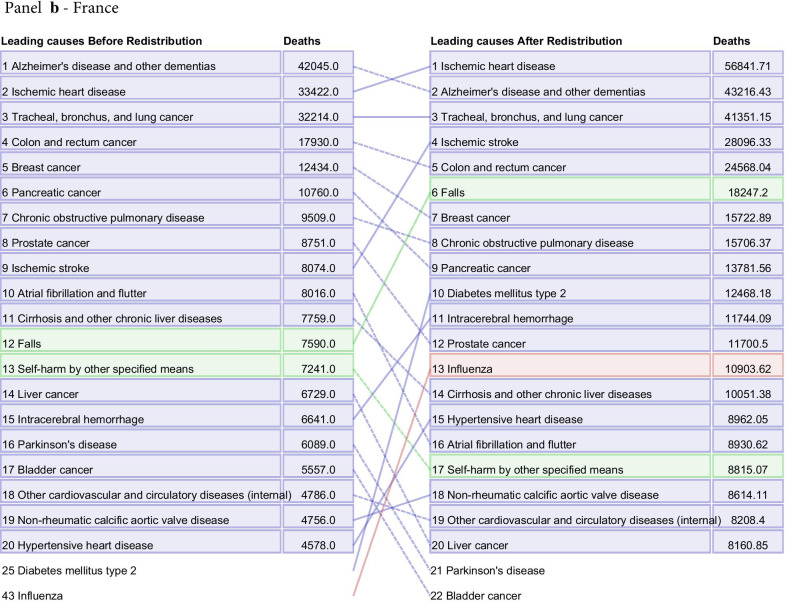
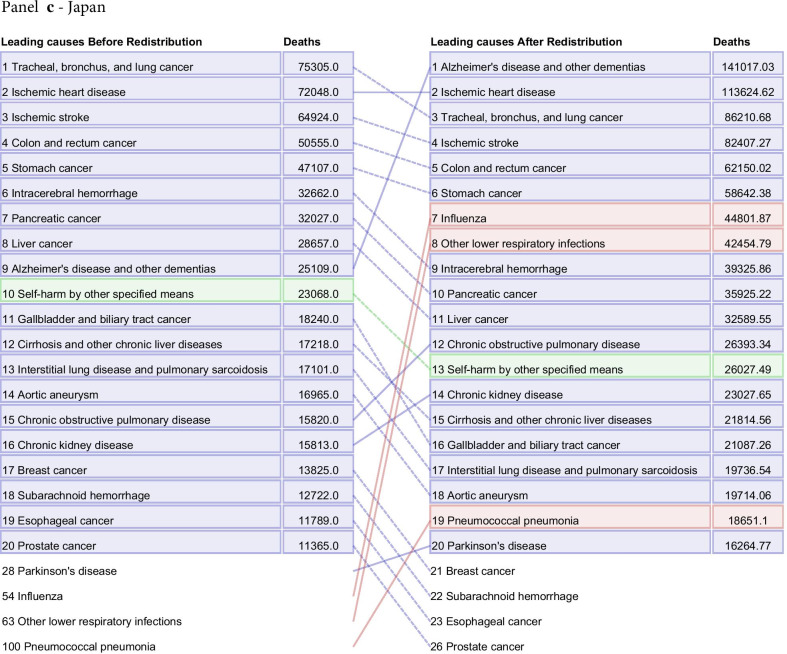
Results: The proportion of least-specific (class 1 and 2) garbage-coded deaths ranged from 3.7% of all vital registration deaths to 67.3% in 2015, and the age-standardized proportion had an overall negative association with the Socio-Demographic Index. When broken down by age and sex, the category for unspecified lower respiratory infections was responsible for nearly 30% of garbage-coded deaths in those under 1 year of age for both sexes, representing the largest proportion of garbage codes for that age group. We show how the cause distribution by number of deaths changes before and after redistribution for four countries: Brazil, the United States, Japan, and France, highlighting the necessity of accounting for garbage-coded deaths in the GBD.

Conclusions: We provide a detailed description of redistribution methods developed for CoD data in the GBD; these methods represent an overall improvement in empiricism compared to past reliance on a priori knowledge.

Keywords: Cause of death; Garbage codes; Global Burden of Disease; Redistribution; Star ranking system; Vital registration.


Conflict of interest statement

Dr. Singh reports personal fees from Crealta/Horizon, Medisys, Fidia, UBM LLC, Trio health, Adept Field solutions, Medscape, WebMD, Clinical Care options, Clearview healthcare partners, Putnam associates, Focus forward, Navigant consulting, Spherix, Practice Point communications, the National Institutes of Health and the American College of Rheumatology, personal fees from Simply Speaking, ownership in stock options from Amarin, Viking, Moderna, Vaxart pharmaceuticals, and Charlotte’s Web Holdings, non-financial support from FDA Arthritis Advisory Committee, non-financial support from Steering committee of OMERACT, an international organization that develops measures for clinical trials and receives arm’s length funding from 12 pharmaceutical companies, non-financial support from Veterans Affairs Rheumatology Field Advisory Committee, non-financial support from Editor and the Director of the UAB Cochrane Musculoskeletal Group Satellite Center on Network Meta-analysis, outside the submitted work.

Figures

Fig. 1
Fig. 1
Flowchart for methods used to determine inputs into redistribution algorithm
Fig. 2
Fig. 2
International medical death certificate for cause of death [50]
Fig. 3
Fig. 3
Conceptual diagram of garbage-coded deaths being redistributed proportionally onto plausible underlying causes A, B, and C. Deaths are reallocated separately for each age, sex, location, and year of cause of death data
Fig. 4
Fig. 4
Percentage of major, class 1 and 2 (a), and class 3 and 4 garbage (b) in VR data in 2015 or closest available year, all ages, both sexes
Fig. 4
Fig. 4
Percentage of major, class 1 and 2 (a), and class 3 and 4 garbage (b) in VR data in 2015 or closest available year, all ages, both sexes
Fig. 5
Fig. 5
Age-standardised proportion of major garbage vs. SDI by location and year, 1980–2019. The dashed black line represents the global trend
Fig. 6
Fig. 6
Stacked bar chart of the top four garbage codes, by percentage of all garbage-coded deaths, for ICD-10 VR data in 2015 by age and sex
Fig. 7
Fig. 7
Leading 20 causes of death for Brazil (a), France (b), Japan (c), and the United States (d) in 2015 for all ages and both sexes combined. The left-hand column is data before redistribution compared to data after redistribution in the right-hand column. Causes are connected by arrows before and after redistribution. Infectious diseases are shown in red, non-communicable diseases in blue, and injuries in green. This figure also captures additional corrections applied prior to redistribution, namely adjustments made for the misdiagnosis of Parkinson’s, atrial fibrillation, and Alzheimer’s disease and other dementias not discussed in detail in this paper (Additional file 1: Figure 1). Additionally, only real underlying causes are included in this figure. For that reason, one will not see "Garbage Code" listed in the deaths prior to redistribution
Fig. 7
Fig. 7
Leading 20 causes of death for Brazil (a), France (b), Japan (c), and the United States (d) in 2015 for all ages and both sexes combined. The left-hand column is data before redistribution compared to data after redistribution in the right-hand column. Causes are connected by arrows before and after redistribution. Infectious diseases are shown in red, non-communicable diseases in blue, and injuries in green. This figure also captures additional corrections applied prior to redistribution, namely adjustments made for the misdiagnosis of Parkinson’s, atrial fibrillation, and Alzheimer’s disease and other dementias not discussed in detail in this paper (Additional file 1: Figure 1). Additionally, only real underlying causes are included in this figure. For that reason, one will not see "Garbage Code" listed in the deaths prior to redistribution

References

    1. Alter GC, Carmichael AG. Classifying the dead: toward a history of the registration of causes of death. J Hist Med Allied Sci. 1999;54(2):114–132. doi: 10.1093/jhmas/54.2.114. - DOI - PubMed
    1. GBD 2019 Diseases, Injuries, and Impairments Collaborators. Global burden of 369 diseases and injuries in 204 countries and territories, 1990–2019: a systematic analysis for the Global Burden of Disease Study 2019. The Lancet. in press - PMC - PubMed
    1. Principles and Recommendations for a Vital Statistics System Revision 2 [Internet]. United Nations; 2001 [cited 2020 May 29]. https://unstats.un.org/unsd/publication/SeriesM/SeriesM_19rev2E.pdf
    1. Sibai AM. Mortality certification and cause-of-death reporting in developing countries. Bull World Health Organ. 2004;82(2):83. - PMC - PubMed
    1. Jha P. Reliable direct measurement of causes of death in low- and middle-income countries. BMC Med. 2014;12(1):19. doi: 10.1186/1741-7015-12-19. - DOI - PMC - PubMed

Publication types