

Weaning-associated feed deprivation stress causes microbiota disruptions in a novel mucin-containing in vitro model of the piglet colon (MPigut-IVM)
- PMID: 34078434
- PMCID: PMC8170946
- DOI: 10.1186/s40104-021-00584-0
Weaning-associated feed deprivation stress causes microbiota disruptions in a novel mucin-containing in vitro model of the piglet colon (MPigut-IVM)
Abstract
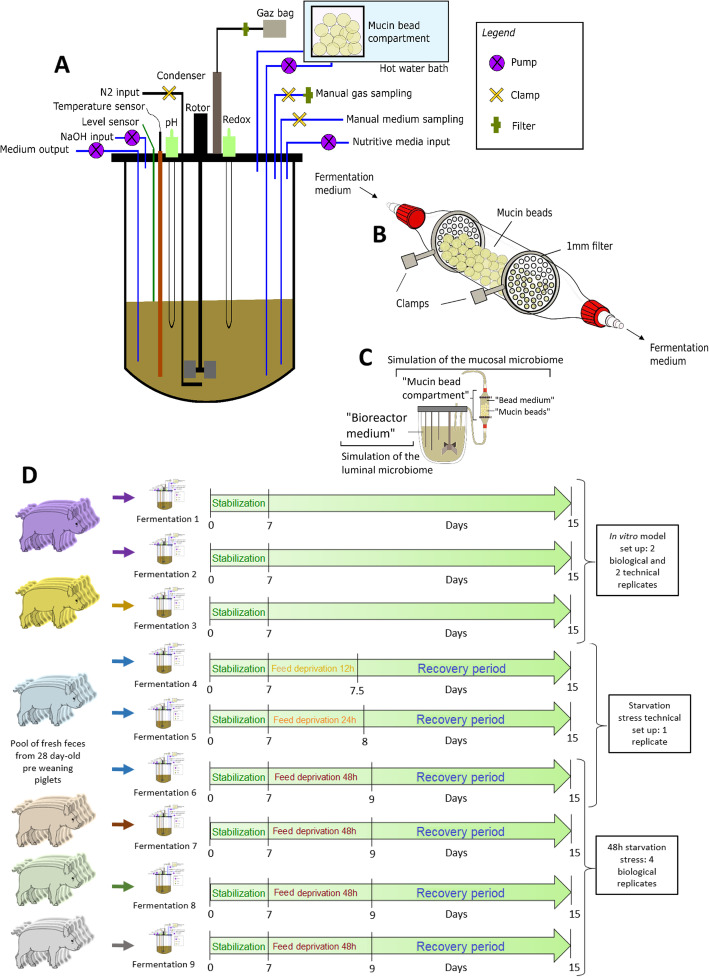
Background: Risk factors for the etiology of post-weaning diarrhea, a major problem in swine industry associated with enormous economic losses, remain to be fully elucidated. In concordance with the ethical concerns raised by animal experiments, we developed a new in vitro model of the weaning piglet colon (MPigut-IVM) including a mucin bead compartment to reproduce the mucus surface from the gut to which gut microbes can adhere.
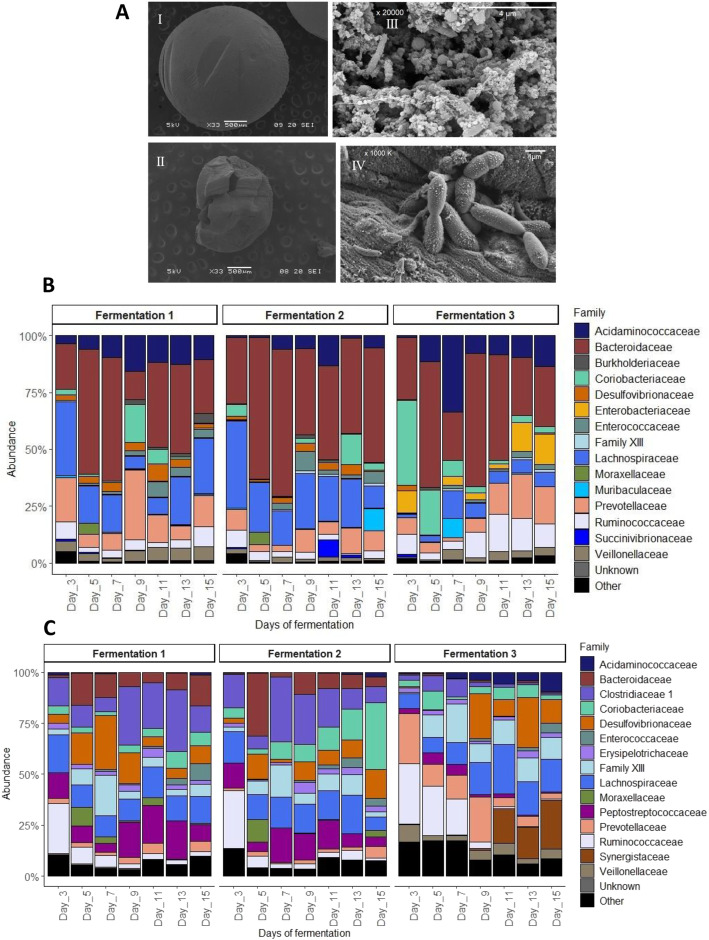
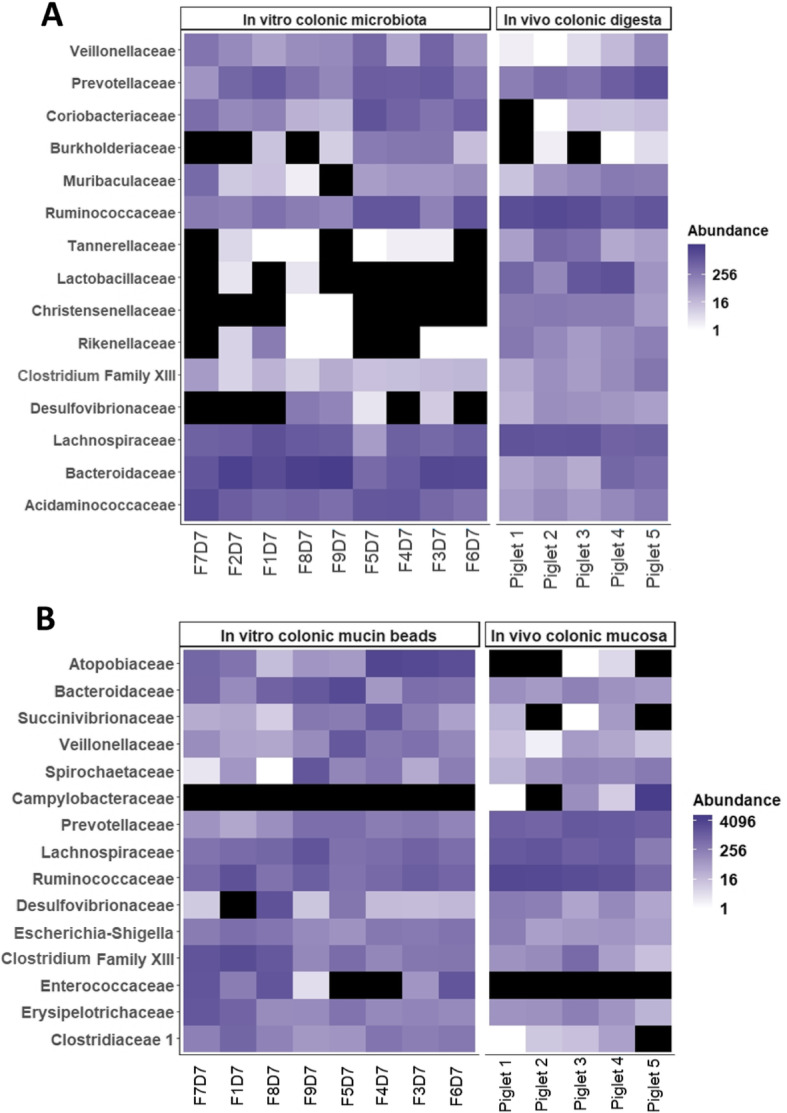
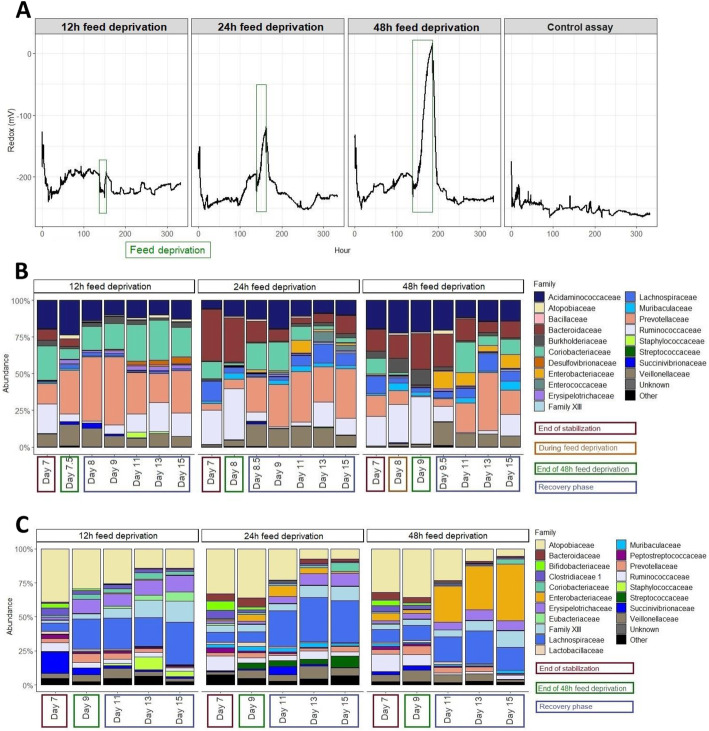
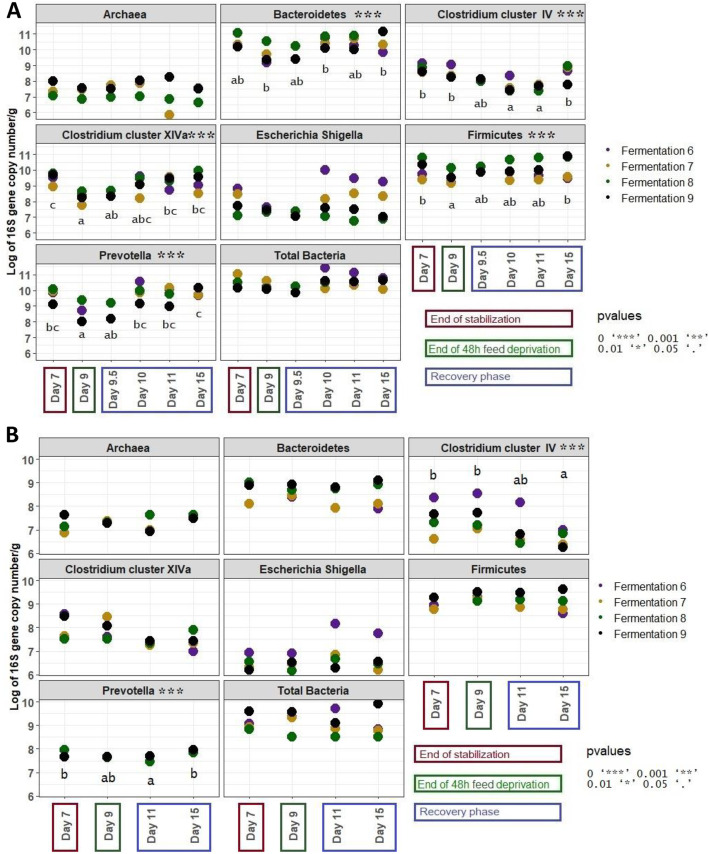
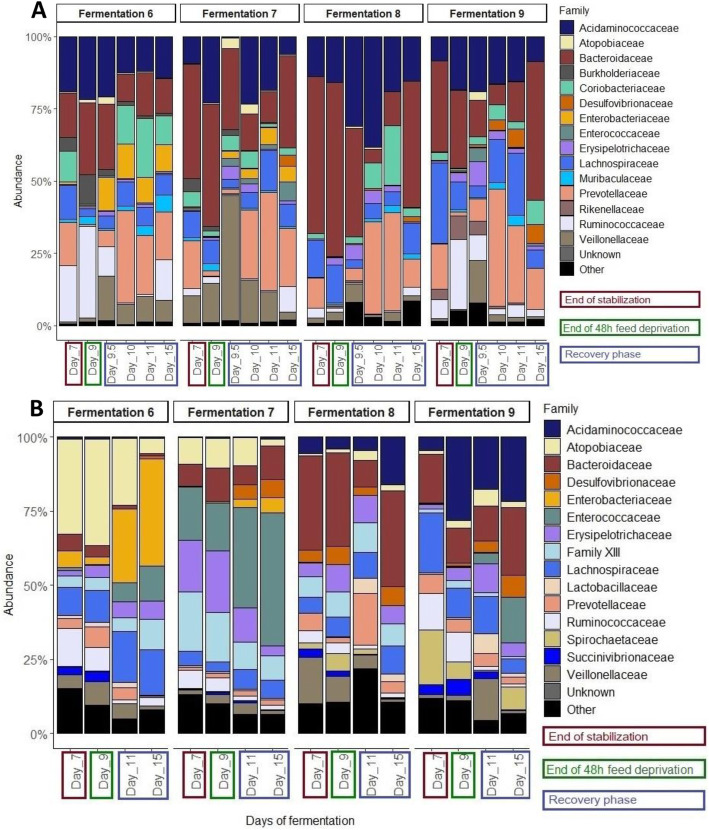
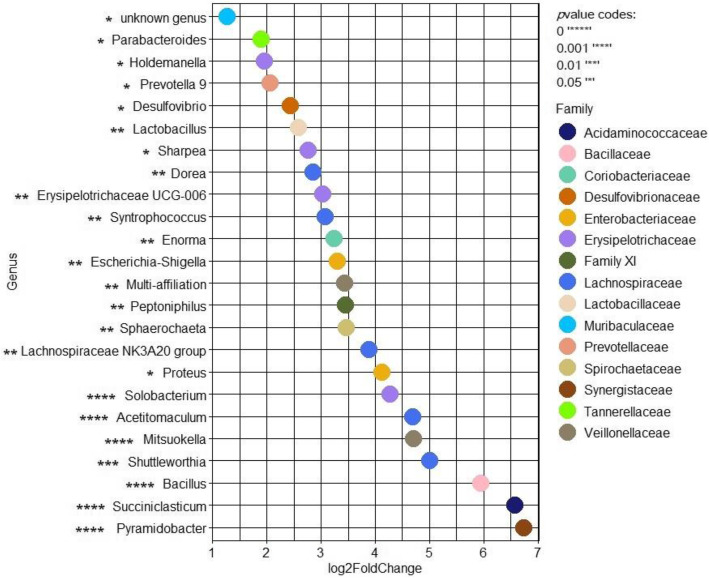
Results: Our results indicated that the MPigut-IVM is able to establish a representative piglet archaeal and bacterial colon microbiota in terms of taxonomic composition and function. The MPigut-IVM was consequently used to investigate the potential effects of feed deprivation, a common consequence of weaning in piglets, on the microbiota. The lack of nutrients in the MPigut-IVM led to an increased abundance of Prevotellaceae and Escherichia-Shigella and a decrease in Bacteroidiaceae and confirms previous in vivo findings. On top of a strong increase in redox potential, the feed deprivation stress induced modifications of microbial metabolite production such as a decrease in acetate and an increase in proportional valerate, isovalerate and isobutyrate production.
Conclusions: The MPigut-IVM is able to simulate luminal and mucosal piglet microbiota and represent an innovative tool for comparative studies to investigate the impact of weaning stressors on piglet microbiota. Besides, weaning-associated feed deprivation in piglets provokes disruptions of MPigut-IVM microbiota composition and functionality and could be implicated in the onset of post-weaning dysbiosis in piglets.
Keywords: Colon; Dysbiosis; In vitro gut model; Microbiota; Mucin; Piglet; Weaning.
Conflict of interest statement
D.C.F. is employee of Lallemand SAS. The other authors declare that the research was conducted in the absence of any commercial or financial relationships that could be construed as a potential conflict of interest.
Figures


Similar articles
-
Pathogen Challenge and Dietary Shift Alter Microbiota Composition and Activity in a Mucin-Associated in vitro Model of the Piglet Colon (MPigut-IVM) Simulating Weaning Transition.Front Microbiol. 2021 Jul 19;12:703421. doi: 10.3389/fmicb.2021.703421. eCollection 2021. Front Microbiol. 2021. PMID: 34349744 Free PMC article.
-
Saccharomyces Cerevisiae Var Boulardii CNCM I-1079 Reduces Expression of Genes Involved in Inflammatory Response in Porcine Cells Challenged by Enterotoxigenic E. Coli and Influences Bacterial Communities in an In Vitro Model of the Weaning Piglet Colon.Antibiotics (Basel). 2021 Sep 11;10(9):1101. doi: 10.3390/antibiotics10091101. Antibiotics (Basel). 2021. PMID: 34572682 Free PMC article.
-
Lythrum salicaria L. herb and gut microbiota of healthy post-weaning piglets. Focus on prebiotic properties and formation of postbiotic metabolites in ex vivo cultures.J Ethnopharmacol. 2020 Oct 28;261:113073. doi: 10.1016/j.jep.2020.113073. Epub 2020 Jul 14. J Ethnopharmacol. 2020. PMID: 32673710
-
Gut Microbiota Dysbiosis in Postweaning Piglets: Understanding the Keys to Health.Trends Microbiol. 2017 Oct;25(10):851-873. doi: 10.1016/j.tim.2017.05.004. Epub 2017 Jun 8. Trends Microbiol. 2017. PMID: 28602521 Review.
-
Fine-tuning of post-weaning pig microbiome structure and functionality by in-feed zinc oxide and antibiotics use.Front Cell Infect Microbiol. 2024 Feb 7;14:1354449. doi: 10.3389/fcimb.2024.1354449. eCollection 2024. Front Cell Infect Microbiol. 2024. PMID: 38384302 Free PMC article. Review.
Cited by
-
Metasilicate-based alkaline mineral water improves the growth performance of weaned piglets by maintaining gut-liver axis homeostasis through microbiota-mediated secondary bile acid pathway.Anim Nutr. 2024 Nov 2;20:95-109. doi: 10.1016/j.aninu.2024.09.003. eCollection 2025 Mar. Anim Nutr. 2024. PMID: 39949730 Free PMC article.
-
Transcriptomic analysis of the interactions between Fibrobacter succinogenes S85, Selenomonas ruminantium PC18 and a live yeast strain used as a ruminant feed additive.BMC Genomics. 2025 Aug 4;26(1):721. doi: 10.1186/s12864-025-11894-2. BMC Genomics. 2025. PMID: 40760470 Free PMC article.
-
Targeting mitochondria with antioxidant nutrients for the prevention and treatment of postweaning diarrhea in piglets.Anim Nutr. 2023 Oct 5;15:275-287. doi: 10.1016/j.aninu.2023.09.002. eCollection 2023 Dec. Anim Nutr. 2023. PMID: 38033610 Free PMC article. Review.
-
Cultivating complexity: Advancements in establishing in vitro models for the mucus-adhering gut microbiota.Microb Biotechnol. 2024 Oct;17(10):e70036. doi: 10.1111/1751-7915.70036. Microb Biotechnol. 2024. PMID: 39435730 Free PMC article. Review.
-
Effects of dietary supplementation of bacteriophage cocktail on health status of weanling pigs in a non-sanitary environment.J Anim Sci Biotechnol. 2023 May 8;14(1):64. doi: 10.1186/s40104-023-00869-6. J Anim Sci Biotechnol. 2023. PMID: 37150809 Free PMC article.
References
-
- Gresse R, Chaucheyras-Durand F, Fleury MA, Van de Wiele T, Forano E, Blanquet-Diot S. Gut microbiota dysbiosis in postweaning piglets: understanding the keys to health. Trends Microbiol. 2017;25(10):851–73. 10.1016/j.tim.2017.05.004. - PubMed
LinkOut - more resources
Full Text Sources
