Review
. 2021 Apr:123:73-93.
doi: 10.1016/j.pnmrs.2021.03.002. Epub 2021 Mar 26.

Silent zero TE MR neuroimaging: Current state-of-the-art and future directions

Affiliations
Review

Silent zero TE MR neuroimaging: Current state-of-the-art and future directions

Emil Ljungberg et al. Prog Nucl Magn Reson Spectrosc. 2021 Apr.

Abstract

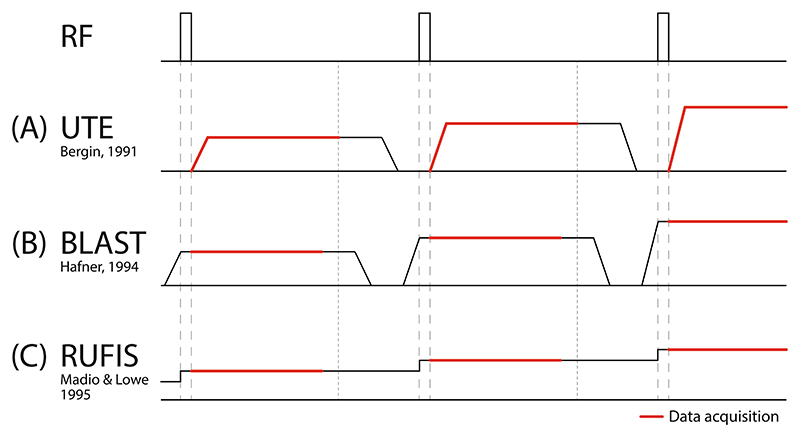
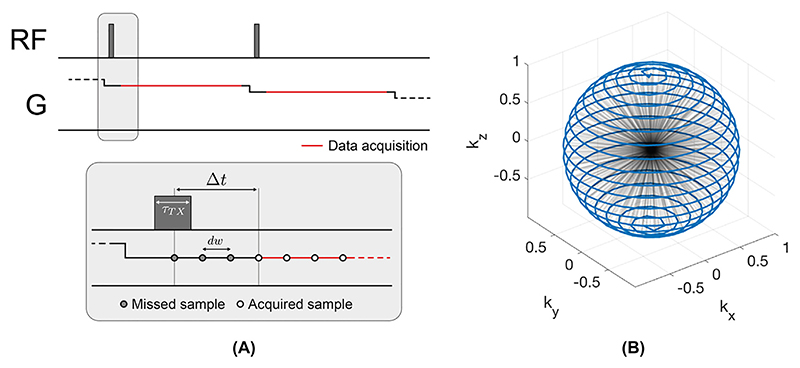
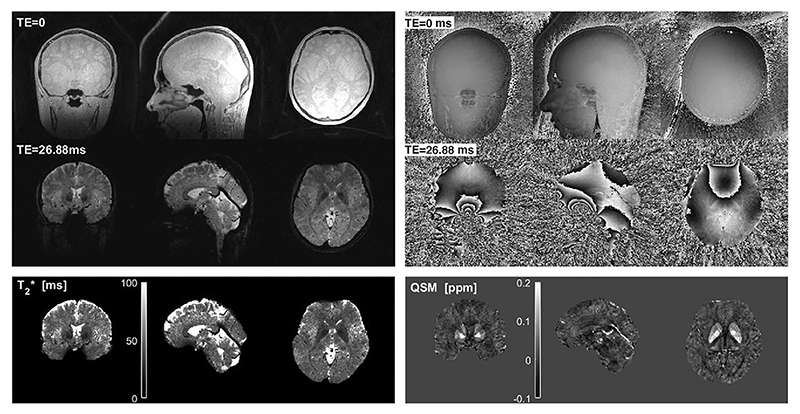
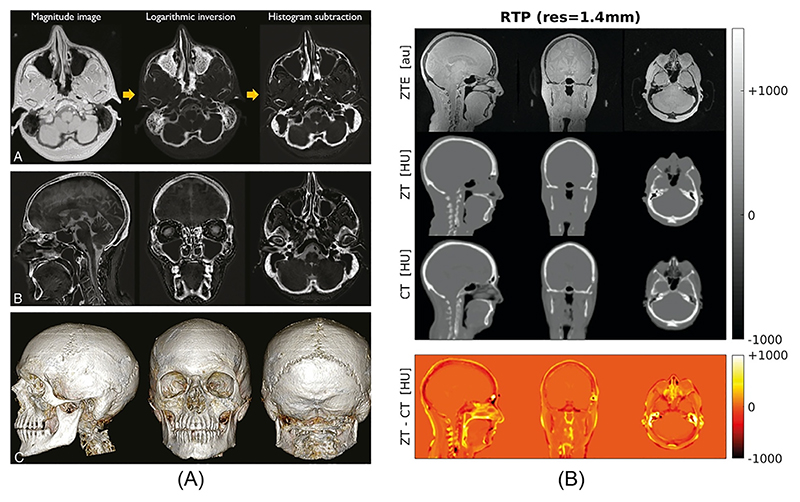
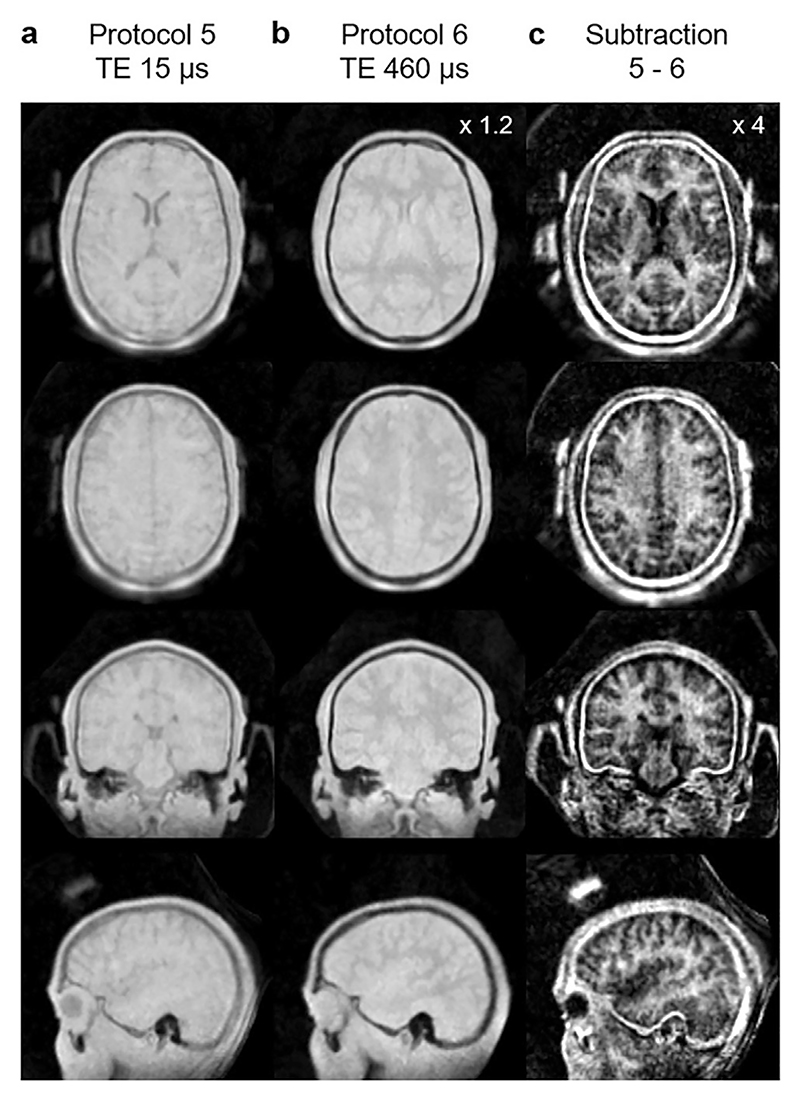
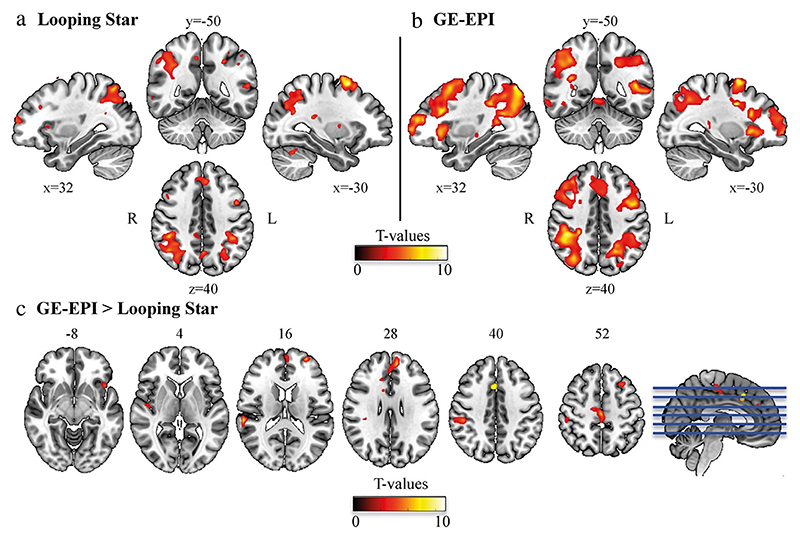
Magnetic Resonance Imaging (MRI) scanners produce loud acoustic noise originating from vibrational Lorentz forces induced by rapidly changing currents in the magnetic field gradient coils. Using zero echo time (ZTE) MRI pulse sequences, gradient switching can be reduced to a minimum, which enables near silent operation.Besides silent MRI, ZTE offers further interesting characteristics, including a nominal echo time of TE = 0 (thus capturing short-lived signals from MR tissues which are otherwise MR-invisible), 3D radial sampling (providing motion robustness), and ultra-short repetition times (providing fast and efficient scanning).In this work we describe the main concepts behind ZTE imaging with a focus on conceptual understanding of the imaging sequences, relevant acquisition parameters, commonly observed image artefacts, and image contrasts. We will further describe a range of methods for anatomical and functional neuroimaging, together with recommendations for successful implementation.

Keywords: Neuroimaging; Silent MRI; Zero Echo Time (ZTE).


Conflict of interest statement

Declaration of Competing Interest The authors declare the following financial interests/personal relationships which may be considered as potential competing interests: FW and ABS: employees of General Electric Healthcare. GJB receives honoraria from GE Healthcare for teaching. EL, NLD, TCW, DJL, FZ, SCRW: None.

Figures

Fig. 1
Fig. 1
Simplified pulse sequences diagrams showing RF excitation and gradients in one dimension for (A) UTE, (B) BLAST and (C) RUFIS. In UTE imaging, RF excitation is performed prior to the readout gradients. In the BLAST pulse sequence, gradients are ramped up before RF excitation and ramped down after readout. In RUFIS, RF excitation is performed with the gradient on, as in BLAST, but without returning gradients to zero between excitations, hence minimizing gradient switching and allowing silent imaging.
Fig. 2
Fig. 2
(A) Simplified ZTE pulse sequence diagram with two spokes, showing RF excitation and the gradient waveform on one axis together with magnification of the RF excitation part of the spoke, showing the dead-time gap Δt after RF excitation. (B) 3D view of spoke distribution in k-space with the endpoints of each spoke connected by the blue line.
Fig. 3
Fig. 3
Example of a dataset reconstructed with and without WASPI to fill the centre of k-space. A clear low spatial frequency artefact appears across the image without WASPI, resulting in erroneous image contrast, especially visible in the lateral ventricles (yellow arrows) and the sinuses (red arrows). Data were acquired with a readout bandwidth of ±31.25 kHz.
Fig. 4
Fig. 4
An example of how motion artefacts manifest as blurring and streaking in ZTE, while in Cartesian SPGR they produce ghosting in the phase-encode direction. Reproduced with permission from Ref. [82].
Fig. 5
Fig. 5
(A) Gradient waveform structure of a Looping Star sequence with 8 spokes per loop (NSPL) and 2 loops (NLoops), showing the RF and data acquisition (DAQ) scheme for the original (Org.) and coherence resolved (CR) versions of Looping Star. (B) and (C) illustrates the spin coherences for the two versions of Looping Star at four different timepoints during the sequence. The grey shaded region indicates nominal field of view in k-space as defined by the desired image resolution; coherences outside this region (faded arrows) are considered to be dephased and not contributing to the image.
Fig. 6
Fig. 6
(A) Pulse sequence diagram of a single echo gradient refocused ZTE-BURST sequence, with the TE for each coherence indicated by the correspondingly coloured arrow. (B) Visualization of the evolution of the four coherences through the first and second train. The grey circle illustrates the nominal coverage in k-space as determined by the image resolution. K-space sampling is here illustrated in 2D for simplicity, while in practice it is performed in 3D.
Fig. 7
Fig. 7
Comparison of anatomical T1-weighted imaging between Cartesian IR-SPGR using the GE BRAVO (Brain Volume imaging) sequence and ZTE acquired using the MP2RAGE formalism. T1 map is obtained from the ZTE-MP2RAGE acquisition. Acquisition parameters in Ref. [99].
Fig. 8
Fig. 8
Example of IR-ZTE dataset reconstructed with and without Deep Learning denoising (DL vs. Std). With DL denoising, the image noise is clearly reduced while still maintaining image resolution and sharpness. White arrows indicate signal from the head rest.
Fig. 9
Fig. 9
Quantitative PD, T1 and T2 maps obtained using a multi-parametric ZTE sequence together with synthetic contrast weighted psIR and T2 FLAIR images. Acquisition parameters: FOV = 20 × 20 × 16 cm3, resolution = 1 × 1 × 1 mm3, TR = 1.8 ms, BWRX = ±31.25 kHz, TE T2Prep=80 ms, 256 spokes per segment. FA = 3° for multi-parametric part and FA = 1° for PD volume. Total acquisition time was 6:35 min. The T1 map and T2 map have been head masked using the PD volume. Abbreviations: inv PD – inverse PD, psIR – phase sensitive inversion recovery, FLAIR – fluid attenuated inversion recovery. Images have been cropped to head coverage. Fig. 10 shows the PD data reconstructed at twice the prescribed field of view. (Images generated with data from Ref [114]).
Fig. 10
Fig. 10
Proton density (PD) image from Fig. 9 reconstructed with twice the field of view, i.e., the fully encoded field of view from the twofold radial oversampling. White arrows highlight part of the receive coil only visible when reconstructed at twice the field of view.
Fig. 11
Fig. 11
DW-ZTE (A-C) and DW-EPI (D) with b = 600 s/mm2. (A) and (B) demonstrate the eddy current artefacts, which are eliminated when combined in (C). Arrows highlights areas with distortion artefacts in DW-EPI that were not present in the DW-ZTE data. Reproduced with permission of John Wiley and Sons from Ref. [69], © 2019 International Society for Magnetic Resonance in Medicine.
Fig. 12
Fig. 12
Examples of different MT contrasts acquired with a ZTE sequence. The ihMTR and ihMTRinv images show high sensitivity and specificity to myelin (Abbreviations: PDw – Proton Density weighted, T1w – T1 weighted, MTw – MT weighted, eMTw – enhanced MT weighted, with dual-sided saturation, MTR – Magnetization Transfer Ratio, eMTR – enhanced MT Ratio, ihMTR – inhomogeneous MTR, the difference between eMTR and MTR, ihMTRinv – inverse ihMTR using the T1w image as a reference instead of the PDw image). Reproduced with permission from Ref. [129] licensed under a CC BY 4.0 license. Figure has been cropped; original figure also contains a row with coefficient of variation.
Fig. 13
Fig. 13
Example of ZTE-MRA (B and E) compared to computed tomography angiogram (CTA) (A and D) and TOF (C and F). Top row shows volume rendering and bottom row maximum intensity projection. Image shows a stenosis in a 74-year-old male patient. CTA estimated a 34% stenosis, ZTE estimated 32%, while TOF overestimated the stenosis to 72%. Republished with permission of American Society of Neuroradiology from Ref. [68]; permission conveyed through Copyright Clearance Center, Inc.
Fig. 14
Fig. 14
Example of T2* and QSM imaging with Looping Star. Reproduced with permission of John Wiley and Sons from Ref. [71] and adapted to highlight the TE in the right panel. © 2018 International Society for Magnetic Resonance in Medicine.
Fig. 15
Fig. 15
Ultra-short T2 PD imaging with ZTE. (A) Skull segmentation. Republished with permission of the American Society of Neuroradiology from Ref. [146]; permission conveyed through Copyright Clearance Center, Inc. (B) Generation of pseudo CT images from ZTE in Hounsfield units, compared to acquired CT (Abbreviations: ZT – ZTE-derived pseudo-CT, RTP – Radiation Therapy Planning, Res – Resolution, HU – Hounsfield Units). Reproduced with permission of John Wiley and Sons from Ref. [147], © 2018 International Society for Magnetic Resonance in Medicine.
Fig. 16
Fig. 16
Direct myelin imaging with ZTE by Weiger et al. Subtraction of two images with different effective TE yields a qualitative image with contrast between white and grey matter. Reproduced with permission of Elsevier from Ref. [77] under a CC BY-NC-ND 4.0 license.
Fig. 17
Fig. 17
Images from Dionisio-Parra et al. showing second-level results from an N-back working memory task using (a) Looping Star and (b) Gradient Echo (GE) EPI. (c) Results from a paired t-test between the two techniques. Reproduced with permission of John Wiley and Sons from Ref. [72], under a CC BY-NC 4.0 license.

Similar articles

Cited by

References

    1. Mansfield P, Glover PM, Beaumont J. Sound generation in gradient coil structures for MRI. Magn Reson Med. 1998;39:539–550. doi: 10.1002/mrm.1910390406. - DOI - PubMed
    1. McJury MJ. Acoustic noise levels generated during high field MR imaging. Clin Radiol. 1995;50:331–334. doi: 10.1016/S0009-9260(05)83427-0. - DOI - PubMed
    1. Jin C, Li H, Li X, Wang M, Liu C, Guo J, Yang J. Temporary hearing threshold shift in healthy volunteers with hearing protection caused by acoustic noise exposure during 3-T multisequence MR neuroimaging. Radiology. 2018;286:602–608. doi: 10.1148/radiol.2017161622. - DOI - PubMed
    1. Mcjury M, Shellock FG. Auditory Noise Associated With MR Procedures: A Review. J Magn Reson Imaging. 2000;12:37–45. doi: 10.1002/1522-2586(200007)12:1<37∷AID-JMRI5>3.0.CO;2-I. - DOI - PubMed
    1. Foster JR, Hall DA, Summerfield AQ, Palmer AR, Bowtell RW. Sound-level measurements and calculations of safe noise dosage during EPI at 3 T. J Magn Reson Imaging. 2000;12:157–163. doi: 10.1002/1522-2586(200007)12:1<157∷AID-JMRI17>3.0.CO;2-M. - DOI - PubMed

Publication types

LinkOut - more resources