. 2021 Jun 2;7(23):eabf6251.
doi: 10.1126/sciadv.abf6251. Print 2021 Jun.

Live imaging of chromatin distribution reveals novel principles of nuclear architecture and chromatin compartmentalization

Affiliations

Live imaging of chromatin distribution reveals novel principles of nuclear architecture and chromatin compartmentalization

Daria Amiad-Pavlov et al. Sci Adv. .

Abstract

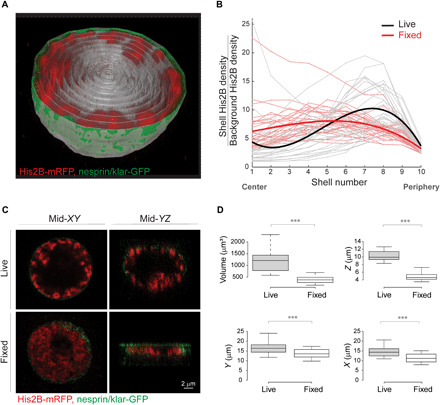
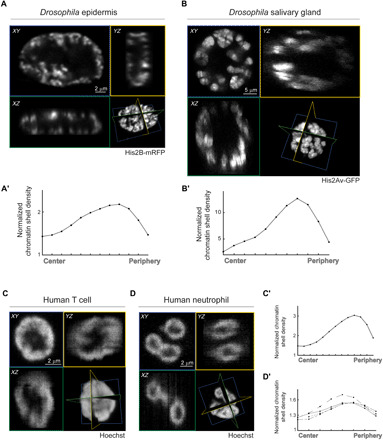
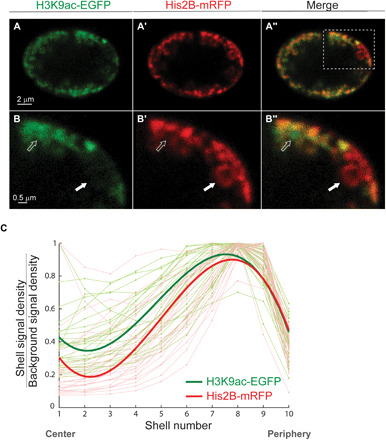
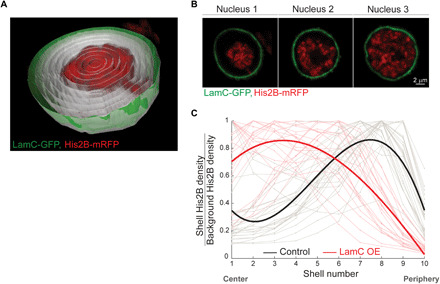
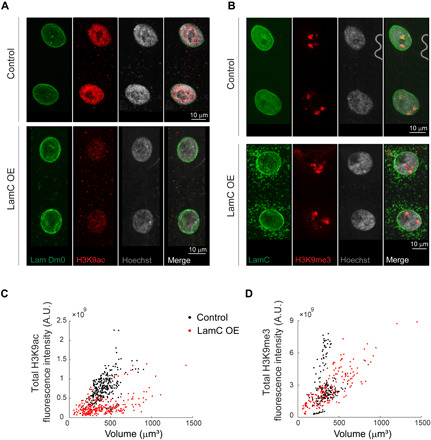
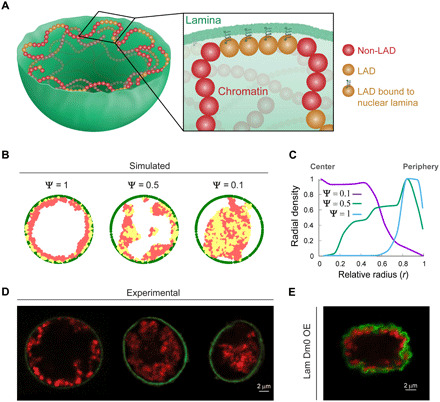
The three-dimensional organization of chromatin contributes to transcriptional control, but information about native chromatin distribution is limited. Imaging chromatin in live Drosophila larvae, with preserved nuclear volume, revealed that active and repressed chromatin separates from the nuclear interior and forms a peripheral layer underneath the nuclear lamina. This is in contrast to the current view that chromatin distributes throughout the nucleus. Furthermore, peripheral chromatin organization was observed in distinct Drosophila tissues, as well as in live human effector T lymphocytes and neutrophils. Lamin A/C up-regulation resulted in chromatin collapse toward the nuclear center and correlated with a significant reduction in the levels of active chromatin. Physical modeling suggests that binding of lamina-associated domains combined with chromatin self-attractive interactions recapitulate the experimental chromatin distribution profiles. Together, our findings reveal a novel mode of mesoscale organization of peripheral chromatin sensitive to lamina composition, which is evolutionary conserved.


Figures

Fig. 1
Fig. 1. Peripheral chromatin organization in live Drosophila larva muscle nuclei, not detected in fixed nuclei.
(A) 3D view of a single live muscle nucleus cut through the middle. Chromatin is labeled with His2B-mRFP (red) and nuclear envelope with nesprin/klar-GFP (green). For quantification of radial chromatin distribution, the segmented nucleus is divided into 10 concentric 3D radial shells (gray). (B) His2B fluorescent signal density for each shell, normalized by the background signal density, is plotted from center to periphery. The resulting radial chromatin distribution profile demonstrates peripheral trend in live nuclei (individual nuclei in gray, fitted average in bold black, n = 27), which is significantly different from the more uniform radial chromatin distribution profile in fixed preparations (individual nuclei in light red, fitted average in bold red, n = 30; P < 0.001). (C) Mid-confocal XY plane of a representative nucleus from live, intact larva shows that chromatin is organized at the periphery of the nucleus (top left), whereas in a representative nucleus from a fixed preparation, chromatin is expanded into most of the nuclear space (bottom left). Mid-YZ plane of the live nucleus demonstrates preserved ellipsoid shape and peripheral chromatin (top right), whereas the mid-YZ plane from the fixed nucleus reveals substantial flattening and altered chromatin organization (bottom right). (D) Significant reduction (***P < 0.001) in nuclear volume, as well as in the short, middle, and long nuclear dimensions in fixed preparations (n = 30) compared to live (n = 27).
Fig. 2
Fig. 2. Peripheral chromatin organization observed with His2Av and analysis of chromatin and nucleolus volumes relative to nuclear volume.
(A, A′, and A″) Colabeling of a live muscle nucleus with two independent histone labels, His2Av-GFP (A) and His2B-mRFP (A′), shows high colocalization (A″), supporting peripheral chromatin organization. (B, B′, and B″) Live muscle nucleus colabeled with His2Av-GFP (B) and NLS-mCherry (B′). (C) Representative 3D segmentation of the nuclear volume (white), chromatin volume (green), and nucleolar volume (red) in large or small nuclei. (D) Linear scaling between chromatin (green) and nucleolar (red) volumes with the corresponding nuclear volume (R2 = 0.89 and R2 = 0.86, respectively, linear mixed-effect model). Chromatin and the nucleolus occupy 31 and 8% of the nuclear volume, respectively, leaving 61% remaining nucleoplasm space.
Fig. 3
Fig. 3. Peripheral chromatin distribution in additional larval tissues and in non-Drosophila models.
Mid-XY (blue), -XZ (green), and -YZ (yellow) sections of Drosophila larva epidermal nucleus labeled with His2B-mRFP (A), salivary gland nucleus labeled with His2Av-GFP (B), human T cell nucleus (C), and human neutrophil nucleus (D), labeled with Hoechst. (A′ to D′) His2B or Hoechst fluorescent signal density for each shell, normalized by the background signal density, is plotted from center to periphery for each of the depicted nuclei. For the human neutrophile, radial profile is presented separately for each lobe.
Fig. 4
Fig. 4. Live labeling of active chromatin regions shows spatial overlap with His2B-mRFP–labeled chromatin compartment at the nuclear periphery.
(A) H3K9ac-EGFP mintbody expressed in the live larva muscle nucleus demonstrates peripheral distribution of the euchromatin, similar to the His2B-mRFP spatial distribution of the total chromatin. (A′) Merged image of active and total chromatin (A″); boxed area is enlarged in the bottom (B, B′, and B″). Solid white arrow points to a dense heterochromatin with strong His2B-mRFP signal (B′) and weak H3K9ac-EGFP (B). Hollow arrow points to an active region with strong H3K9ac-EGFP signal and diffused chromatin emphasized by weak His2B-mRFP. These regions coexist in the same radial layer but at different positions perpendicular to the radial direction. (C) H3K9ac (light green) and His2B (light red) signal density for each shell, normalized by background signal density, is plotted from center to periphery. Each light line represents a single nucleus, with signal normalized to maximum value (n = 27). Bold lines represent the fitted average, with peak signal at the periphery of the nucleus for both active and overall chromatin.
Fig. 5
Fig. 5. Lamin A/C OE in the Drosophila larva muscle disrupts peripheral chromatin localization, driving chromatin condensation toward the center of the nucleus.
(A) 3D view of a live nucleus, overexpressing lamin C, cut through the middle. Chromatin is labeled with His2B-mRFP and nuclear envelope with lamin C–GFP. The segmented nucleus is divided into 10 concentric 3D radial shells (gray) for quantification of radial chromatin distribution. (B) Variable phenotypes of chromatin distribution in lamin C OE nuclei from different muscles. (C) His2B signal density for each shell, normalized by background signal density, is plotted from center to periphery. Each individual line was normalized to its maximum value. The resulting radial chromatin density profile demonstrates the trend toward central localization in the live lamin C OE group (individual nuclei in light red and fitted average in bold red; n = 23), compared with the peripheral trend in live control nuclei (individual nuclei in gray and fitted average in bold black; n = 27).
Fig. 6
Fig. 6. Temporal lamin A/C OE associates with decreased density of the active H3K9ac epigenetic mark.
Muscle nuclei labeled with lamin Dm0, H3K9ac, and Hoechst show reduced intensity of the active mark in the temporal lamin C OE group (A). Muscle nuclei labeled with lamin C, H3K9me3, and Hoechst show preserved intensity of the repressive mark between the control and temporal lamin C OE groups (B). Quantification of the total nuclear fluorescence intensity versus nuclear volume demonstrates reduced H3K9ac density (slope; P < 0.001) in the temporal Lamin C OE group (red; n = 288) versus control (black; n = 281) (C) and preserved H3K9me3 density (slope; P = 0.42) between temporal lamin C OE (red, n = 181) and control groups (black; n = 171) (D). Nuclei for each group were pulled from 5 to 6 different larvae and 8 to 10 different muscles in each larva. A.U., arbitrary units.
Fig. 7
Fig. 7. Simulations of 3D chromatin polymer model suggest governing principles for global chromatin organization and its dependence on LAD–nuclear lamina interactions.
(A) Chromatin is described by a semiflexible, bead-spring polymer model that is confined to a sphere, with non-LAD (red) and LAD (yellow) chromatin beads. Yellow LAD beads bound to the lamina are represented with a spring. (B) Simulated results of chromatin concentration maps (LAD in yellow and non-LAD in red) confined within the nuclear lamina (green) for decreasing (left to right) fraction of LADs bound to nuclear lamina (ψ). Equatorial plane of the spherical model nucleus is shown. (C) Mean simulated radial chromatin density profiles describe a shift in chromatin distribution, from periphery to the center, with ψ decrease from 1 to 0.5 to 0.1. (D) Mid-XY planes of experimental live larva muscle nuclei show similar trend in chromatin shift from peripheral distribution (left; control), to more central chromatin distribution in lamin C OE (middle and left; intermediate and strong phenotype, respectively). (E) Experimental OE of lamin Dm0–GFP in larval muscle does not show chromatin collapse phenotype and preserves peripheral chromatin organization despite substantial deformations in the nuclear lamina.

References

    1. Lakadamyali M., Cosma M. P., Visualizing the genome in high resolution challenges our textbook understanding. Nat. Methods 17, 371–379 (2020). - PubMed
    1. Ricci M. A., Manzo C., García-Parajo M. F., Lakadamyali M., Cosma M. P., Chromatin fibers are formed by heterogeneous groups of nucleosomes in vivo. Cell 160, 1145–1158 (2015). - PubMed
    1. Ou H. D., Phan S., Deerinck T. J., Thor A., Ellisman M. H., O’Shea C. C., ChromEMT: Visualizing 3D chromatin structure and compaction in interphase and mitotic cells. Science 357, eaag0025 (2017). - PMC - PubMed
    1. Bajpai G., Padinhateeri R., Irregular chromatin: Packing density, fiber width, and occurrence of heterogeneous clusters. Biophys. J. 118, 207–218 (2020). - PMC - PubMed
    1. Cremer T., Cremer C., Chromosome territories, nuclear architecture and gene regulation in mammalian cells. Nat. Rev. Genet. 2, 292–301 (2001). - PubMed

Publication types

LinkOut - more resources