. 2021 Jun 2;7(23):eabg4126.
doi: 10.1126/sciadv.abg4126. Print 2021 Jun.

Epigenomic landscape and 3D genome structure in pediatric high-grade glioma

Affiliations

Epigenomic landscape and 3D genome structure in pediatric high-grade glioma

Juan Wang et al. Sci Adv. .

Abstract

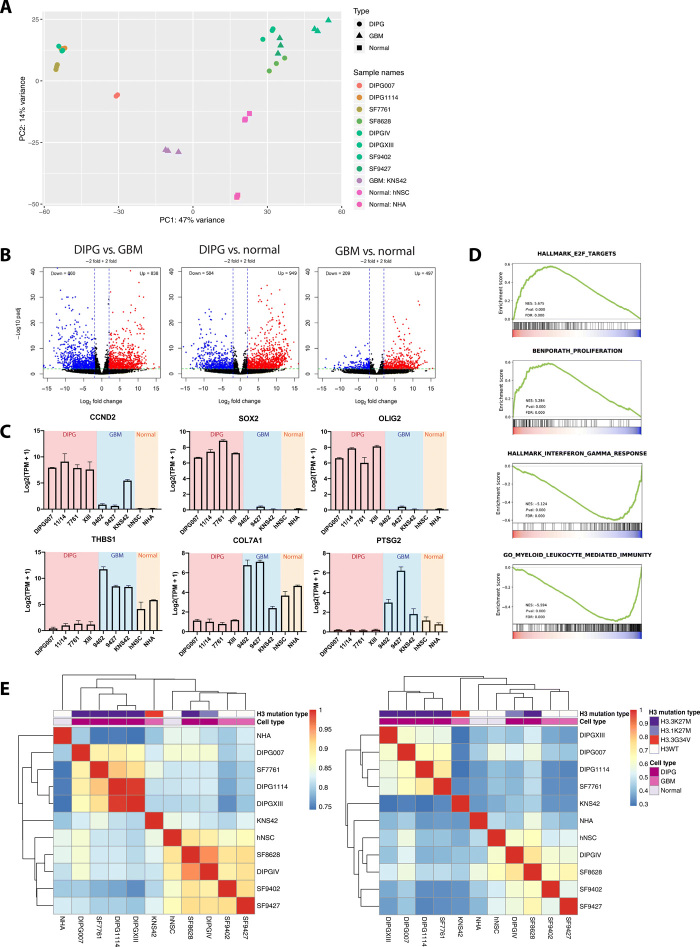
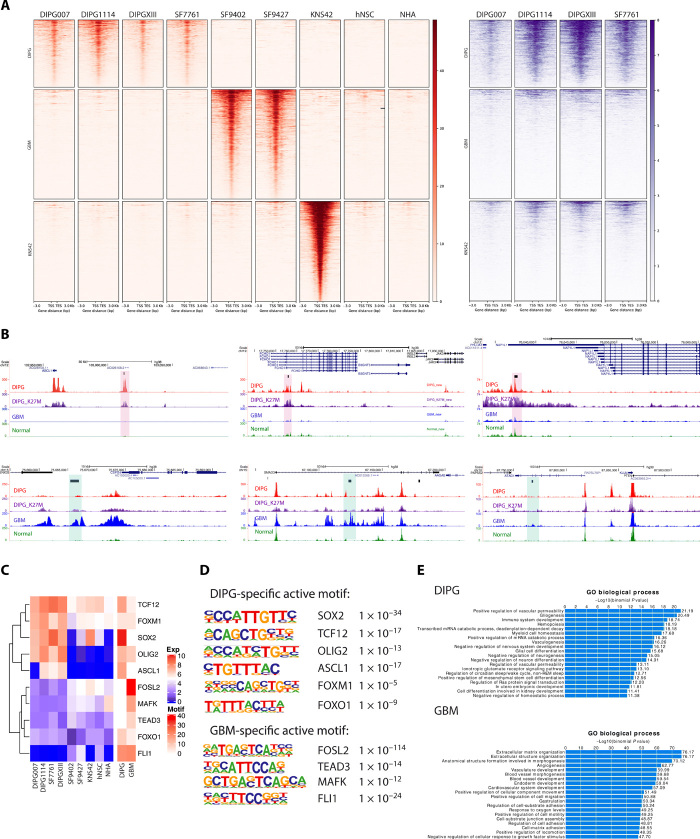
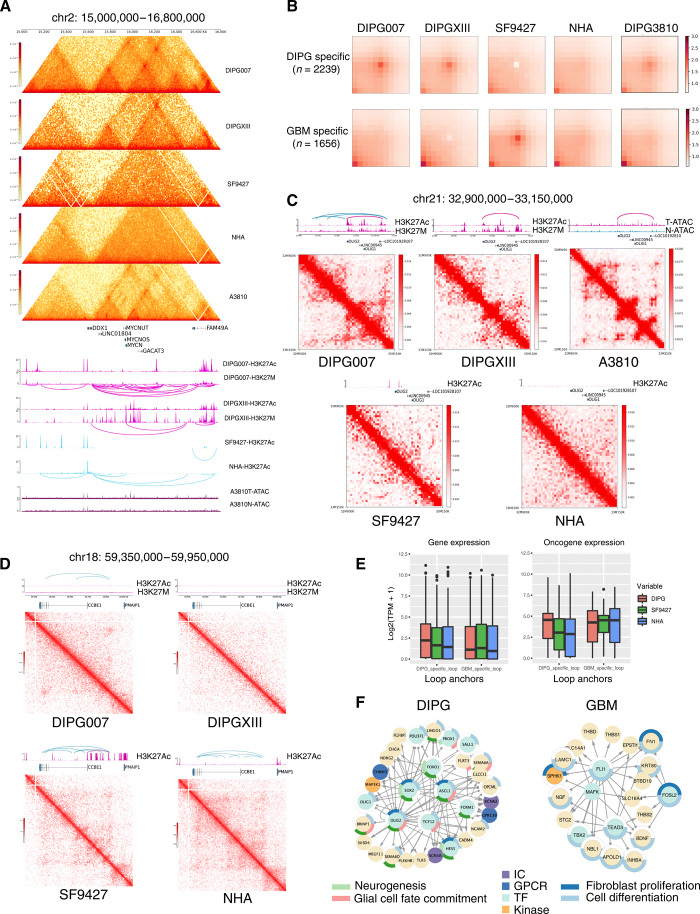
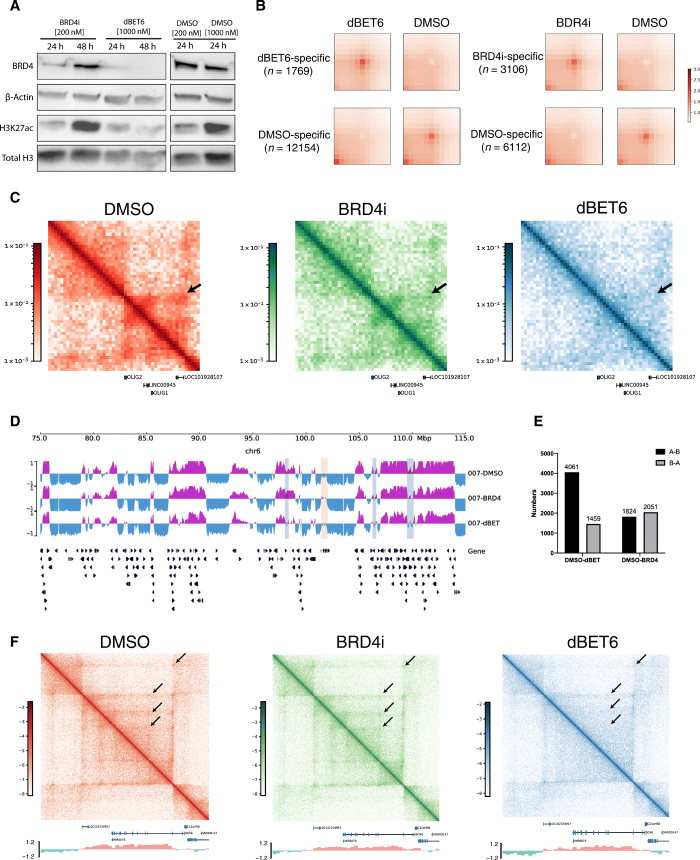
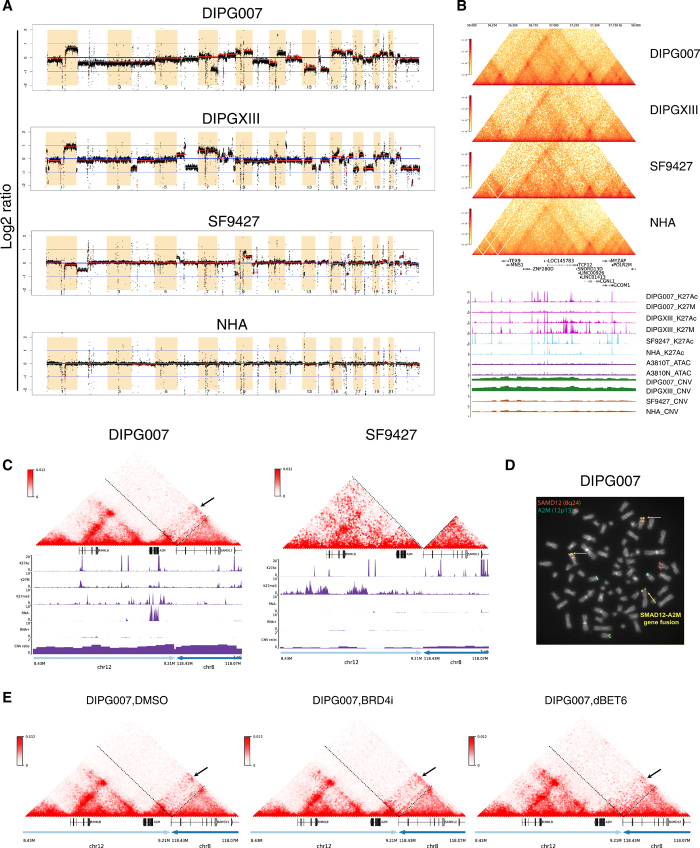
Pediatric high-grade gliomas (pHGGs), including glioblastoma multiforme (GBM) and diffuse intrinsic pontine glioma (DIPG), are morbid brain tumors. Even with treatment survival is poor, making pHGG the number one cause of cancer death in children. Up to 80% of DIPGs harbor a somatic missense mutation in genes encoding histone H3. To investigate whether H3K27M is associated with distinct chromatin structure that alters transcription regulation, we generated the first high-resolution Hi-C maps of pHGG cell lines and tumor tissue. By integrating transcriptome (RNA-seq), enhancer landscape (ChIP-seq), genome structure (Hi-C), and chromatin accessibility (ATAC-seq) datasets from H3K27M and wild-type specimens, we identified tumor-specific enhancers and regulatory networks for known oncogenes. We identified genomic structural variations that lead to potential enhancer hijacking and gene coamplification, including A2M, JAG2, and FLRT1 Together, our results imply three-dimensional genome alterations may play a critical role in the pHGG epigenetic landscape and contribute to tumorigenesis.


Figures

Fig. 1
Fig. 1. DIPG and GBM cells harbor distinct transcriptomes corresponding with H3K27ac enhancer enrichment.
(A) PCA of cell transcriptome data: Unsupervised clustering of technical replicates (n = 3) and diagnosis (DIPG, n = 6; GBM, n = 3; normal, n = 2). PC, principal component. (B) Differentially expressed genes (DEGs) between DIPG, GBM, and normal cell lines. Red, up-regulated relative to normal cell lines; blue, down-regulated (P < 0.01, |log2FC| ≥ 2). (C) Differentially expressed genes between DIPG and GBM cell lines. Y axis = expression level for each gene [log2(TPM + 1)]. TPM, transcripts per million. (D) Gene Set Enrichment Analysis (GSEA) of cell transcriptomes: Increased E2F signaling and repression of cell proliferation and immune response pathways in DIPG versus GBM. Signal-to-noise ratio was used to rank the genes per correlation with DIPG (red) or GBM (blue). Green curve = enrichment score. Normalized enrichment score (NES), corresponding P value (Pval), and false discovery rate (FDR) are reported. Enriched pathways: Cell cycle targets of E2F transcription factors (TFs), genes expressed in human breast tumors, genes up-regulated in response to interferon gamma, and genes involved in immune response by a myeloid leukocyte. (E) Unsupervised hierarchical clustering of whole transcriptome RNA-seq data (left) and genome-wide H3K27ac signals (right), demonstrating similar transcriptome and H3K27ac landscapes. Correlations for RNA-seq data were calculated using the Pearson correlation coefficient from the log-transformed raw read counts, and correlations for K27ac ChIP-seq data were calculated on the basis of genome-wide bigwig signals at 10-kb resolution using deeptools: DIPG tissue (n = 8), normal pons tissue (n = 2), DIPG cell lines (n = 6), GBM cell lines (n = 3), and nontumor cell lines (n = 2), including NHAs and human normal stem cells (hNSCs). Tissue data were obtained from published results (table S1). WT, wild type.
Fig. 2
Fig. 2. ChIP-seq data revealed tumor-specific enhancer landscapes that result in specific motif and TF enrichment.
(A) H3K27ac ChIP-seq reveals tumor-specific distal enhancers (red). DIPG-, GBM-, and G34V-specific distal enhancers are shown, with normal cell lines as controls. H3.3K27M signals were shown for DIPG cell lines at the same regions of H3K27ac (purple). The GBM cell line KNS42 (H3G34V mutant) is excluded from subsequent motif enrichment analysis due to its distinct molecular profile relative to the H3 wild-type GBM cell lines (n = 2). (B) Representative genome browser view of DIPG- and GBM-specific enhancers. Tracks are superimposed H3K27ac and H3.3K27M ChIP-seq tracks from DIPG (n = 4), GBM (n = 2), and normal (n = 2) cell lines. Tumor-type specific enhancer peak calls are represented as black bars above tracks. DIPG-specific enhancers are highlighted in red and GBM-specific enhancers in blue. (C) Motif enrichment with differentially expressed genes between DIPG and GBM cell lines. Expression levels of the motif genes are shown (left); heatmap shows the motif enrichment level (−log10 P value; right). Tumor-specific active motifs, defined as highly enriched motifs with high differential gene expression in a given tumor type, are shown (table, right). (D) TF motif enrichment is distinct in DIPG versus GBM cell lines. (E) GREAT analysis for DIPG- and GBM-specific distal enhancer regions TF motif enrichment implicates distinct biological processes in DIPG versus GBM.
Fig. 3
Fig. 3. DIPG and GBM showed distinct 3D genome organization affecting multiple promotor and enhancer regions in each tumor type.
(A) Hi-C contact maps and H3K27ac ChIP-seq tracks at MYCN (chr2: 15,000,000 to 16,750,000 bp). Loops are shown under H3K27ac and K27M tracks. DIPG cell lines (DIPG007 and DIPGXIII) and tissue (3810 T) have higher within-TAD interaction frequency and intensities compared to GBM (SF9427) and normal (NHA) cells. Sub-TADs are formed near MYCN. ATAC-seq shows DIPG tissue (3810 T) with greater chromatin accessibility compared to normal brain stem tissue from the same patient (3810 N). (B) APA plot shows aggregated signals from tumor type-specific loops. (C) DIPG-specific loops link OLIG2 with a distal enhancer located within the gene body of lncRNA LOC101928107. Loops are shown above each H3K27ac track. Hi-C maps show genomic regions chr21: 32,900,000 to 33,260,000 at 5-kb resolution. DIPG-specific loops were not observed in SF9426 or NHA. ATAC-seq of tissue samples shows DIPG (3810 T) to have greater chromatin accessibility in the OLIG2 enhancer region compared to normal brainstem (3810 N). (D) GBM-specific loops link the CCBE1 promoter with an upstream enhancer highlighted in purple. Hi-C maps show genomic regions chr18: 59,350,000 to 59,950,000 at 5-kb resolution. Loops were not observed in DIPG or normal cell lines in this region. (E) Gene expression in DIPG, GBM, and NHA at DIPG-specific and GBM-specific loop anchors (left). Oncogene expression in cell lines at these loop anchors (right). (F) Gene regulatory networks in DIPG and GBM. Each link represents tumor type–specific loops linking the tumor type–specific H3K27Ac enriched enhancers (shown in Fig 2A) and gene promoters. The circle surrounding the nodes represents functional pathways enrichment. IC, ion channel protein; GPCR, G protein–coupled receptors.
Fig. 4
Fig. 4. Bromodomain-targeted treatment results in changes in DIPG 3D genome structure.
(A) Western blot analysis of BRD4i, β-actin, H3K27ac, and total H3 levels upon BRD4i or dBET6 treatment for 24 and 48 hours. The effect of both drugs on BRD4 levels was strongest at 24 hours, with greatest decrease after dBET6 treatment. (B) APA plot depicting aggregated signals from drug treatment–specific loops versus DMSO-specific loops (control). (C) Hi-C maps depicting genomic region chr21: 32,900,000 to 33,260,000, encompassing OLIG2, at 5-kb resolution in DMSO-, BRD4i-, and dBET6-treated cells. Tumor-specific `interaction (arrow) is disrupted 24 hours after BRD4i and dBET6 treatment, with dBET6 exerting a stronger effect. (D) A/B compartment designations at genomic region chr6: 75,000,000 to 115,000,000 at 40-kb resolution in DMSO-, BRD4i-, and dBET6-treated cells. A compartment, purple; B, blue. Regions of A to B switch between DMSO and drug treatments, light blue; regions of B to A switch, light yellow. Both A to B and B to A compartmental switches occur with drug treatment. (E) Number of genome-wide A/B compartment switches between DMSO and dBET6- or BRD4i-treated cells. A ➔ B and B ➔ A switches were observed with dBET6 and BRD4i treatment, compared to DMSO control. dBET6 exhibits a greater effect on compartmental switching. (F) Hi-C maps showing genomic region chr11: 15,200,000 to 17,000,000 bp, encompassing SOX6, at 5-kb resolution in DMSO-, BRD4i-, and dBET6-treated cells. A/B compartment signals are shown below Hi-C maps. Weakened interactions between the promoter region of SOX6 and surrounding regions are observed in dBET6-treated conditions, compared to DMSO control.
Fig. 5
Fig. 5. SVs lead to enhancer hijacking and gene coamplification in DIPG.
(A) Genome-wide CNV profiles generated from Hi-C data using HiNT. Red lines, CNV segmentations for each cell line. Y axis, log2 copy number ratio. Greater CNVs are observed in glioma relative to normal cell lines, with the greatest number of CNVs identified in DIPGs. (B) Hi-C, H3K27ac, and H3K27M ChIP-seq; CNV; and ATAC-seq tracks at TCF12 (chr15: 56,000,000 to 58,000,000). In DIPG cell lines, coamplification is observed at TCF12 and the enhancer within the TCF12 intron region. Copy number gain is observed in DIPG but not GBM or normal cell lines, indicating that TCF12 up-regulation is due to both copy number gain and enhancer coamplification in DIPG. There is no difference in chromatin accessibility between DIPG and normal tissue at this region. (C) Enhancer hijacking events identified in DIPG007 based on SV analysis. Interchromosomal translocation is observed between chr12: 8,430,000 to 9,210,000 and chr8: 118,070,000 to 118,430,000. Copy number gain is also observed in this region, indicating simultaneous enhancer hijacking and coamplification upstream of the A2M gene. (D) Fluorescence in situ hybridization (FISH) using dual fusion translocation probes were hybridized to metaphases for detection of translocation t(8;12)(q24;p13) of SAMD12 and A2M genes. FISH analysis of the SAMD12 gene was identified by fluorescent spectrum orange signals and A2M gene by spectrum green signals. A fusion event was identified by fused orange and green signals = yellow arrows. Additional concurrent copy number gains of the SAMD12 and A2M loci were observed. (E) Hi-C maps after DMSO, BRD4i, and dBET6 treatment for the same translocation region as shown in (C).

References

    1. Mackay A., Burford A., Carvalho D., Izquierdo E., Fazal-Salom J., Taylor K. R., Bjerke L., Clarke M., Vinci M., Nandhabalan M., Temelso S., Popov S., Molinari V., Raman P., Waanders A. J., Han H. J., Gupta S., Marshall L., Zacharoulis S., Vaidya S., Mandeville H. C., Bridges L. R., Martin A. J., Al-Sarraj S., Chandler C., Ng H.-K., Li X., Mu K., Trabelsi S., Brahim D. H.-B., Kisljakov A. N., Konovalov D. M., Moore A. S., Carcaboso A. M., Sunol M., de Torres C., Cruz O., Mora J., Shats L. I., Stavale J. N., Bidinotto L. T., Reis R. M., Entz-Werle N., Farrell M., Cryan J., Crimmins D., Caird J., Pears J., Monje M., Debily M.-A., Castel D., Grill J., Hawkins C., Nikbakht H., Jabado N., Baker S. J., Pfister S. M., Jones D. T. W., Fouladi M., von Bueren A. O., Baudis M., Resnick A., Jones C., Integrated molecular meta-analysis of 1,000 pediatric high-grade and diffuse intrinsic pontine glioma. Cancer Cell 32, 520–537.e5 (2017). - PMC - PubMed
    1. Jones C., Karajannis M. A., Jones D. T. W., Kieran M. W., Monje M., Baker S. J., Becher O. J., Cho Y.-J., Gupta N., Hawkins C., Hargrave D., Haas-Kogan D. A., Jabado N., Li X.-N., Mueller S., Nicolaides T., Packer R. J., Persson A. I., Phillips J. J., Simonds E. F., Stafford J. M., Tang Y., Pfister S. M., Weiss W. A., Pediatric high-grade glioma: Biologically and clinically in need of new thinking. Neuro Oncol. 19, 153–161 (2017). - PMC - PubMed
    1. Lulla R. R., Saratsis A. M., Hashizume R., Mutations in chromatin machinery and pediatric high-grade glioma. Sci. Adv. 2, e1501354 (2016). - PMC - PubMed
    1. Nagaraja S., Quezada M. A., Gillespie S. M., Arzt M., Lennon J. J., Woo P. J., Hovestadt V., Kambhampati M., Filbin M. G., Suva M. L., Nazarian J., Monje M., Histone variant and cell context determine H3K27M reprogramming of the enhancer landscape and oncogenic state. Mol. Cell 76, 965–980.e12 (2019). - PMC - PubMed
    1. Stafford J. M., Lee C.-H., Voigt P., Descostes N., Saldaña-Meyer R., Yu J.-R., Leroy G., Oksuz O., Chapman J. R., Suarez F., Modrek A. S., Bayin N. S., Placantonakis D. G., Karajannis M. A., Snuderl M., Ueberheide B., Reinberg D., Multiple modes of PRC2 inhibition elicit global chromatin alterations in H3K27M pediatric glioma. Sci. Adv. 4, eaau5935 (2018). - PMC - PubMed

Publication types