Clinical Trial
. 2021 Aug 1;27(15):4205-4220.
doi: 10.1158/1078-0432.CCR-20-4862. Epub 2021 Jun 2.

Systemic Blockade of Clever-1 Elicits Lymphocyte Activation Alongside Checkpoint Molecule Downregulation in Patients with Solid Tumors: Results from a Phase I/II Clinical Trial

Affiliations
Clinical Trial

Systemic Blockade of Clever-1 Elicits Lymphocyte Activation Alongside Checkpoint Molecule Downregulation in Patients with Solid Tumors: Results from a Phase I/II Clinical Trial

Reetta Virtakoivu et al. Clin Cancer Res. .

Abstract

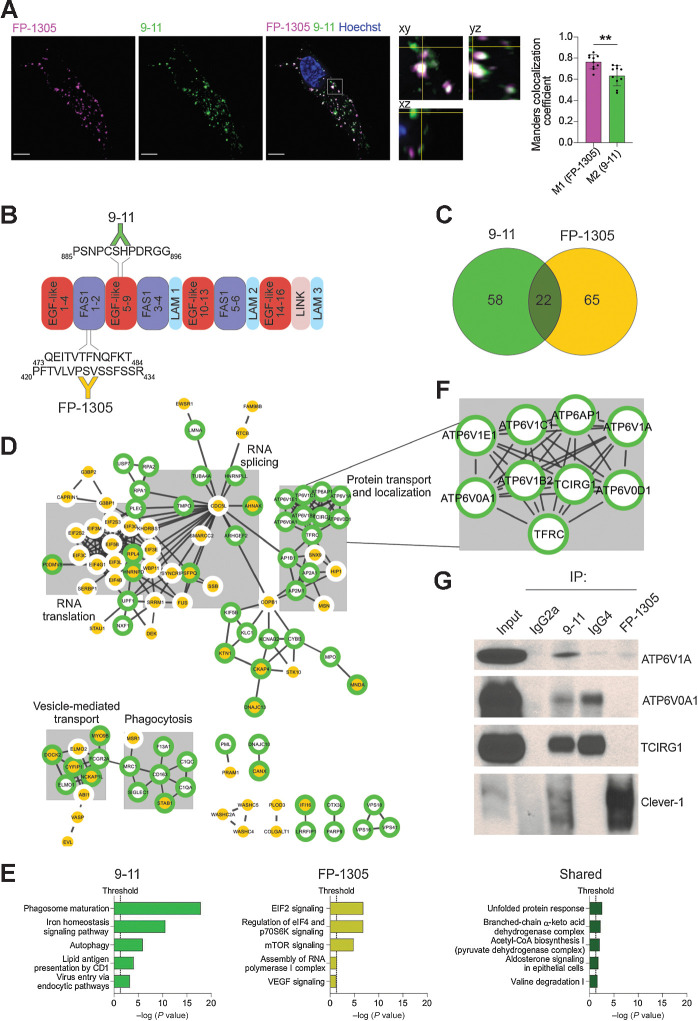
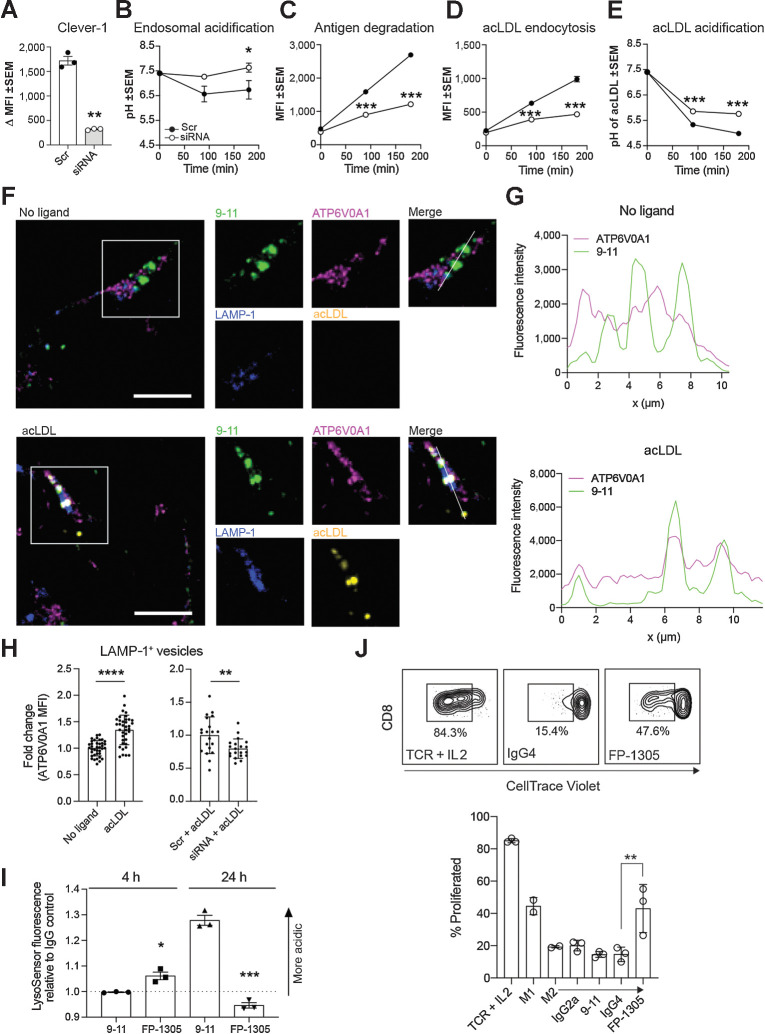
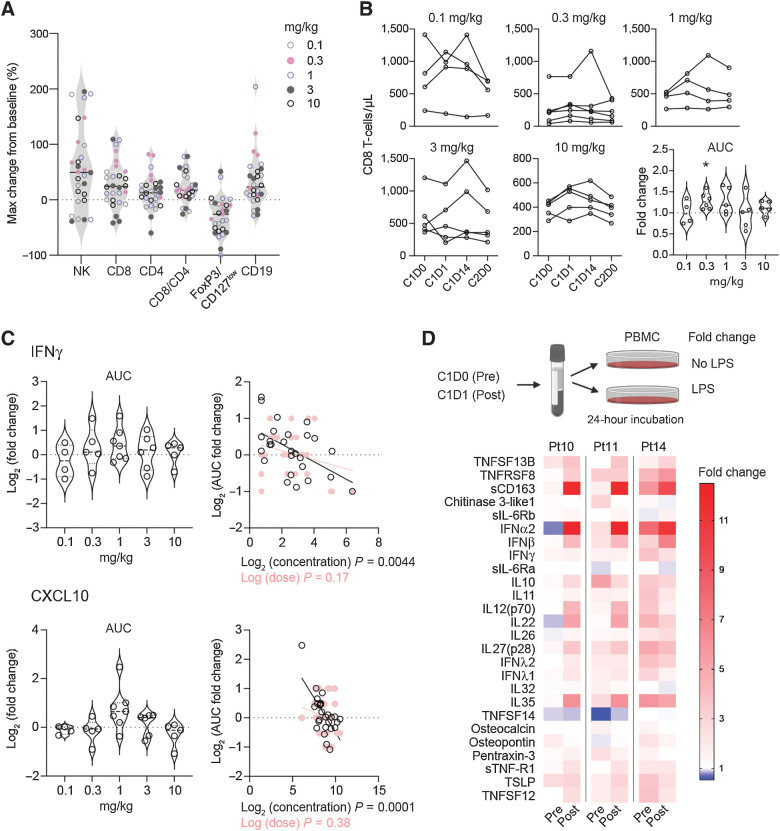
Purpose: Macrophages are critical in driving an immunosuppressive tumor microenvironment that counteracts the efficacy of T-cell-targeting therapies. Thus, agents able to reprogram macrophages toward a proinflammatory state hold promise as novel immunotherapies for solid cancers. Inhibition of the macrophage scavenger receptor Clever-1 has shown benefit in inducing CD8+ T-cell-mediated antitumor responses in mouse models of cancer, which supports the clinical development of Clever-1-targeting antibodies for cancer treatment.

Patients and methods: In this study, we analyzed the mode of action of a humanized IgG4 anti-Clever-1 antibody, FP-1305 (bexmarilimab), both in vitro and in patients with heavily pretreated metastatic cancer (n = 30) participating in part 1 (dose-finding) of a phase I/II open-label trial (NCT03733990). We studied the Clever-1 interactome in primary human macrophages in antibody pull-down assays and utilized mass cytometry, RNA sequencing, and cytokine profiling to evaluate FP-1305-induced systemic immune activation in patients with cancer.

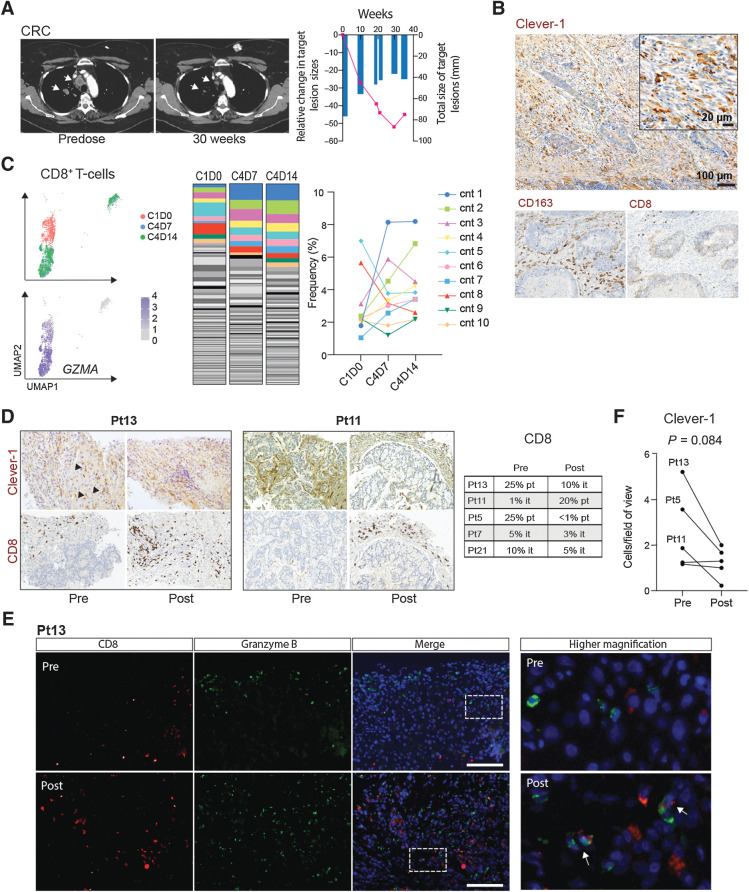
Results: Our pull-down assays and functional studies indicated that FP-1305 impaired multiprotein vacuolar ATPase-mediated endosomal acidification and improved the ability of macrophages to activate CD8+ T-cells. In patients with cancer, FP-1305 administration led to suppression of nuclear lipid signaling pathways and a proinflammatory phenotypic switch in blood monocytes. These effects were accompanied by a significant increase and activation of peripheral T-cells with indications of antitumor responses in some patients.

Conclusions: Our results reveal a nonredundant role played by the receptor Clever-1 in suppressing adaptive immune cells in humans. We provide evidence that targeting macrophage scavenging activity can promote an immune switch, potentially leading to intratumoral proinflammatory responses in patients with metastatic cancer.


Figures

Figure 1. Clever-1 harbors an interaction motif for the multiprotein vacuolar ATPase complex. A, Representative confocal images of FP-1305 and 9-11 internalization into primary human macrophages after 2-hour antibody treatment (N = 2 healthy donors). A single focal plane and orthogonal view of the indicated magnified area shows vesicles containing either one or both of the antibodies. Colocalization was assessed with Manders colocalization coefficients M1 (FP-1305) and M2 (9-11); N = 10 cells from two independent experiments with the same donor. Scale bar, 5 μm. Statistical comparison of co-localization was conducted using Wilcoxon matched-pairs signed rank test. B, Schematic of the main 9-11 and FP-1305 antibody epitopes mapped on the human Clever-1 protein primary structure. FAS1, fasciclin domain; LAM, laminin-type EGF-like domain; LINK, C-type lectin-like hyaluronan-binding LINK module. C, Venn diagram showing the number of 9-11– and FP-1305–specific proteins and proteins shared by both antibodies in the CRAPome-pruned Clever-1 interactome. D, High-confidence protein–protein interactions in the Clever-1 interactome retrieved from the STRING database and mapped using Cytoscape. Proteins present in the 9-11 interactome have a green border and proteins present in the FP-1305 interactome a yellow center. The five largest clusters are highlighted with grey boxes and titled after common themes in their significantly enriched GO Biological Process terms. E, Significantly enriched pathways from IPA performed separately on 9-11–specific, FP-1305–specific, and shared proteins. F, Magnification of the Clever-1 interactome showing subunits of the v-ATPase complex, which immunoprecipitated specifically with 9-11. G, Coimmunoprecipitation/Western blot validation showing that the v-ATPase subunits ATP6V1A, ATP6V0A1, and TCIRG1 are immunoprecipitated with 9-11 but not with FP-1305. Clever-1 signal was detected with the 3-372 antibody, which is the parent antibody of FP-1305. Rat IgG2a and human IgG4 served as isotype controls in coimmunoprecipitation for 9-11 and FP-1305, respectively. **, P < 0.01.
Figure 1.
Clever-1 harbors an interaction motif for the multiprotein vacuolar ATPase complex. A, Representative confocal images of FP-1305 and 9-11 internalization into primary human macrophages after 2-hour antibody treatment (N = 2 healthy donors). A single focal plane and orthogonal view of the indicated magnified area shows vesicles containing either one or both of the antibodies. Colocalization was assessed with Manders colocalization coefficients M1 (FP-1305) and M2 (9-11); N = 10 cells from two independent experiments with the same donor. Scale bar, 5 μm. Statistical comparison of co-localization was conducted using Wilcoxon matched-pairs signed rank test. B, Schematic of the main 9-11 and FP-1305 antibody epitopes mapped on the human Clever-1 protein primary structure. FAS1, fasciclin domain; LAM, laminin-type EGF-like domain; LINK, C-type lectin-like hyaluronan-binding LINK module. C, Venn diagram showing the number of 9-11– and FP-1305–specific proteins and proteins shared by both antibodies in the CRAPome-pruned Clever-1 interactome. D, High-confidence protein–protein interactions in the Clever-1 interactome retrieved from the STRING database and mapped using Cytoscape. Proteins present in the 9-11 interactome have a green border and proteins present in the FP-1305 interactome a yellow center. The five largest clusters are highlighted with grey boxes and titled after common themes in their significantly enriched GO Biological Process terms. E, Significantly enriched pathways from IPA performed separately on 9-11–specific, FP-1305–specific, and shared proteins. F, Magnification of the Clever-1 interactome showing subunits of the v-ATPase complex, which immunoprecipitated specifically with 9-11. G, Coimmunoprecipitation/Western blot validation showing that the v-ATPase subunits ATP6V1A, ATP6V0A1, and TCIRG1 are immunoprecipitated with 9-11 but not with FP-1305. Clever-1 signal was detected with the 3-372 antibody, which is the parent antibody of FP-1305. Rat IgG2a and human IgG4 served as isotype controls in coimmunoprecipitation for 9-11 and FP-1305, respectively. **, P < 0.01.
Figure 2. Clever-1 regulates the acidification and degradation of endocytosed antigens. A, Clever-1 knockdown efficiency in KG-1 macrophages quantified by flow cytometry with 9-11; N = 3, Student's paired two-tailed t test. B–E, Total endo-lysosomal acidification (B), antigen degradation (C), acLDL endocytosis (D), and acLDL acidification (E) kinetics in KG-1 macrophages transfected with scramble (Scr) or Clever-1 siRNA; N = 3, two-way ANOVA with Sidak's multiple comparisons test. F, Confocal microscopy images of Clever-1 (green), ATP6V0A1 (magenta), and LAMP-1 (blue) localization in KG-1 macrophages treated with or without 10 μg/mL acLDL (yellow) for 3 hours. Scale bar, 10 μm. G, Clever-1 (green) and ATP6V0A1 (magenta) intensity profiles generated from the KG-1 macrophage confocal images. Intensities were obtained across the white lines displayed in the corresponding merged images. H, ATP6V0A1 mean fluorescence intensity (MFI) in LAMP-1+ lysosomes of non-transfected KG-1 macrophages treated with or without 10 μg/mL acLDL (n > 35 cells from three independent experiments) and scramble (Scr) or Clever-1 siRNA-transfected KG-1 macrophages treated with 10 μg/mL acLDL (n = 20 cells). MFI normalized to each experiment's no-ligand or Scr-mean. Student's unpaired two-tailed t test. I, M2-polarized primary human macrophages (N = 3) were treated with 50 μg/mL of 9-11 or FP-1305 for the indicated timepoints. Changes in endosomal pH were measured by LysoSensor Green fluorescence intensity relative to cells treated with control IgGs; Student's unpaired two-tailed t test. J, Representative flow cytometry plots and quantification of CD8+ T-cell proliferation in mixed leukocyte reactions with M2-polarized primary human macrophages treated with 9-11 or FP-1305 or their respective isotype controls in comparison to TCR (anti-CD3/CD28) activation or M1 polarization. Each dot represents one healthy donor; one-way ANOVA with Holm–Sidak multiple comparison test. *, P < 0.05; **, P < 0.01; ***, P < 0.001; ****, P < 0.0001.
Figure 2.
Clever-1 regulates the acidification and degradation of endocytosed antigens. A, Clever-1 knockdown efficiency in KG-1 macrophages quantified by flow cytometry with 9-11; N = 3, Student's paired two-tailed t test. B–E, Total endo-lysosomal acidification (B), antigen degradation (C), acLDL endocytosis (D), and acLDL acidification (E) kinetics in KG-1 macrophages transfected with scramble (Scr) or Clever-1 siRNA; N = 3, two-way ANOVA with Sidak's multiple comparisons test. F, Confocal microscopy images of Clever-1 (green), ATP6V0A1 (magenta), and LAMP-1 (blue) localization in KG-1 macrophages treated with or without 10 μg/mL acLDL (yellow) for 3 hours. Scale bar, 10 μm. G, Clever-1 (green) and ATP6V0A1 (magenta) intensity profiles generated from the KG-1 macrophage confocal images. Intensities were obtained across the white lines displayed in the corresponding merged images. H, ATP6V0A1 mean fluorescence intensity (MFI) in LAMP-1+ lysosomes of non-transfected KG-1 macrophages treated with or without 10 μg/mL acLDL (n > 35 cells from three independent experiments) and scramble (Scr) or Clever-1 siRNA-transfected KG-1 macrophages treated with 10 μg/mL acLDL (n = 20 cells). MFI normalized to each experiment's no-ligand or Scr-mean. Student's unpaired two-tailed t test. I, M2-polarized primary human macrophages (N = 3) were treated with 50 μg/mL of 9-11 or FP-1305 for the indicated timepoints. Changes in endosomal pH were measured by LysoSensor Green fluorescence intensity relative to cells treated with control IgGs; Student's unpaired two-tailed t test. J, Representative flow cytometry plots and quantification of CD8+ T-cell proliferation in mixed leukocyte reactions with M2-polarized primary human macrophages treated with 9-11 or FP-1305 or their respective isotype controls in comparison to TCR (anti-CD3/CD28) activation or M1 polarization. Each dot represents one healthy donor; one-way ANOVA with Holm–Sidak multiple comparison test. *, P < 0.05; **, P < 0.01; ***, P < 0.001; ****, P < 0.0001.
Figure 3. FP-1305 binds circulating CD14+ monocytes and suppresses LXR/RXR and PPAR signaling pathways. A, T-distributed stochastic neighbor embedding (tSNE) of CD3-excluded circulating mononuclear cells from D0 (N = 7) and D7 (N = 7) samples pre-gated for viability, singlets, and CD45+ cells. B, tSNE heatmaps showing expression of indicated markers on cell clusters of a representative patient (D0 and D7). C, Median expression of CD206 and CD163 on CD14+ monocytes on D0 and D7; paired Student's t test. D, Representative flow cytometry plots on D0 (blue) and D7 (red) showing size (FSC) and granularity (SSC) of CD14high monocytes (dashed line in half-offset histograms shows median SSC fluorescence on D0) and median expression of CD14 and Clever-1 (9-11 antibody) at different timepoints during treatment cycle 1. Pt2 (gray), Pt3 (pink), Pt5 (lilac), Pt21 (light blue). Clever-1 R-O by administered FP-1305 was detected by competitive binding of fluorochrome-conjugated FP-1305. One-way ANOVA performed between D0, D1, and D7 samples. E, Unsupervised hierarchical clustering of 13,589 genes expressed in CD14+ monocytes obtained from 4 patients across D0, D1, and D7 samples. F, Principal component analysis of patient samples across different timepoints. G, Ingenuity Pathway analysis of patient gene expression changes on D7 compared with predose (D0). Red color indicates predicted pathway activation and blue color inhibition. Light gray denotes 0.1 mg/kg dose and dark grey 10 mg/kg. H, FPKM values and qPCR validation of gene expression changes involved in relevant pathways. RNA sequenced Pt2 and Pt3 are marked in black. *, P < 0.05.
Figure 3.
FP-1305 binds circulating CD14+ monocytes and suppresses LXR/RXR and PPAR signaling pathways. A, T-distributed stochastic neighbor embedding (tSNE) of CD3-excluded circulating mononuclear cells from D0 (N = 7) and D7 (N = 7) samples pre-gated for viability, singlets, and CD45+ cells. B, tSNE heatmaps showing expression of indicated markers on cell clusters of a representative patient (D0 and D7). C, Median expression of CD206 and CD163 on CD14+ monocytes on D0 and D7; paired Student's t test. D, Representative flow cytometry plots on D0 (blue) and D7 (red) showing size (FSC) and granularity (SSC) of CD14high monocytes (dashed line in half-offset histograms shows median SSC fluorescence on D0) and median expression of CD14 and Clever-1 (9-11 antibody) at different timepoints during treatment cycle 1. Pt2 (gray), Pt3 (pink), Pt5 (lilac), Pt21 (light blue). Clever-1 R-O by administered FP-1305 was detected by competitive binding of fluorochrome-conjugated FP-1305. One-way ANOVA performed between D0, D1, and D7 samples. E, Unsupervised hierarchical clustering of 13,589 genes expressed in CD14+ monocytes obtained from 4 patients across D0, D1, and D7 samples. F, Principal component analysis of patient samples across different timepoints. G, Ingenuity Pathway analysis of patient gene expression changes on D7 compared with predose (D0). Red color indicates predicted pathway activation and blue color inhibition. Light gray denotes 0.1 mg/kg dose and dark grey 10 mg/kg. H, FPKM values and qPCR validation of gene expression changes involved in relevant pathways. RNA sequenced Pt2 and Pt3 are marked in black. *, P < 0.05.
Figure 4. FP-1305 elicits activation and proliferation of circulating cytotoxic T-cells. A, tSNE plots of circulating T-cells pre-gated for viability, singlets, and CD3+ cells; 5,000 cells/sample (N = 7). CM, central memory; EFF, effector; EM, effector memory; TREG, regulatory T-cell. B, tSNE heatmaps showing expression of indicated markers on T-cell clusters of a representative patient. C, Heatmap of cluster sizes on D0 and D7. Dot size indicates the relative percent of the cluster per sample. Red color points to positive and blue to negative change between D0 and D7 samples within a patient. The asterisk indicates statistical significance of the change across all patients. D, Heatmap of marker differences between D0 and D7 samples in each T-cell cluster (N = 7); paired Student's t test (C and D). E and F, Median expression of Ki67 (E) and perforin (F) in selected T-cells from a representative patient (Pt10). Overall response across 6 patients with at least >10% increase in Ki67 and perforin is indicated in the right corner of each graph. Cutoff for Ki67high cells is depicted as a dashed line for each cell type. The median expression of perforin is indicated for each timepoint on the right side of the bars. G, Expression of IFNγ and IL-2 in PMA/ionomycin-stimulated peripheral CD8+ T-cells obtained D0, D7, or D14. Plots are shown for Pt9 (pink). *, P < 0.05; **, P < 0.01; ***, P < 0.001.
Figure 4.
FP-1305 elicits activation and proliferation of circulating cytotoxic T-cells. A, tSNE plots of circulating T-cells pre-gated for viability, singlets, and CD3+ cells; 5,000 cells/sample (N = 7). CM, central memory; EFF, effector; EM, effector memory; TREG, regulatory T-cell. B, tSNE heatmaps showing expression of indicated markers on T-cell clusters of a representative patient. C, Heatmap of cluster sizes on D0 and D7. Dot size indicates the relative percent of the cluster per sample. Red color points to positive and blue to negative change between D0 and D7 samples within a patient. The asterisk indicates statistical significance of the change across all patients. D, Heatmap of marker differences between D0 and D7 samples in each T-cell cluster (N = 7); paired Student's t test (C and D). E and F, Median expression of Ki67 (E) and perforin (F) in selected T-cells from a representative patient (Pt10). Overall response across 6 patients with at least >10% increase in Ki67 and perforin is indicated in the right corner of each graph. Cutoff for Ki67high cells is depicted as a dashed line for each cell type. The median expression of perforin is indicated for each timepoint on the right side of the bars. G, Expression of IFNγ and IL-2 in PMA/ionomycin-stimulated peripheral CD8+ T-cells obtained D0, D7, or D14. Plots are shown for Pt9 (pink). *, P < 0.05; **, P < 0.01; ***, P < 0.001.
Figure 5. FP-1305 reinvigorates patient responses to inflammatory stimuli by increasing interferon secretion. A, Maximum relative change in the absolute numbers of blood lymphocyte populations during cycle 1 in all patients. B-cell changes were measured during cycles 1–4 due to slower kinetics. B, Absolute CD8+ T-cell numbers and AUC during cycle 1, shown by dose level. The AUCs were analyzed from patients with samples from all timepoints and a fold change was calculated against an AUC using each patient's predose cell number, which was considered to remain constant throughout cycle 1. Statistical analysis was performed with Wilcoxon's matched-pairs signed rank test. C, AUC fold change for systemic IFNγ and CXCL10 in MATINS patients during cycle 1. No significant differences between doses were observed with Wilcoxon's matched-pairs signed rank test. The right-hand plots show linear regression analysis of log2 transformed values of AUC fold change with predose concentrations (pg/mL) and dose (0.1–10 mg/kg). Each dot represents one patient (A–C). D, Schematic of TLR4-specific LPS stimulation of patient PBMCs ex vivo on D0 and D1 and heatmap of LPS-induced secreted factors on D0 and D1 shown as fold change relative to unstimulated cells. *, P < 0.05; **, P < 0.01; ***, P < 0.001.
Figure 5.
FP-1305 reinvigorates patient responses to inflammatory stimuli by increasing interferon secretion. A, Maximum relative change in the absolute numbers of blood lymphocyte populations during cycle 1 in all patients. B-cell changes were measured during cycles 1–4 due to slower kinetics. B, Absolute CD8+ T-cell numbers and AUC during cycle 1, shown by dose level. The AUCs were analyzed from patients with samples from all timepoints and a fold change was calculated against an AUC using each patient's predose cell number, which was considered to remain constant throughout cycle 1. Statistical analysis was performed with Wilcoxon's matched-pairs signed rank test. C, AUC fold change for systemic IFNγ and CXCL10 in MATINS patients during cycle 1. No significant differences between doses were observed with Wilcoxon's matched-pairs signed rank test. The right-hand plots show linear regression analysis of log2 transformed values of AUC fold change with predose concentrations (pg/mL) and dose (0.1–10 mg/kg). Each dot represents one patient (AC). D, Schematic of TLR4-specific LPS stimulation of patient PBMCs ex vivo on D0 and D1 and heatmap of LPS-induced secreted factors on D0 and D1 shown as fold change relative to unstimulated cells. *, P < 0.05; **, P < 0.01; ***, P < 0.001.
Figure 6. FP-1305–induced antitumor responses are reflected by clonal expansion of systemic effector CD8+ T-cells in a responding patient. A, CT images of a patient (Pt6) with microsatellite-stable (MSS) colorectal carcinoma (six previous lines of therapy). Arrows highlight shrinking lung metastases. Size of the target lesions and change over time are presented in the right-hand graph. B, IHC analyses of Clever-1, CD163, and CD8 (all in brown) in archived rectal carcinoma tissue from the colorectal cancer (CRC) patient. C, Uniform manifold approximation and projection (UMAP) plots of CD8+ T-cell transcriptomes colored by timepoint and expression of granzyme A (GZMA). Abundance of diverse CD8+ T-cell clonotypes (cnt) at cycle 1, D0 (predose), and cycle 4 timepoints D7 and D14. The ten most abundant TCR sequences are colored to show dynamics of specific clones across the different timepoints. D, IHC staining of Clever-1 and CD8 in patient tumor biopsies pre- and post-treatment. Posttreatment biopsies were taken after cycle 3. Arrows point to Clever-1+ liver sinusoids. Quantification of peri- and intratumoral CD8+ T-cells in biopsies are reported by predominant immune cell location. it, intratumoral; pt, peritumoral. E, Immunofluorescence staining of CD8 (red) and granzyme B (green) in pre- and posttreatment biopsies of Pt13 with DAPI nuclear stain (blue). Arrows point to double positive cells. Scale bar, 100 μm. F, Quantification of Clever-1+ macrophages in tumor biopsies pre- and posttreatment. Student's paired two-tailed t test.
Figure 6.
FP-1305–induced antitumor responses are reflected by clonal expansion of systemic effector CD8+ T-cells in a responding patient. A, CT images of a patient (Pt6) with microsatellite-stable (MSS) colorectal carcinoma (six previous lines of therapy). Arrows highlight shrinking lung metastases. Size of the target lesions and change over time are presented in the right-hand graph. B, IHC analyses of Clever-1, CD163, and CD8 (all in brown) in archived rectal carcinoma tissue from the colorectal cancer (CRC) patient. C, Uniform manifold approximation and projection (UMAP) plots of CD8+ T-cell transcriptomes colored by timepoint and expression of granzyme A (GZMA). Abundance of diverse CD8+ T-cell clonotypes (cnt) at cycle 1, D0 (predose), and cycle 4 timepoints D7 and D14. The ten most abundant TCR sequences are colored to show dynamics of specific clones across the different timepoints. D, IHC staining of Clever-1 and CD8 in patient tumor biopsies pre- and post-treatment. Posttreatment biopsies were taken after cycle 3. Arrows point to Clever-1+ liver sinusoids. Quantification of peri- and intratumoral CD8+ T-cells in biopsies are reported by predominant immune cell location. it, intratumoral; pt, peritumoral. E, Immunofluorescence staining of CD8 (red) and granzyme B (green) in pre- and posttreatment biopsies of Pt13 with DAPI nuclear stain (blue). Arrows point to double positive cells. Scale bar, 100 μm. F, Quantification of Clever-1+ macrophages in tumor biopsies pre- and posttreatment. Student's paired two-tailed t test.

References

    1. Sharma P, Hu-Lieskovan S, Wargo JA, Ribas A. Primary, adaptive, and acquired resistance to cancer immunotherapy.Cell 2017;168:707–23. - PMC - PubMed
    1. Cassetta L, Pollard JW. Targeting macrophages: therapeutic approaches in cancer.Nat Rev Drug Discov 2018;17:887–904. - PubMed
    1. Jahchan NS, Mujal AM, Pollack JL, Binnewies M, Sriram V, Reyno L, et al. Tuning the tumor myeloid microenvironment to fight cancer.Front Immunol 2019;10:1611. - PMC - PubMed
    1. Palani S, Elima K, Ekholm E, Jalkanen S, Salmi M. Monocyte stabilin-1 suppresses the activation of Th1 lymphocytes.J Immunol 2016;196:115–23. - PubMed
    1. Hollmén M, Figueiredo CR, Jalkanen S. New tools to prevent cancer growth and spread: a ‘Clever’ approach.Br J Cancer 2020;123:501–9. - PMC - PubMed

Publication types

MeSH terms

Associated data