

Surface Proteins of SARS-CoV-2 Drive Airway Epithelial Cells to Induce IFN-Dependent Inflammation
- PMID: 34078711
- PMCID: PMC8278276
- DOI: 10.4049/jimmunol.2001407
Surface Proteins of SARS-CoV-2 Drive Airway Epithelial Cells to Induce IFN-Dependent Inflammation
Abstract
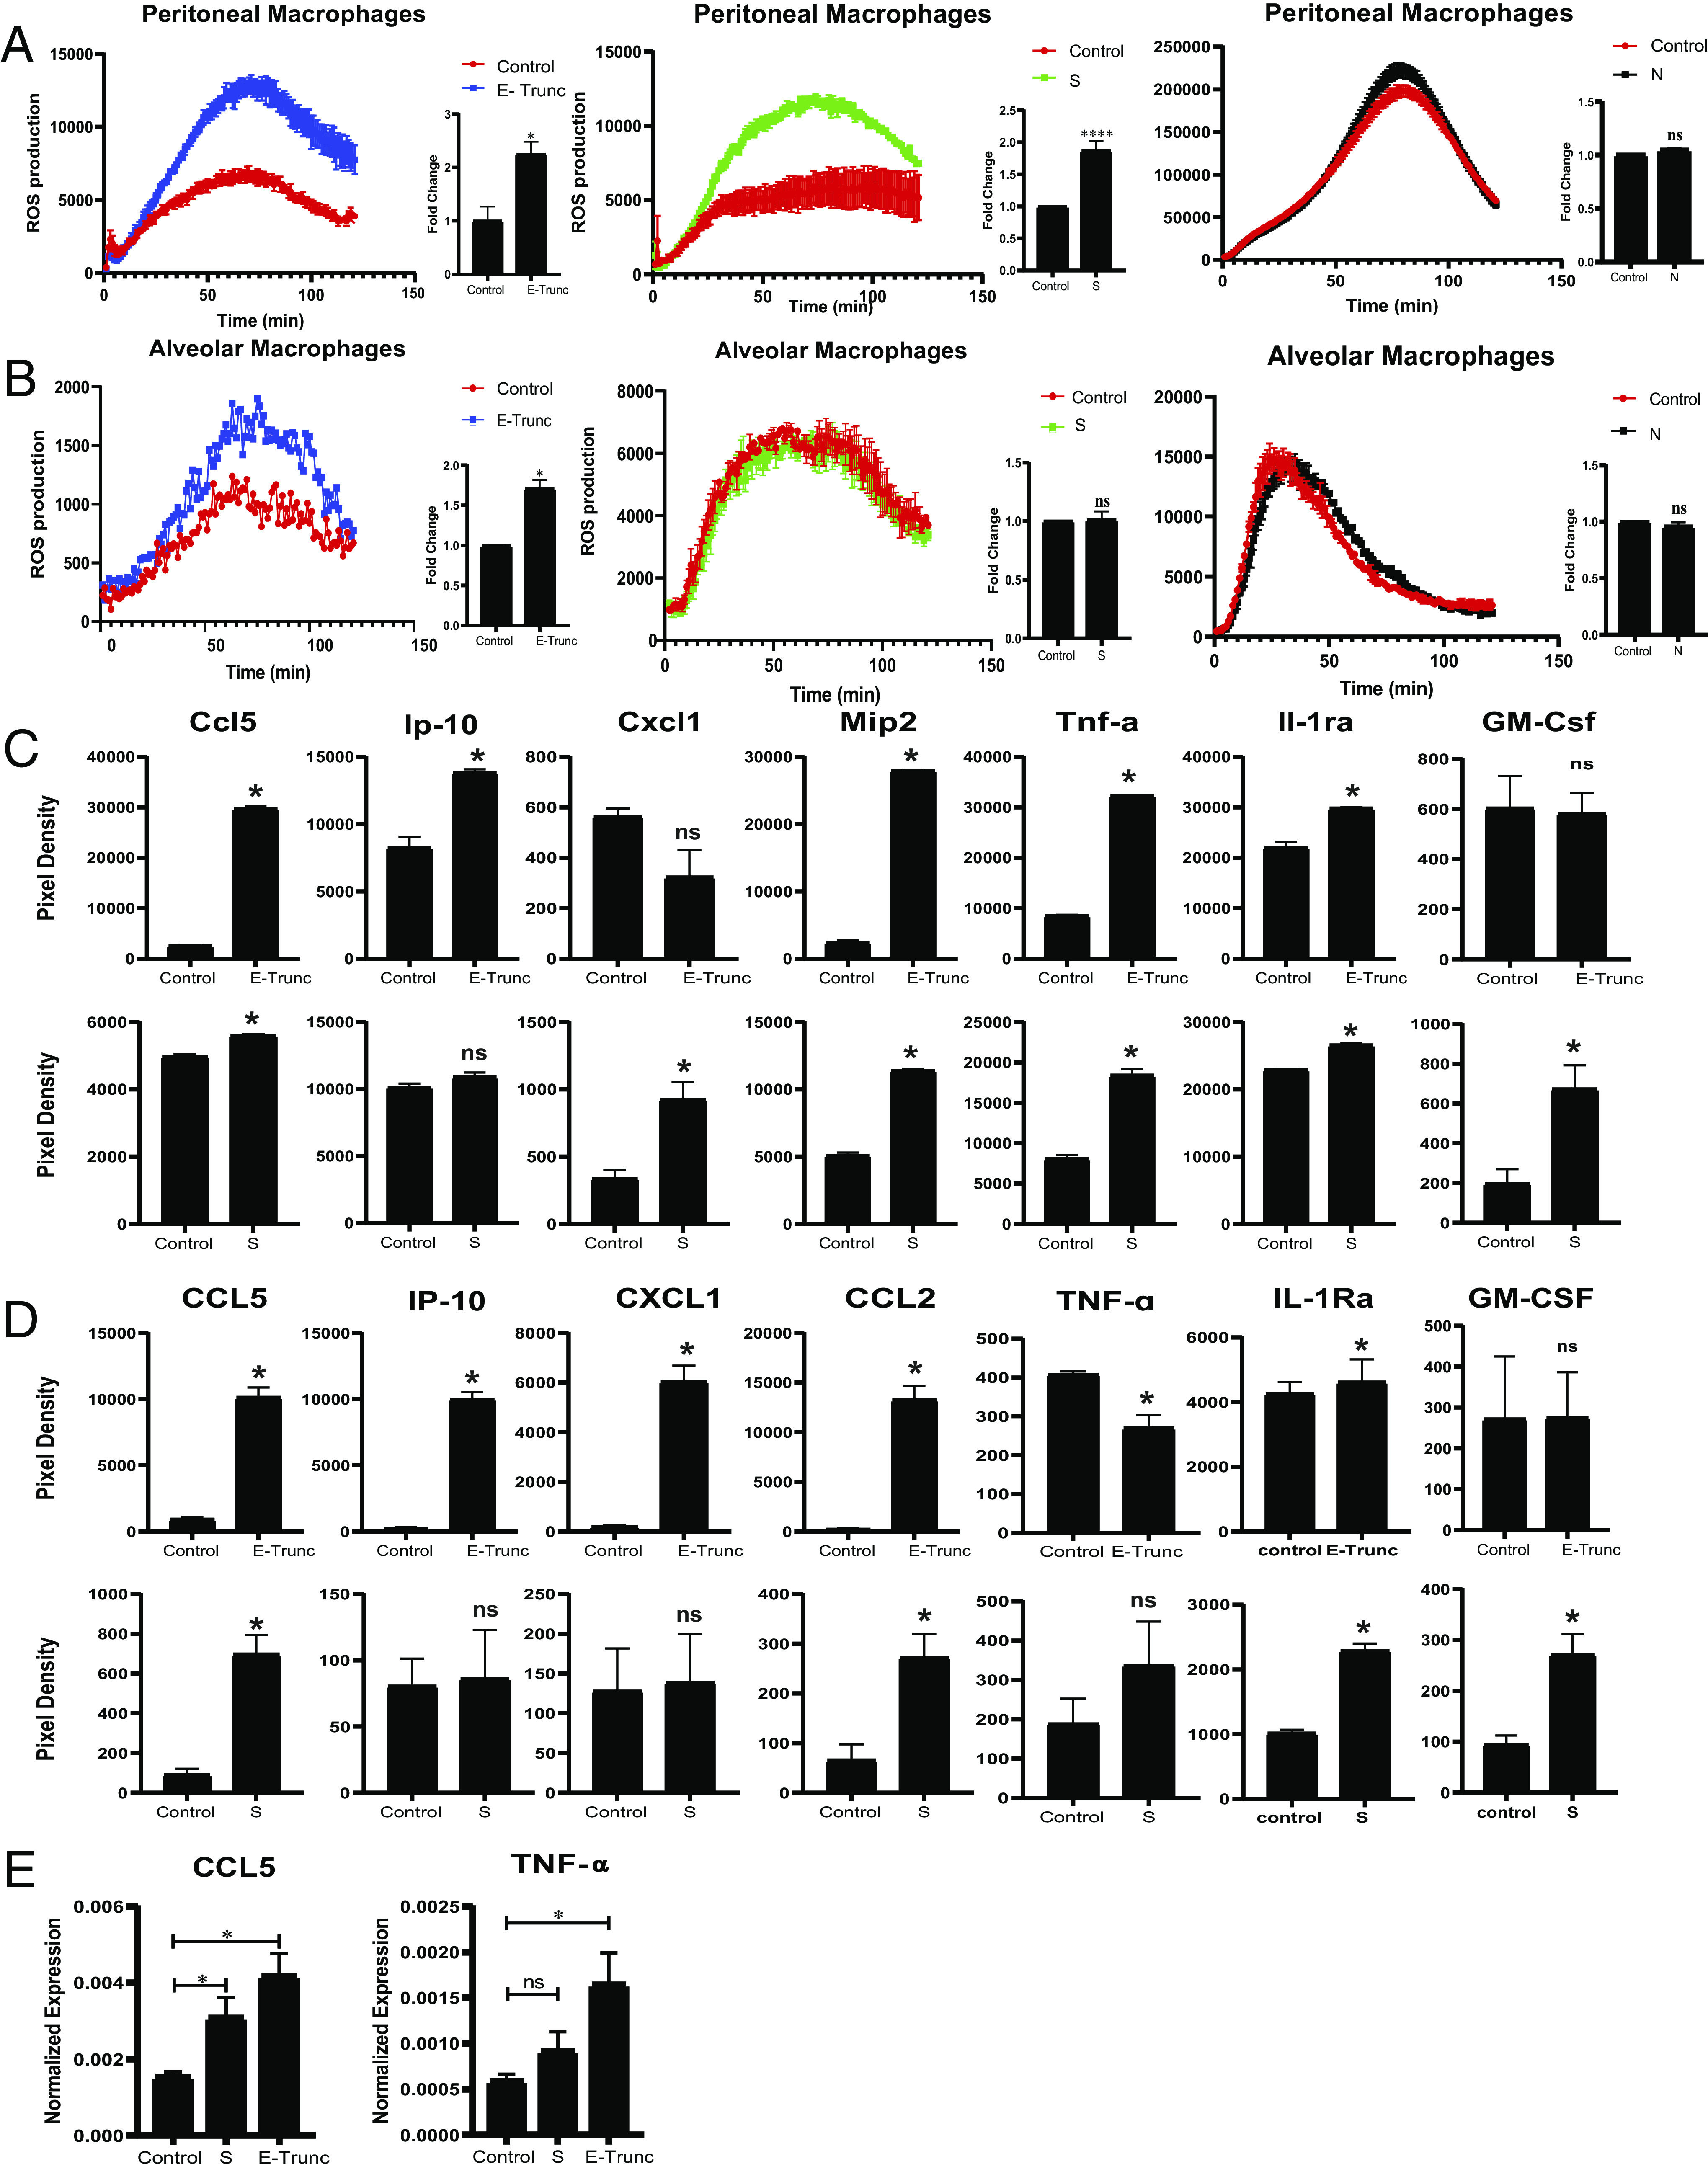
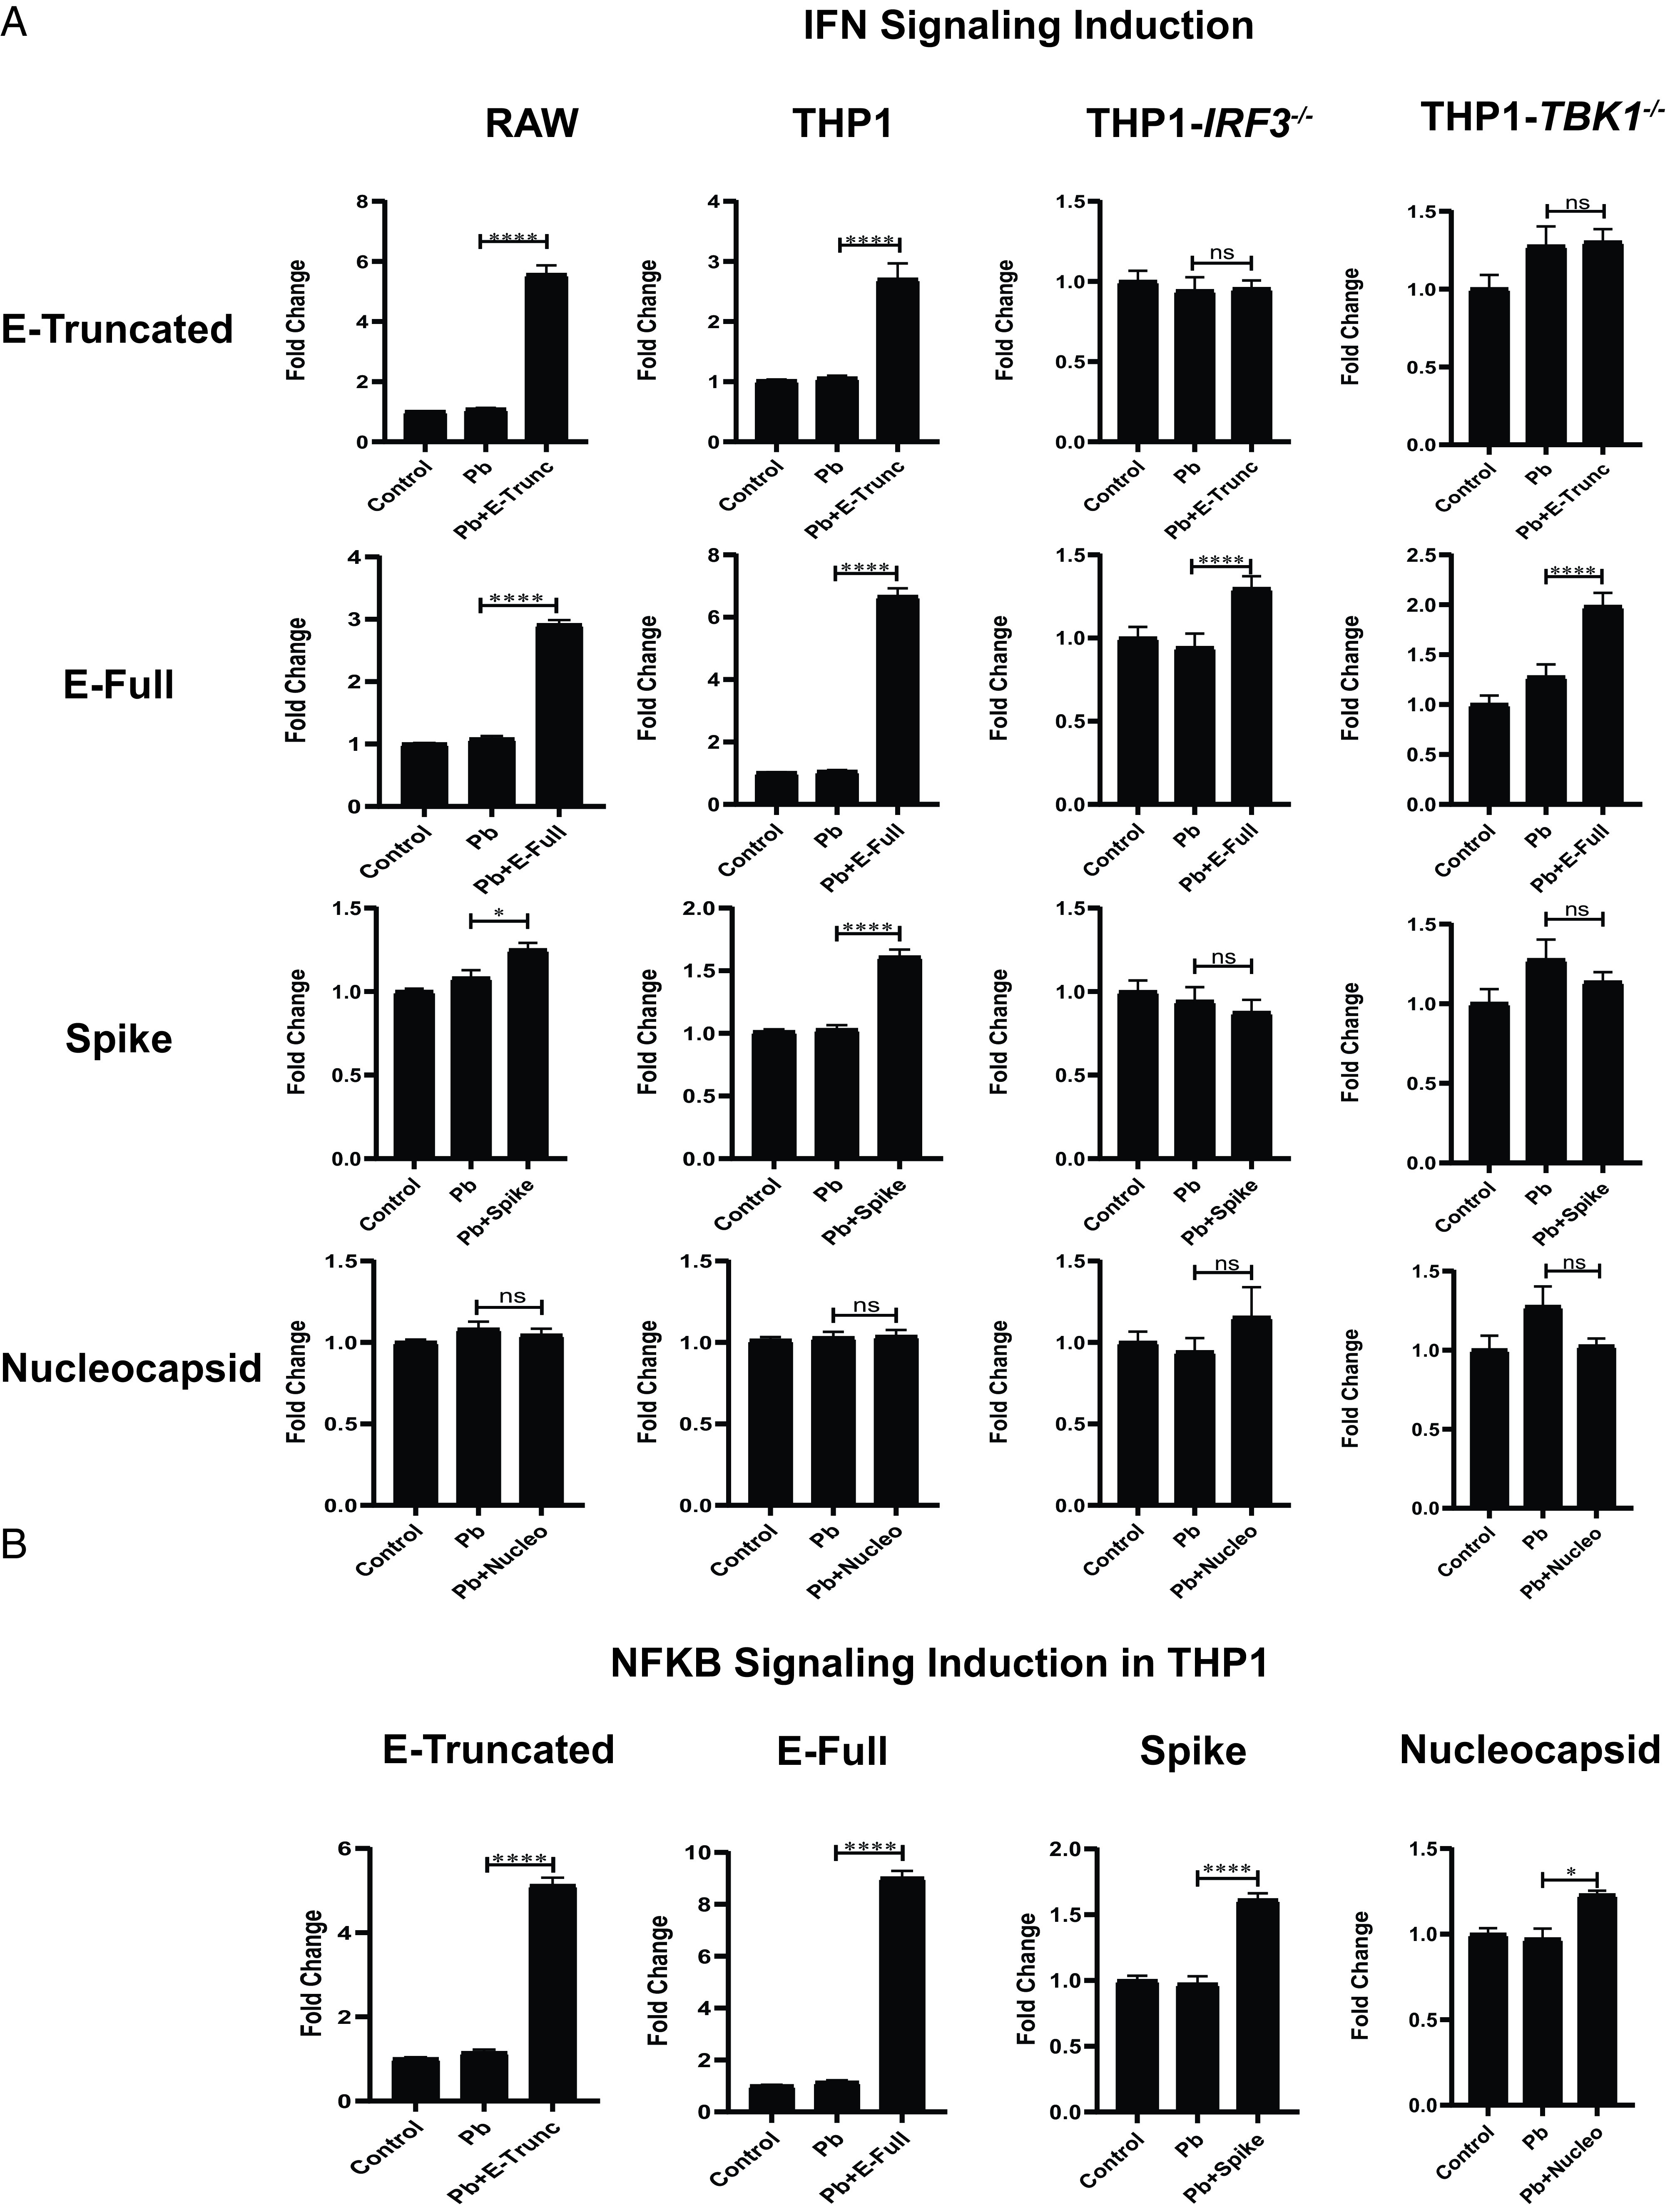
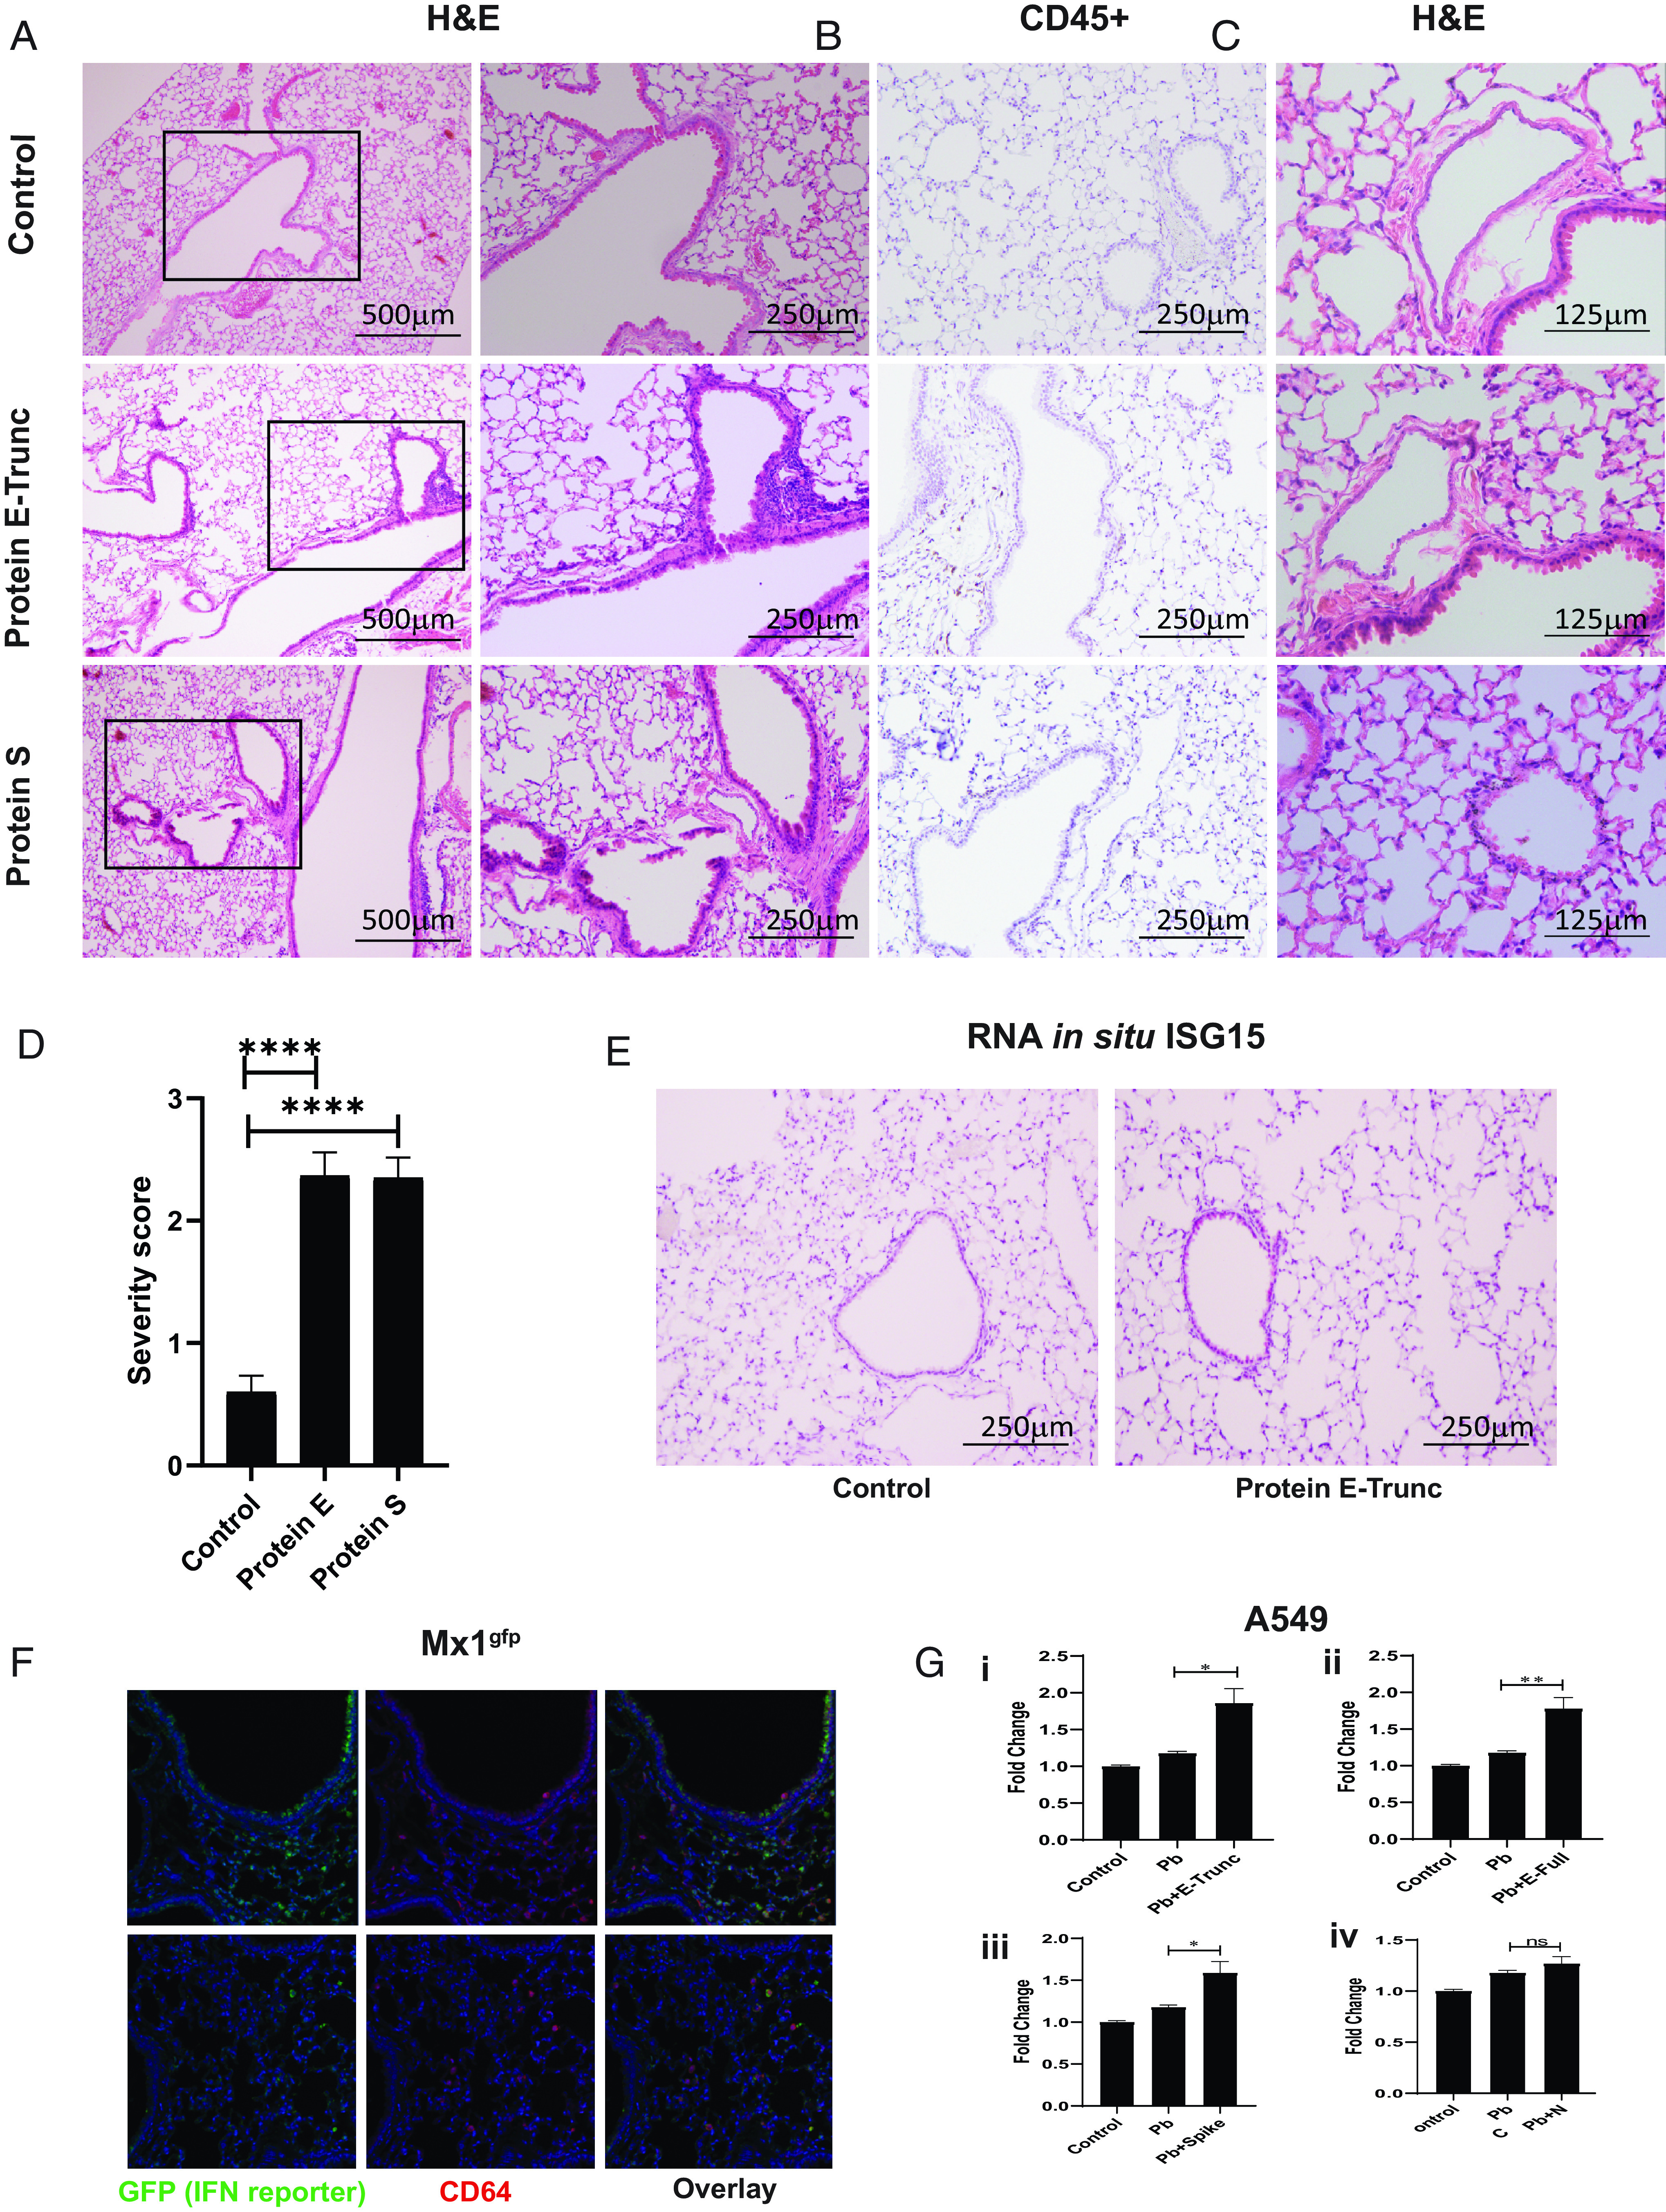
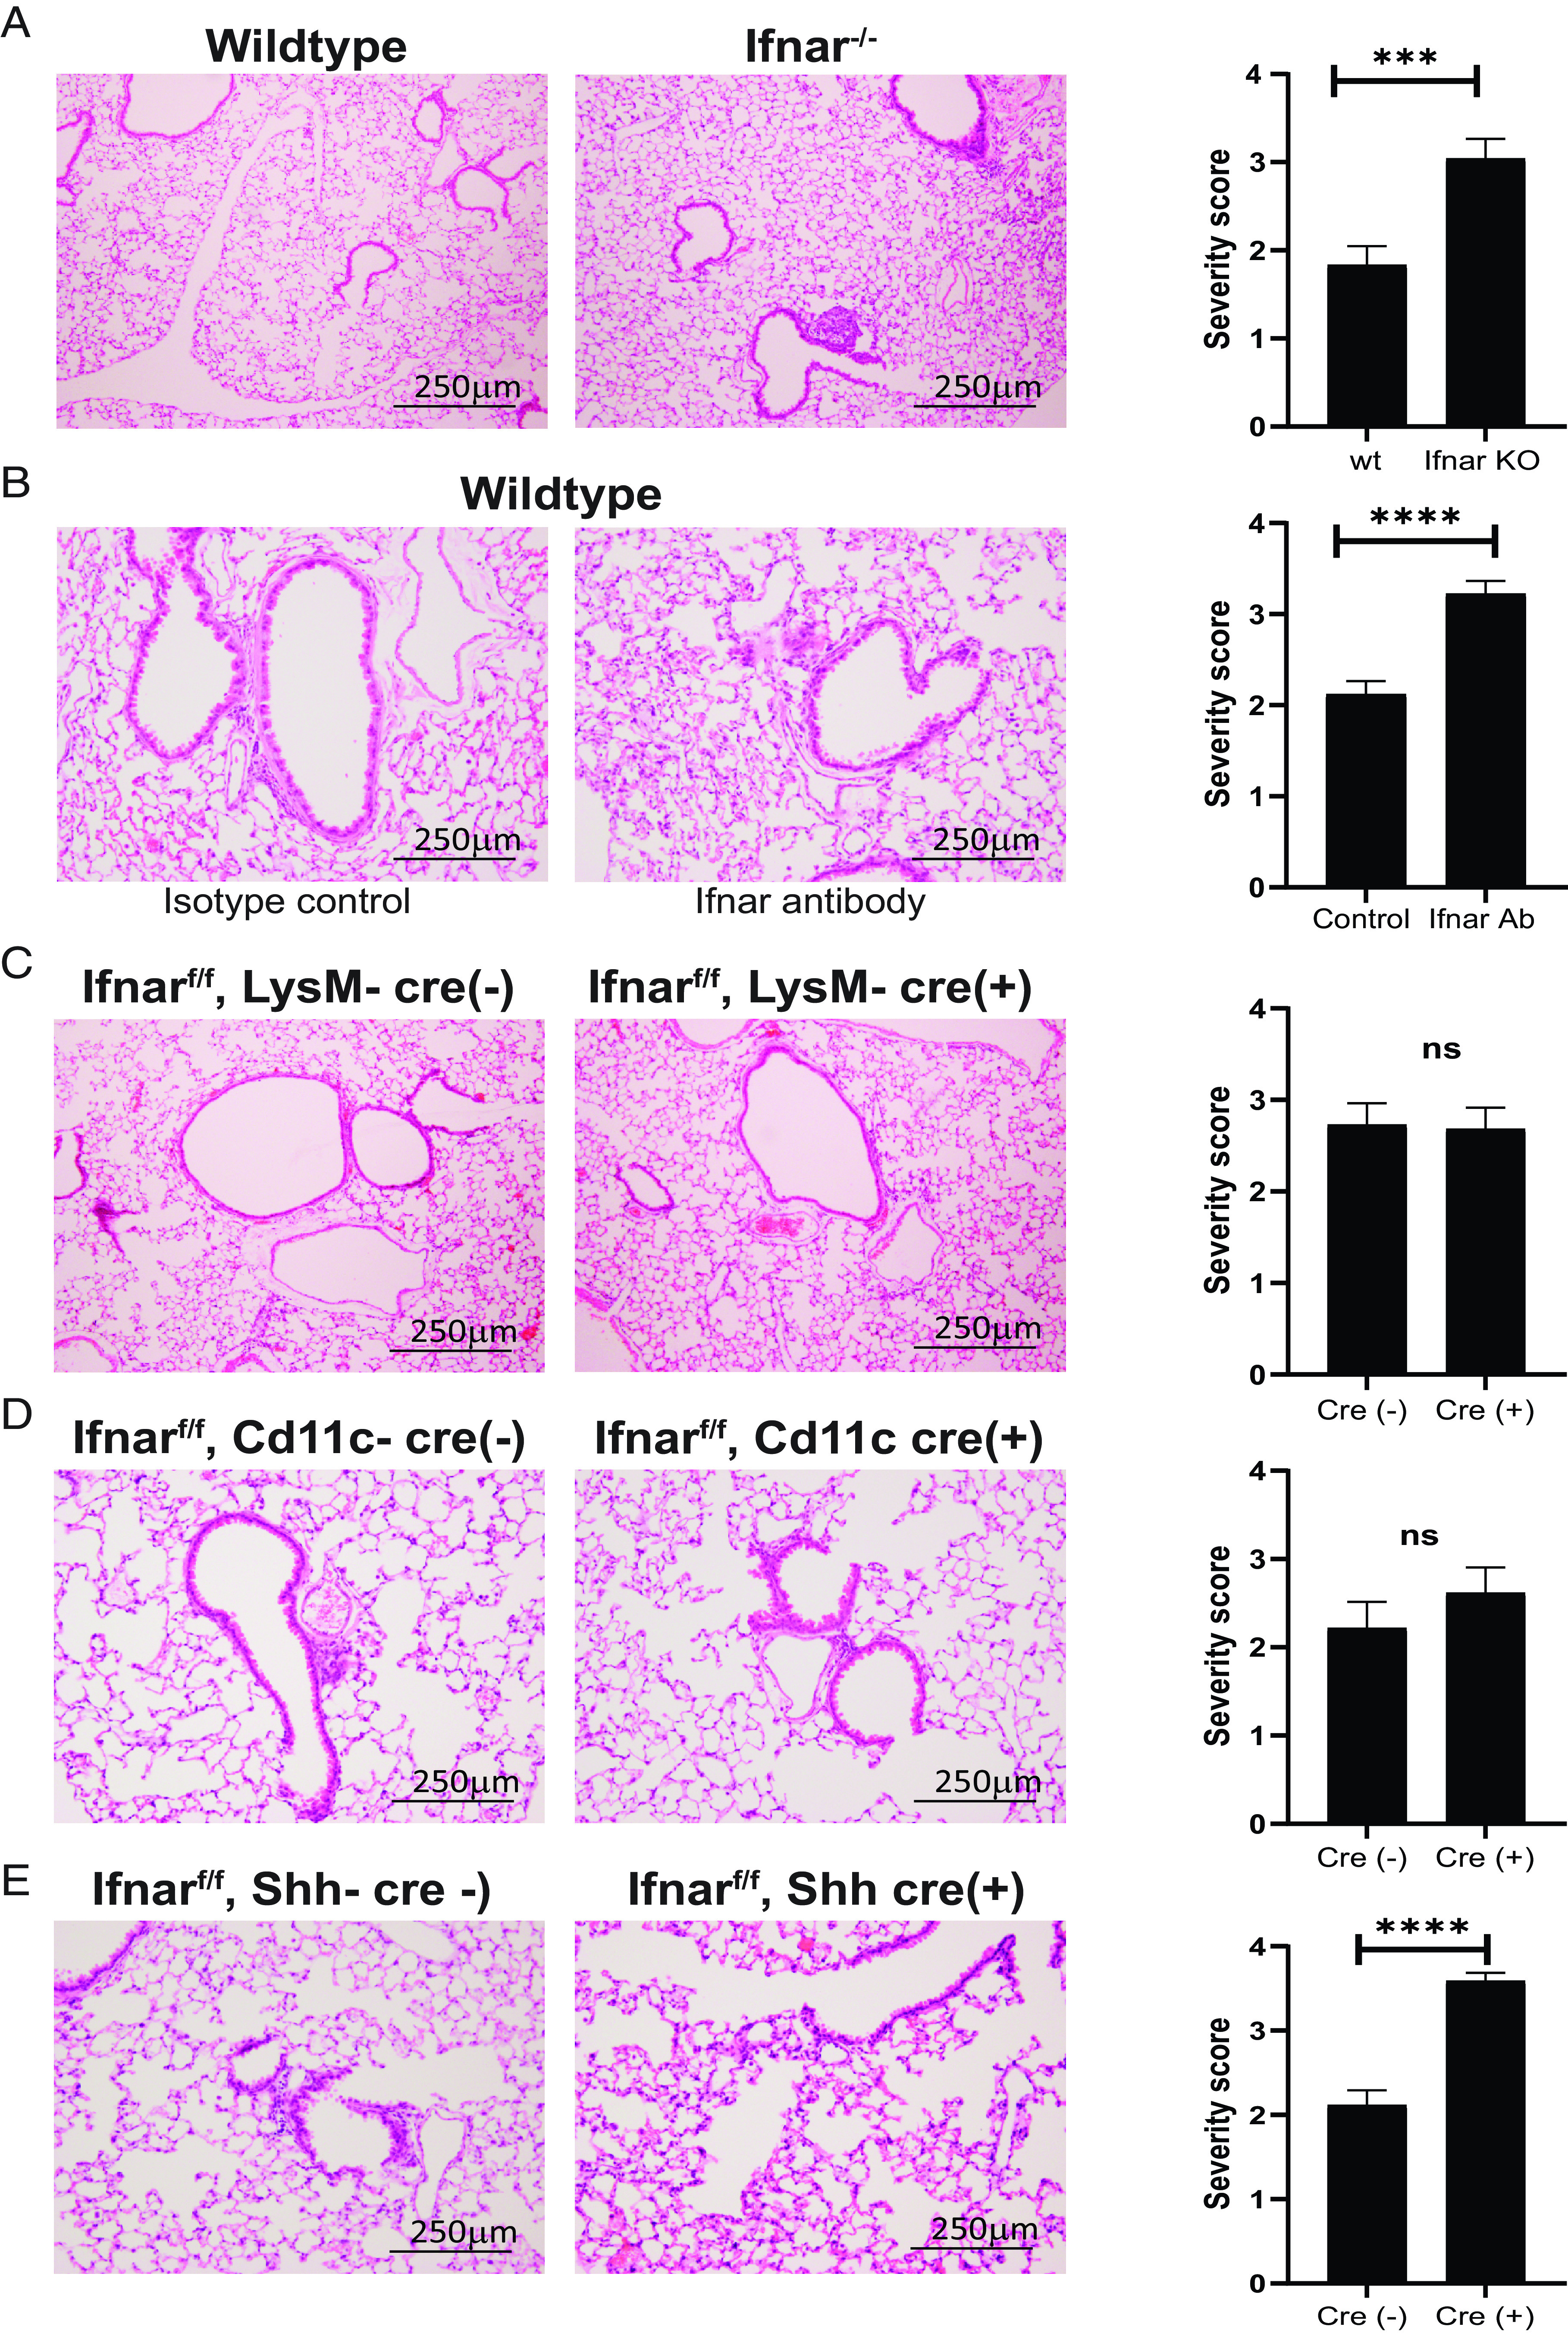
SARS-CoV-2, the virus that has caused the COVID-19 pandemic, robustly activates the host immune system in critically ill patients. Understanding how the virus engages the immune system will facilitate the development of needed therapeutic strategies. In this study, we demonstrate both in vitro and in vivo that the SARS-CoV-2 surface proteins spike (S) and envelope (E) activate the key immune signaling IFN pathway in both human and mouse immune and epithelial cells independent of viral infection and replication. These proteins induce reactive oxidative species generation and increases in human- and murine-specific, IFN-responsive cytokines and chemokines, similar to their upregulation in critically ill COVID-19 patients. Induction of IFN signaling is dependent on canonical but discrepant inflammatory signaling mediators, as the activation induced by S is dependent on IRF3, TBK1, and MyD88, whereas that of E is largely MyD88 independent. Furthermore, these viral surface proteins, specifically E, induced peribronchial inflammation and pulmonary vasculitis in a mouse model. Finally, we show that the organized inflammatory infiltrates are dependent on type I IFN signaling, specifically in lung epithelial cells. These findings underscore the role of SARS-CoV-2 surface proteins, particularly the understudied E protein, in driving cell specific inflammation and their potential for therapeutic intervention.
Copyright © 2021 by The American Association of Immunologists, Inc.
Conflict of interest statement
The authors have no financial conflicts of interest.
Figures
Similar articles
-
SARS-CoV-2 Isolates Show Impaired Replication in Human Immune Cells but Differential Ability to Replicate and Induce Innate Immunity in Lung Epithelial Cells.Microbiol Spectr. 2021 Sep 3;9(1):e0077421. doi: 10.1128/Spectrum.00774-21. Epub 2021 Aug 11. Microbiol Spectr. 2021. PMID: 34378952 Free PMC article.
-
Differential plasmacytoid dendritic cell phenotype and type I Interferon response in asymptomatic and severe COVID-19 infection.PLoS Pathog. 2021 Sep 2;17(9):e1009878. doi: 10.1371/journal.ppat.1009878. eCollection 2021 Sep. PLoS Pathog. 2021. PMID: 34473805 Free PMC article.
-
Induction of interferon-gamma-inducible protein 10 by SARS-CoV infection, interferon alfacon 1 and interferon inducer in human bronchial epithelial Calu-3 cells and BALB/c mice.Antivir Chem Chemother. 2010 Mar 9;20(4):169-77. doi: 10.3851/IMP1477. Antivir Chem Chemother. 2010. PMID: 20231782
-
Critical Determinants of Cytokine Storm and Type I Interferon Response in COVID-19 Pathogenesis.Clin Microbiol Rev. 2021 May 12;34(3):e00299-20. doi: 10.1128/CMR.00299-20. Print 2021 Jun 16. Clin Microbiol Rev. 2021. PMID: 33980688 Free PMC article. Review.
-
Janus kinase signaling as risk factor and therapeutic target for severe SARS-CoV-2 infection.Eur J Immunol. 2021 May;51(5):1071-1075. doi: 10.1002/eji.202149173. Epub 2021 Mar 22. Eur J Immunol. 2021. PMID: 33675065 Free PMC article. Review.
Cited by
-
SARS-CoV-2 E protein interacts with BRD2 and BRD4 SEED domains and alters transcription in a different way than BET inhibition.Cell Mol Life Sci. 2024 Jul 27;81(1):313. doi: 10.1007/s00018-024-05343-8. Cell Mol Life Sci. 2024. PMID: 39066826 Free PMC article.
-
Thermal Water Reduces the Inflammatory Process Induced by the SARS-CoV-2 Spike Protein in Human Airway Epithelial Cells In Vitro.Biomedicines. 2024 Dec 21;12(12):2917. doi: 10.3390/biomedicines12122917. Biomedicines. 2024. PMID: 39767823 Free PMC article.
-
Chilblains-Like Lesions in Pediatric Patients: A Review of Their Epidemiology, Etiology, Outcomes, and Treatment.Front Pediatr. 2022 Jun 23;10:904616. doi: 10.3389/fped.2022.904616. eCollection 2022. Front Pediatr. 2022. PMID: 35813389 Free PMC article. Review.
-
TLR4 is one of the receptors for Chikungunya virus envelope protein E2 and regulates virus induced pro-inflammatory responses in host macrophages.Front Immunol. 2023 Apr 20;14:1139808. doi: 10.3389/fimmu.2023.1139808. eCollection 2023. Front Immunol. 2023. PMID: 37153546 Free PMC article.
-
The spike protein of SARS-CoV-2 induces inflammation and EMT of lung epithelial cells and fibroblasts through the upregulation of GADD45A.Open Med (Wars). 2023 Nov 15;18(1):20230779. doi: 10.1515/med-2023-0779. eCollection 2023. Open Med (Wars). 2023. PMID: 38025528 Free PMC article.
References
MeSH terms
Substances
LinkOut - more resources
Full Text Sources
Molecular Biology Databases
Miscellaneous
