. 2021 Jun 2;4(7):e202000969.
doi: 10.26508/lsa.202000969. Print 2021 Jul.

Specific N-cadherin-dependent pathways drive human breast cancer dormancy in bone marrow

Affiliations

Specific N-cadherin-dependent pathways drive human breast cancer dormancy in bone marrow

Garima Sinha et al. Life Sci Alliance. .

Abstract

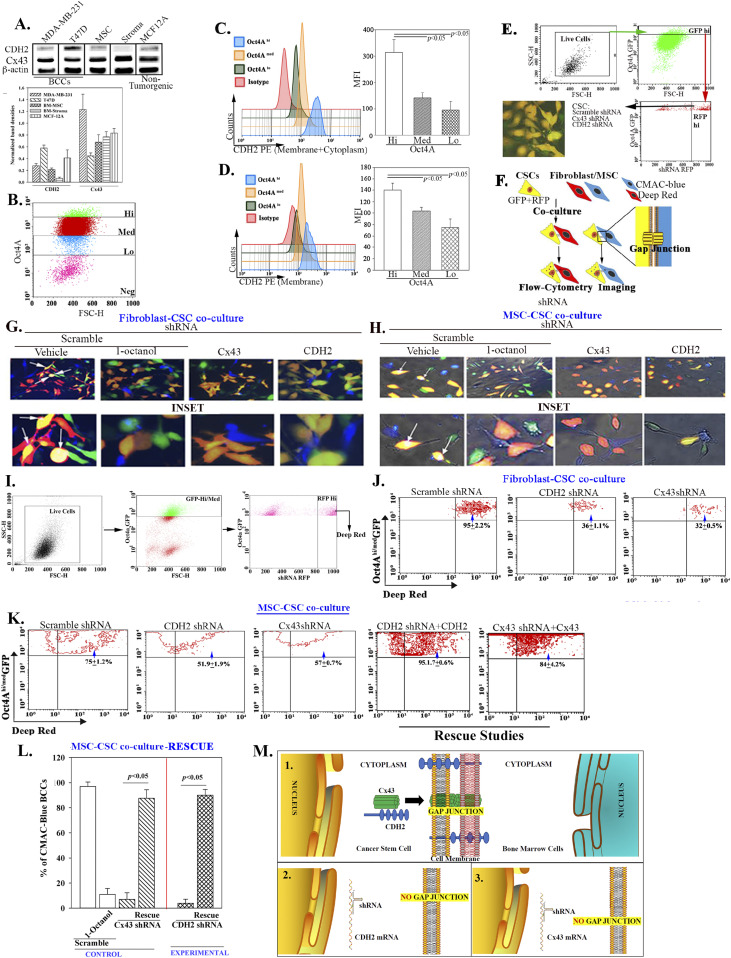
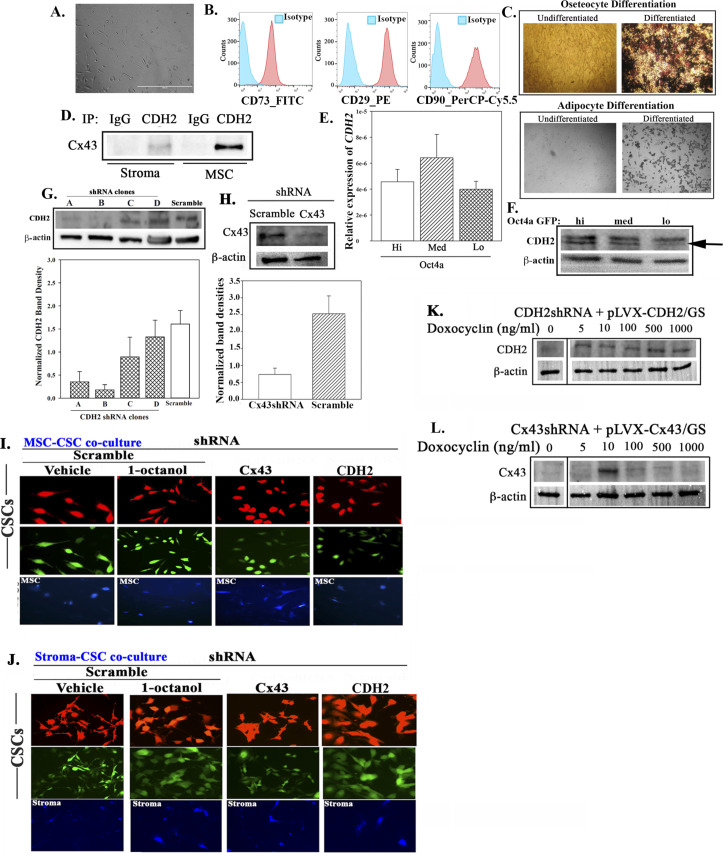
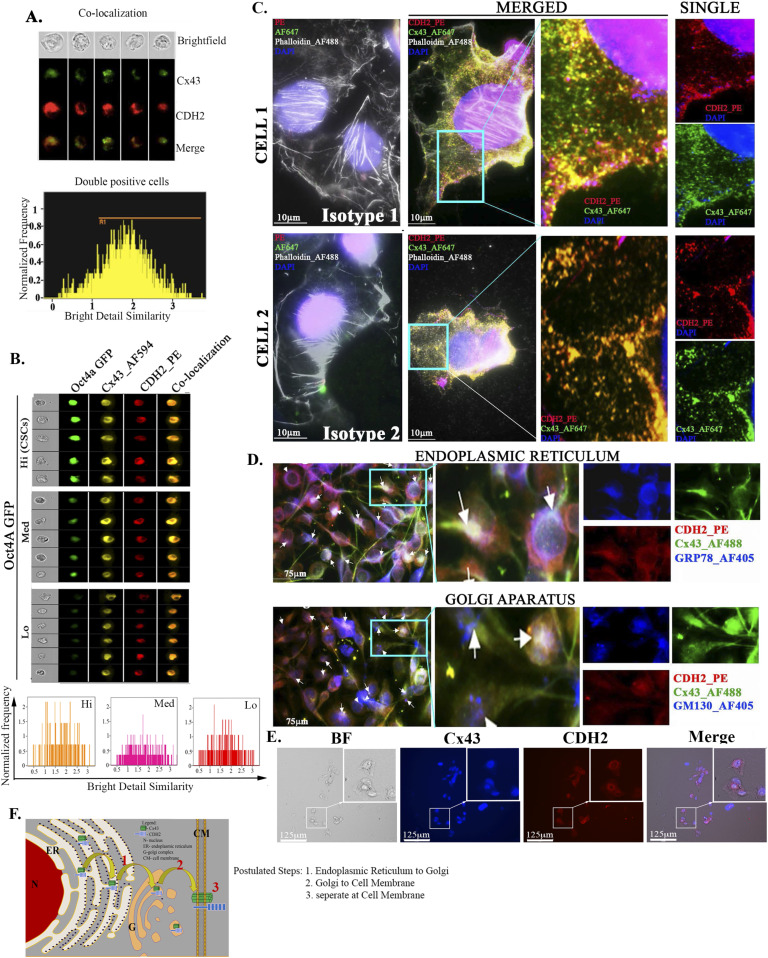
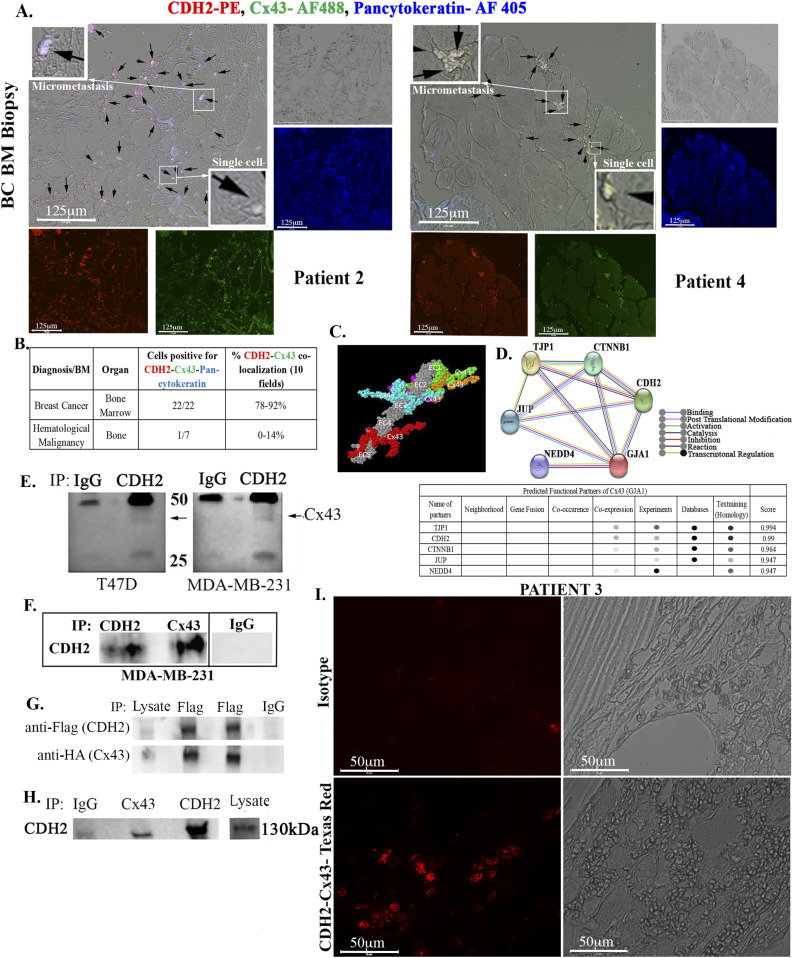
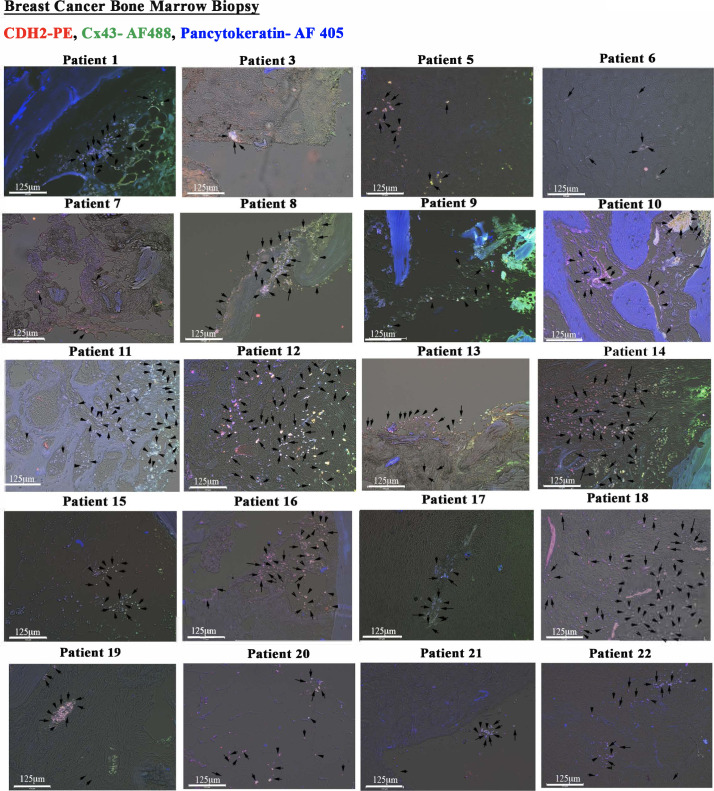
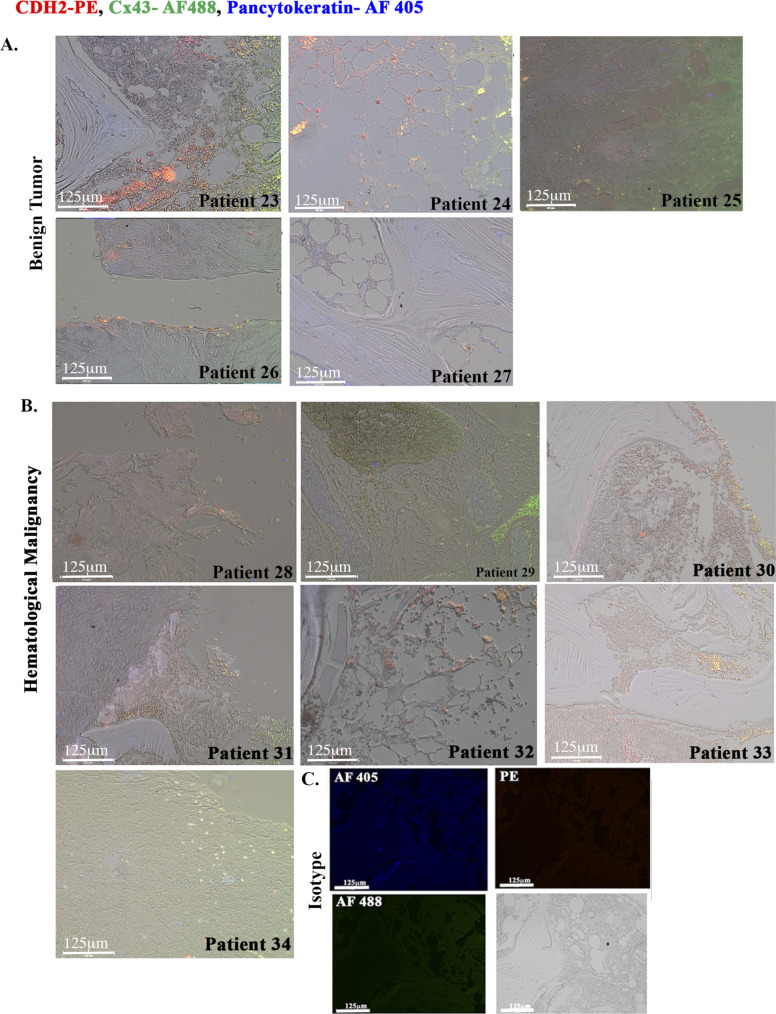
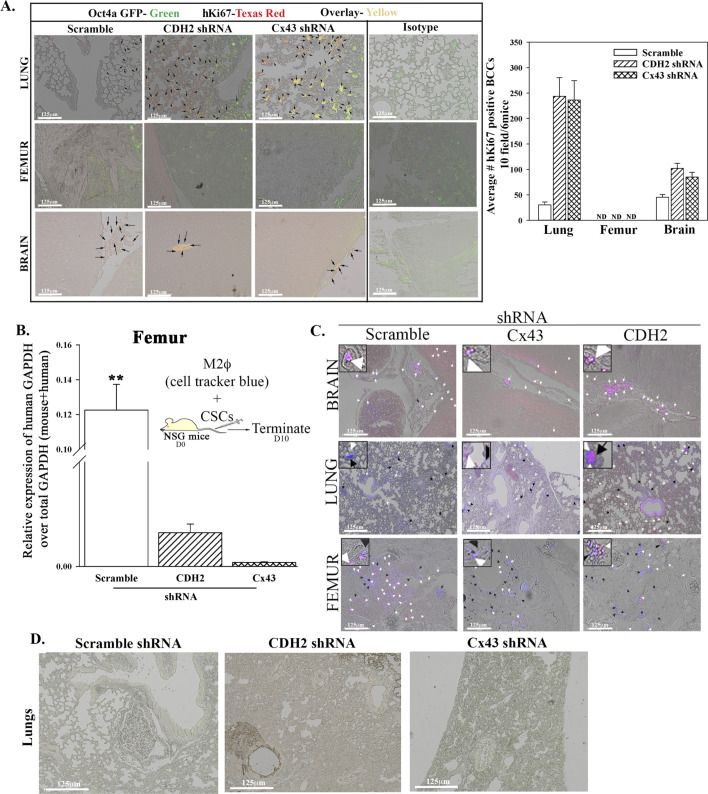
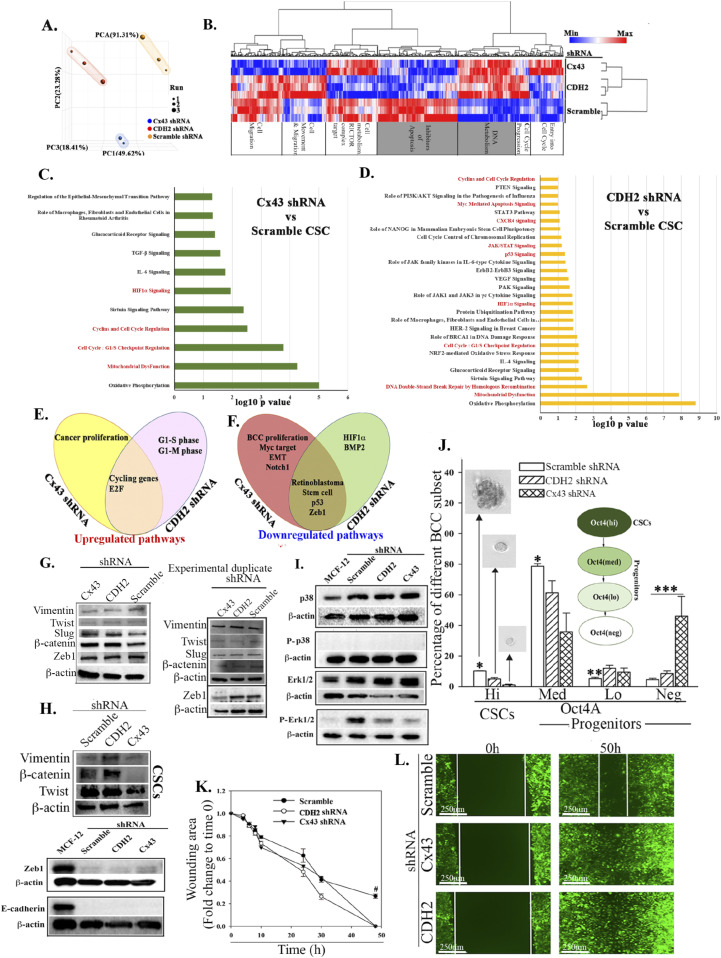
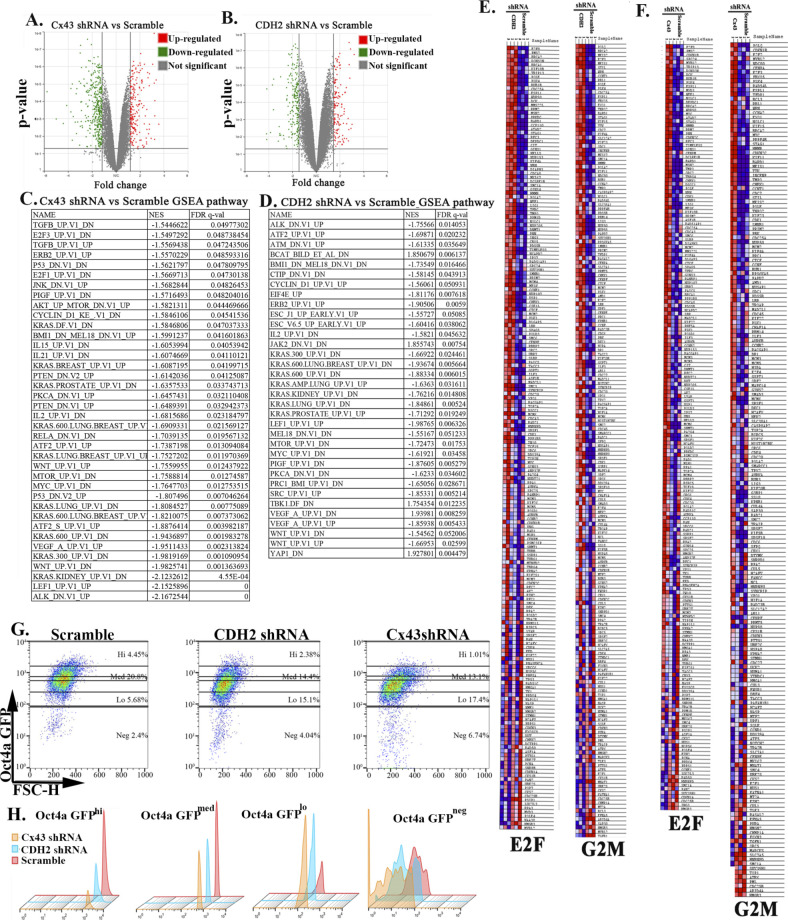
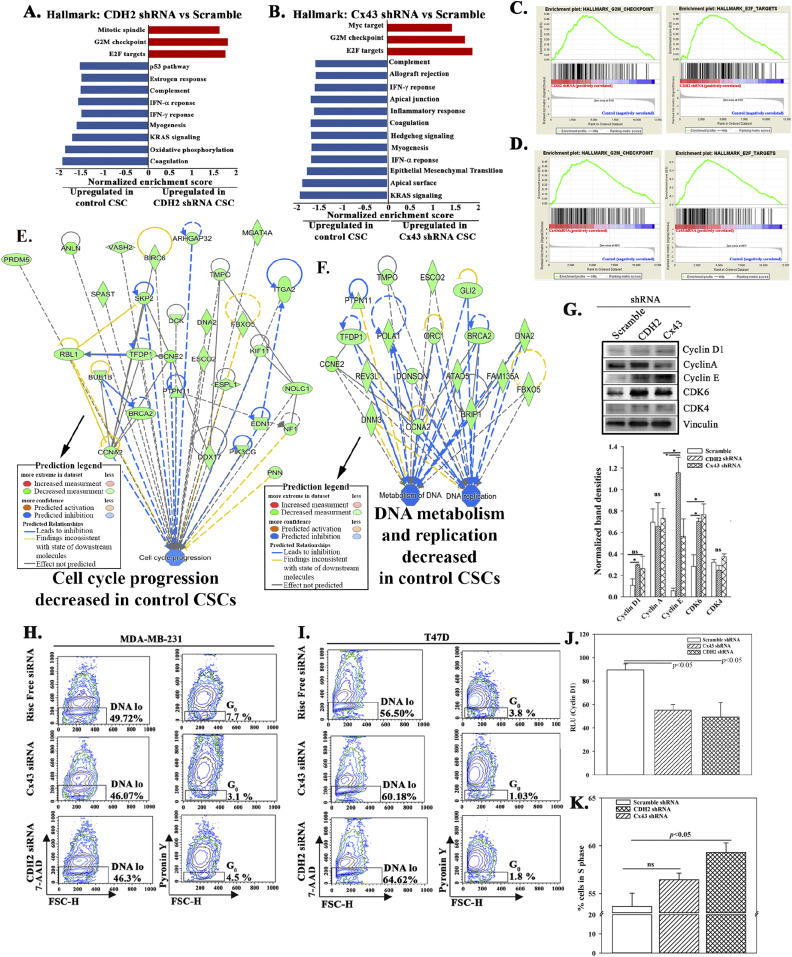
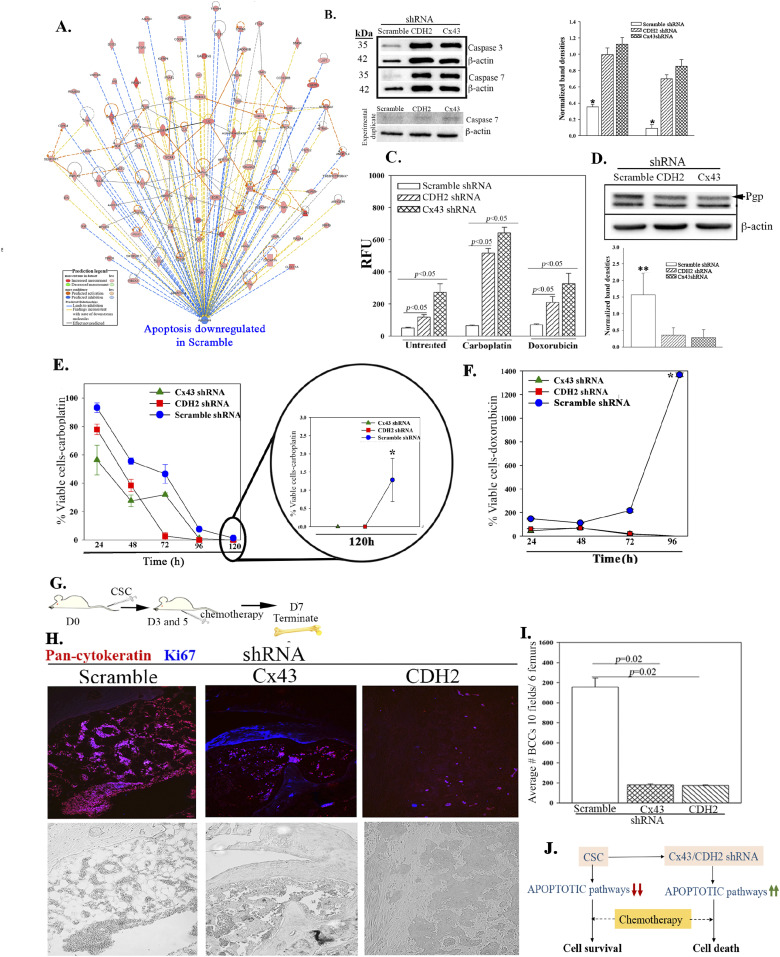
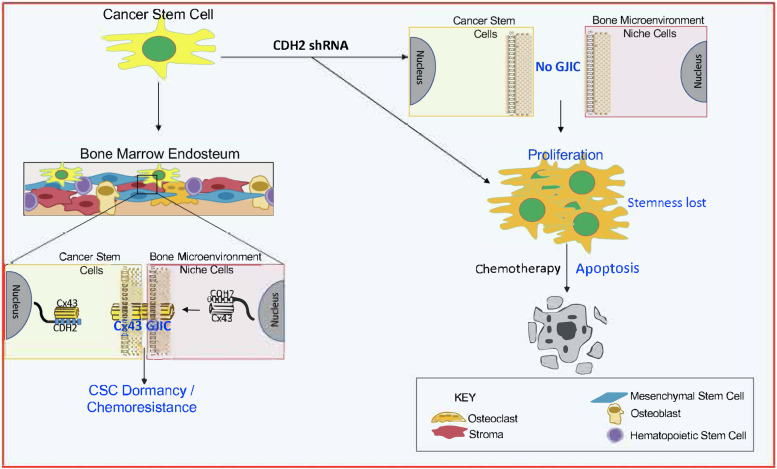
The challenge for treating breast cancer (BC) is partly due to long-term dormancy driven by cancer stem cells (CSCs) capable of evading immune response and resist chemotherapy. BC cells show preference for the BM, resulting in poor prognosis. CSCs use connexin 43 (Cx43) to form gap junctional intercellular communication with BM niche cells, fibroblasts, and mesenchymal stem cells (MSCs). However, Cx43 is an unlikely target to reverse BC dormancy because of its role as a hematopoietic regulator. We found N-cadherin (CDH2) and its associated pathways as potential drug targets. CDH2, highly expressed in CSCs, interacts intracellularly with Cx43, colocalizes with Cx43 in BC cells within BM biopsies of patients, and is required for Cx43-mediated gap junctional intercellular communication with BM niche cells. Notably, CDH2 and anti-apoptotic pathways maintained BC dormancy. We thereby propose these pathways as potential pharmacological targets to prevent dormancy and chemosensitize resistant CSCs.


Conflict of interest statement

The authors declare that they have no conflict of interest.

Figures

Figure 1.
Figure 1.. CDH2 in gap junctional intercellular communication (GJIC).
(A) Top panel: Western blot for CDH2 and Cx43 with whole-cell extracts from BCCs, stromal fibroblast, and MCF12A. The normalized band densities are shown below. (B) Shown is the gating scheme to select different BCC subsets with MDA-MB-231 cells with stable pEGFP1-Oct4A. (C, D) Representative histogram for flow cytometry for total (intracellular + membrane) (C) and membrane (D) CDH2 (left). The mean fluorescence intensities are presented ±SD for five independent analyses (right). (E) The gating scheme used to sort cancer stem cells (CSCs) (GFP), knockdown for CDH2 (RFP) or Cx43 (RFP). Lower left shows a representative image of the sorted cells (GFP + RFP = Yellow). (F) Diagram for the assay used to detect dye transfer from stromal fibroblast to CSCs. (G, H) MDA-MB-231-pOct4A-GFP were transfected with scramble-RFP (control), CDH2-shRNA-RFP, or Cx43-shRNA-RFP and then co-cultured) in four-well chamber slides at 1:1 ratio with BM stromal fibroblasts or mesenchymal stem cells (MSCs), respectively. The two latter cells were labeled with CMAC (blue). After 72 h, the cells were imaged for dye transfer using EVOS FL2 Auto 2 (200×). Parallel co-cultures with scramble shRNA contained 300 µM 1-octanol. Dye transfer is shown in the white areas (arrows). Larger images of the top images are shown below. (G, H, I) Gating scheme: the imaging studies for dye transfer in “(G, H)” were repeated by flow cytometry as follows: BM fibroblasts and MSCs were labeled with deep red dye. The live cells were gated based on FSC and SSC. After this, we selected RFPhi (shRNA) BCCs within the Oct4a-GFPhi/med subset then analyze for deep red dye transfer into the selected BCCs. (J) Flow cytometry representing the % dye transfer in fibroblast (included in the respective quadrant). (K) Flow cytometry representing the % dye transfer in MSCs (included in the respective quadrant). The last two panels show that CDH2 and Cx43 were rescued in the respective knockdown CSCs and then used for dye transfer from MSC into Oct4aGFPhi/med BCCs by flow cytometry. The % dye transfer is shown within the respective quadrant. (K, L) The rescue studies in (K) were repeated by imaging except for labeling MSCs with CMAC-blue dye. The cells showing dye transfer were imaged with the EVOS FL Auto 2, 200× magnification. The data were quantified with imageJ and then presented as mean % CMAC ± SD/10 fields/experiment (n = 3). M) (1) CDH2–Cx43 complex in the cytosol shown moving to the cell membrane where GJIC is established with BM niche cells. (2) CDH2 knockdown prevents Cx43 membrane localization, blunting CSC to form GJIC with BM niche cells. (3) Cx43 knockdown decreases GJIC on the membrane. Source data are available for this figure.
Figure S1.
Figure S1.. Supporting data for Fig 1.
(A) Representative image of Passage 3 mesenchymal stem cells (MSCs), 400× magnification. (B) Flow cytometry represents BM-MSC characterization. Cells were labeled with anti–CD73-FITC, anti–CD29-PE, and anti–CD90-PerCP-Cy5.5. (C) Induced differentiation of BM-MSCs was performed by culturing the cells in maintenance media or differentiation media (osteogenic or adipogenic). After week 3, cells in the osteocytic media were counter stained with Von Kossa to assess calcium deposit. Representative images are shown for osteocytes (top) and adipocyte (bottom). (D) Whole-cell lysates from BM-MSCs or BM stromal cells were immunoprecipitated with anti-CDH2 or IgG (Antibody control) and then electrophorese on 12% SDS–PAGE. The proteins were transferred onto PVDF membrane for blotting with anti-Cx43. (E) Real time PCR for CDH2. The results were normalized for β-actin and then presented as the mean ± SD (n = 5) relative expression. (F) Western blot with extracts from BC cell subsets: Oct4a-GFPhi, med or lo. (G, H) Top panel: Western blot for CDH2 (F) and Cx43 (G) using whole-cell extracts from MDA-MB-231, transfected with shRNA (scramble, CDH2, or Cx43). Bottom panel: normalized band densities. (H, I, J) Dye transfer assay: M-Oct4-GFP/scramble-RFP, M-Oct4-GFP/CDH2-shRNA-RFP, and M-Oct4 GFP/Cx43-shRNA-RFP were co-cultured at 1:1 ratio with CMAC-blue–labeled BM-stroma (H) or BM-MSCs (I) in four well chamber slides. After 72 h, the cells were imaged for dye transfer. Negative control used co-cultures of M-Oct4-GFP/scramble-RFP and CMAC-blue–labeled stroma or MSCs in the presence of 300 µM 1-octanol. The white spots (white arrows) in the vehicle-treated M-Oct4-GFP/scramble-RFP indicate dye transfer. Inset: enlarged image depicts cells with dye transfer. The cells were imaged using EVOS FL2 Auto 2 at 200× magnification. (K, L) CDH2-shRNA and Cx43 shRNA MDA-MB-231 were infected with inducible lentiviral particle pLVX-CDH2/GS and pLVX-Cx43/GS, respectively. After overnight infection, the cells were induced with different concentrations of doxocycline: 0, 5, 10, 100, 500, and 1,000 ng/ml. After 24 h, proteins were isolated and Western blot performed for CDH2 and Cx43. The membranes were stripped and reprobed with anti–β-actin. Source data are available for this figure.
Figure 2
Figure 2. Colocalization of CDH2 and Cx43 in unsorted BC cells.
(A) ImageStream analyses of single cells for colocalized CDH2 (PE) and Cx43 (AF610) in MDA-MB-231. Upper panel: top row, bright-field cells; lower rows, fluorescence imaging of single cells; Lower panel: histogram of fluorescence distribution for the merged images. (A, B) Upper panel: ImageStream analyses was repeated as for “(A),” except with different BC cell subsets (Oct4hi, Octmed, and Oct4lo) from MDA-MB-231-Oct4a-GFP cells; lower panel: histogram of fluorescence distribution for the merged images. (C) Nanoscale imaging of MDA-MB-231, labeled with anti–CDH2-PE (red) and anti–Cx43-AF647 (green), actin with AF488 Phalloidin (white/grey) and nuclei with DAPI (Blue). Slides were imaged with the Nanoimager S Mark II, 1,000× magnification. Cells 1 and 2 represent images of colocalized CDH2 and Cx43 (yellow). Enlarged sections, second from right column, with the respective channels at the far-right column. Isotype control is shown at the far-left column. (D) MDA-MB-231 cells were colabeled with anti–CDH2-PE, anti–Cx43-AF488, and anti–GRP78-AF405 (ER) or anti–GM130 AF405 (Golgi G). The cells were imaged with EVOS FL2 Auto at 200× magnification. (E) MDA-MB-231 cells were treated with 5 μg/ml brefeldin-A. After 24 h, the cells were washed and then colabeled with anti–CDH2-PE and anti–Cx43-AF405 followed by imaging with EVOS FL2 Auto at 200× magnification. (F) Cartoon summaries the organelle labeling for colocalized CDH2 and Cx43 from ER to G and then to cell membrane.
Figure 3.
Figure 3.. CDH2-Cx43 interaction and colocalization in BM biopsies of BC patients.
(A) Representative images of tissue sections from biopsies of BC patients (A and S2), hematological malignancy (S3), and benign tumor (S3). The slides were colabeled with anti–CDH2-PE (red), anti–Cx43-AF488 (green), and anti–pan-cytokeratin-AF405 (blue). Images were acquired with EVOS FL Auto 2, 200× magnification. Black arrows show colocalized Cx43 and CDH2 in the white areas (red + green + blue). Inset, zoomed regions of colocalized proteins. (B) Table summarizes the total number of sections positive for colocalized CDH2, Cx43 in pan-cytokeratin + cells. ImageJ software was used to count the colocalized cells in 10 fields/slide. The last column shows the percentages of colocalized CDH2-Cx43. See also Table S1 and Figs S2 and S3. (C, D) Computational and functional prediction of CDH2–Cx43 interaction using ZDOCK (C) and STRING (D), respectively. CDH2, Cadherin-2 (N-cadherin); TJP1, tight junction protein 1; CTNNB1, β catenin; GJA1, gap junction alpha protein 1(Cx43); JUP, junction plakoglobin; NEDD4, neural precursor cell expressed, developmentally down-regulated 4. (E) Whole cell lysates from MDA-MB-231 and T47D were immunoprecipitated with anti-CDH2 or IgG and then electrophoresed on 12% SDS–PAGE. The membranes were blotted with anti-Cx43 (light band at 43 kD). (F) Whole-cell lysated from MDA-MB-231 cells were subjected to immunoprecipitation (IP) with anti-CDH2 or anti-Cx43. The membrane was blotted with anti-CDH2. (G) MDA-MB-231 was transfected with pCMV2-CDH2 Flag and pcDNA 3.2-Cx43-HA. Protein lysates were immunoprecipitated with anti-Flag or anti-IgG and blotted with anti-Flag or anti-HA. (H) Lysates from cancer stem cells, isolated from MDA-MB-231 were immunoprecipitated with anti-IgG, anti-Cx43, or anti-CDH2. The samples were electrophoresed and then blotted with anti-CDH2. (I) BM biopsy from BC patient (#3) was subjected Proximity Ligation Assay with anti-CDH2 and anti-Cx43. The proximity of the two antibodies was determined using EVOS FL Auto 2, 600× magnification. Control slide was labeled with isotype control. Source data are available for this figure.
Figure S2.
Figure S2.. Immunohistochemistry for CDH2 and Cx43 with paraffin sections of BM biopsies from patients with breast cancer.
Tissues were sectioned from paraffin-embedded biopsies of patients diagnosed with breast cancer. The tissues were colabeled with anti–CDH2-PE, anti–Cx43-AF488, and anti–pan-cytokeratin-AF405. The slides were imaged with EVOS FL Auto 2 at 200× magnification. Representative tissues show colocalized Cx43 and CDH2 in pan-cytokeratin+ cells (white spots). Because of the large number of white spots, representative spots are depicted with black arrows.
Figure S3.
Figure S3.. Immunohistochemistry for CDH2 and Cx43 with paraffin sections of hematological malignancy and benign tumor.
(A, B) Tissues were sectioned from stored paraffin-embedded biopsies from patients diagnosed with other benign tumor (A) and hematological malignancy (B). The tissues were labeled with anti–CDH2-PE, anti–Cx43-AF488, and anti–pan-cytokeratin-AF405. The slides were imaged with EVOS FL Auto 2 at magnification of 200×. (C) Representative tissues are shown for colocalized Cx43 and CDH2 (yellow spots), which stained negative for pan-cytokeratin.
Figure 4.
Figure 4.. Organ localization of BC cells knockdown for CDH2, in vivo.
(A) Cartoon summarizes study design. (B) 5 × 10⁵ cancer stem cells from MDA-MB-231-Oct4-GFP, knockdown for CDH2 (RFP) or Cx43 (RFP), or control with scramble shRNA (RFP) were injected intravenously into NSG mice. At day 10, the lungs, brain, and femurs were harvested. Cells from one femur/mouse were used to isolate total RNA for real time PCR with primers for human and mouse GAPDH. The results are presented as human GAPDH/Total GAPDH (human & murine) ±SD, n = 6. **P < 0.05 versus CDH2 and Cx43 knockdown. Fluorescence image: yellow arrow represents pan-cytokeratin positive cells (Texas red); white arrows: Ki67-Alexa-AF405–positive cycling cells (blue + red = pink). (B, C) Paraffin embedded from “(B)” were imaged for cancer stem cells (RFP for knockdown vector + GFP for Oct4A = yellow) with EVOS FL Auto 2. Shown are 200× magnification for each image, representing six mice/group. (D, E) Quantitation by ImageJ of BC cells in the femur, lungs, and brain from “(E),” mean of 10 fields/slide for six mice ± SD. ***P < 0.05 versus lungs or brain.
Figure S4.
Figure S4.. In vivo studies for breast cancer dormancy.
(A) 5 × 10⁵ cancer stem cells (CSCs) from MDA-MB-231-Oct4a-GFP with scramble-RFP, CDH2-shRNA-RFP, or Cx43-shRNA-RFP were injected intravenously into NSG mice as outlined in Fig 4E. At day 10 lung, the femur and brain were harvested. The presence of BC cells in the brain, lungs, and femur was identified with labeling for human Ki67-Texas Red. The green Oct4a-GFP cells were overplayed Ki67-Texas Red–positive cells (yellow cells). Right graph: quantification by ImageJ for Ki67+ BC cells in the femur, lung, and brain, mean of 10 fields/slide for six mice ± SD. (B) 106 CMAC-blue–labeled M2 macrophages were coinjected intravenously with CSCs from MDA-MB-231-Oct4-GFP with scramble-RFP, CDH2-shRNA-RFP, or Cx43-shRNA-RFP. At day 10, the mice were euthanized, and the femur was flushed for RNA isolation. Graph represents the relative expression of human GAPDH over total (human + mouse) GAPDH. (C) The lungs, brain, and femur were imaged for pink cells (blue + RFP). n = 6 mice/group. Tissues were imaged with EVOS FL Auto 2 at magnification of 200×. (D) 5 × 10⁵ CSCs from MDA-MB-231-Oct4-GFP with CDH2-shRNA-RFP, or Cx43-shRNA-RFP were injected intravenously into NSG mice as outlined in Fig 7G. At day 7, the lungs was harvested and imaged for CSCs (yellow cells: GFP+ RFP) using EVOS FL2 at 200× magnification.
Figure 5
Figure 5. Next generation sequencing of cancer stem cells (CSCs), knockdown for CDH2 and Cx43.
(A) Principle component analyses of RNA-Seq data from the CSCs of the knockdown and control (scrambled) cells. (B) Heat map with genes using false discovery rate <0.05 and fold change for CDH2 versus scramble of 1.66 and Cx43 versus scramble 1.5. (C, D) IPA analyses showing significant changes, Cx43 or CDH2 knockdown versus scramble shRNA. The pathways were ranked using significance score (P < 0.01), also known as −log10 P-value times activation z-score. Red highlights: relevance to cell cycle and stem cell maintenance. (E, F) Venn diagram showing up- and down-regulated pathways of Cx43 or CDH2 knockdown versus scramble using significance scores of q < 0.05. (G, H) Western blot for epithelial mesenchymal transition proteins with whole cell extracts from the following: unsorted MDA-MB-231 (G); CDH2 or Cx43 knockdown CSCs, CSCs with scrambled shRNA (H). (I) Western blot for p38, P-p38, Erk1/2, and p-Erk1/2 with whole cell extracts from MCF12A and MDA-MB-231 CSCs with or without CDH2/Cx43 knockdown. (J) BC cell subsets were quantitated by flow cytometry, based on GFP with MDA-MB-231–p-Oct4a-GFP, also knockdown for CDH2 or Cx43 or control/scramble shRNA. The cells were gated as for Fig 1B and % subset plotted as mean ± SD, n = 4. Each subset was analyzed for tumorsphere and representative sphere shown for Oct4hi and Oct4med. No tumorsphere was formed with Oct4lo or neg. *P < 0.05 versus Oct4hi or Oct4med knockdowns; **P < 0.05 versus knockdowns; ***P < 0.05 versus scramble or knockdown. (K, L) Scratch assay with CSCs from MDA-MB-231, knockdown for CDH2 or Cx43 or control/scramble shRNA. The scratch areas were imaged at different times with EVOS FL Auto 2. The timeline changes are presented as mean fold changes ± SD, n = 3. Fold change is calculated as experimental/time 0 h. #P < 0.05 versus CDH2 and Cx43 knockdown. Scratch image (100×) is shown for the 50 h end point. Source data are available for this figure.
Figure S5.
Figure S5.. Next generation sequencing of cancer stem cells (CSCs) with or without CDH2 and Cx43 knockdown.
(A, B) Volcano plot for genes expressed (from next generation sequencing) in Cx43 or CDH2-shRNA versus scramble CSCs using Partek software, respectively. We generated the plot using P < 0.05, and fold change, 1.5 and 1.6, respectively. The green indicates genes up-regulated and red indicates genes down-regulated in knockdowns. (C, D) Gene set enrichment analyses pathway analysis of Cx43 or CDH2 knockdown versus scramble with the significance score of q < 0.05, respectively. (E, F) Representative Gene set enrichment analyses heat map for E2F and G2M hallmarks in CDH2 or Cx43 shRNA versus scramble CSCs (expansion of Fig 6C and D). (G, H) Gating scheme for Fig 5J. (G) The figure represents how different subsets were selected from MDA-MB-231 with Cx43, CDH2, and scramble shRNA. The subsets were selected based on GFP expression in Scramble using BD FACSCalibur. Top and bottom: 5% of the GFP cells are Oct4ahi, the center is Oct4amed, followed by Oct4alo and Oct4aneg. (H) Histogram for Fig S5G.
Figure 6.
Figure 6.. Cycling analyses of cancer stem cells (CSCs), knockdown for CDH2 or Cx43.
(A, B) Gene set enrichment analyses hallmarks for CDH2 or Cx43 knockdown versus scramble CSCs. The red and blue bars indicate up-regulated hallmarks in CDH2 knockdowns and control/scramble, respectively, with significance score of q < 0.05. (C, D) Representative gene set enrichment analyses graph showing top hallmarks, G2M and E2F, which were enriched in CDH2 and Cx43 knockdown, respectively. (E, F) IPA output showing cell cycle progression, DNA metabolism, and replication pathways that were down-regulated in CSCs (scramble), relative to CDH2 or Cx43 knockdown cells. Significance score used P < 0.01. (G) Western blot for cycle proteins with whole extracts from MDA-MB-231, knockdown for CDH2, and Cx43 or transfected with scramble shRNA. (H, I) The normalized band densities are shown below, mean ± SD, n = 3. *P < 0.05 (H, I) MDA-MB-231 (H) and T47D (I) were knockdown CDH2 and Cx43 with siRNA. Control cells used Risc free. The cells were labeled with PyY (RNA) and 7AAD (DNA). Cells with low RNA was gated within the low DNA area. The data were analyzed with BD Analyses software. (J) CDH2 or Cx43 knockdown MDA-MB-231-Oct4-GFP were transfected with cyclin D1 reporter gene vector. The reporter gene activity (luciferase) was normalized with pβ–gal activity and the values presented as mean relative luminescence unit ± SD, n = 4. (K) CDH2 or Cx43 knockdown MDA-MB-231 were labeled with 7AAD. The cells were analyzed for % cells in S-phase for each BC cell subset using ModFit software. The data are presented as mean S phase±SD, n = 3. Source data are available for this figure.
Figure 7.
Figure 7.. Apoptotic pathways in CDH2 knockdown cancer stem cells (CSCs).
(A) IPA output shows down-regulation of apoptotic pathways in control (scramble) CSCs relative to CDH2 and Cx43 knockdown CSCs. (B) Western blot for caspase 3 and 7 with whole cell extracts from CSCs with scramble shRNA or, CDH2 or Cx43 knockdown. The normalized band densities are shown at right. *P < 0.05 versus CDH2 or Cx43 knockdown. (C) Apoptotic activity was analyzed with Apo-ONE Homogeneous caspase 3/7 assay kit and the relative fluorescence unit presented for MDA-MB-231, knockdown for CDH2 or Cx43, or scramble shRNA. In parallel, the assay was performed with cells, treated with carboplatin (220 mg/ml) or doxorubicin (1 mM) for 4 h. (D) Western blot for Pgp with whole-cell extracts from CSCs from MDA-MB-231, knockdown for CDH2 or Cx43, or control/scramble shRNA. Bands were normalized with β-actin and presented at right, n = 3. **P < 0.05 versus Cx43 or CDH2 knockdown. (E) Cell viability was determined for MDA-MB-231, knockdown for CDH2 or Cx43, or control with scramble shRNA, treated with carboplatin (220 mg/ml). The analyses were performed at 24 h intervals up to 120 h using cell titer blue. The data are presented as % viable cells ± SD, n = 3. The percentage of viable cells at 120 h is zoomed on the right. *P < 0.05 versus knockdown cells at the 120 h time point. (E, F) The studies in “(E)” were repeated, except with doxorubicin (1 mM). *P < 0.05 versus Cx43 and CDH2 knockdown. (G) Protocol used to inject NSG mice, i.v. with 5 × 10⁵ CSCs isolated from MDA-MB-231-Oct4-GFP, knockdown for CDH2 (RFP), Cx43 (RFP), or scrambled shRNA (RFP). Mice were injected intraperitoneally with 5 mg/ml carboplatin at days 3 and 5. (H) At day 7, sections from paraffin embedded femurs were labeled with anti–pan-cytokeratin-Texas Red (red) and anti–Ki67-AF405 (blue). Tissues were imaged with EVOS FL Auto 2 at magnification of 200×. Images represent six mice/group. (I) The number of BC cells (red) in mouse femur from “(H)” was counted using ImageJ and presented as mean BC cells ± SD, n = 6. (J) Cartoon summarizes the data in this Figure: Decreased apoptotic pathways in CSCs impart chemoreistance. Cx43/CDH2 knockdown cells reversed the resistance to chemosensitization. Source data are available for this figure.
Figure 8.
Figure 8.. Summary.
CDH2 is required for Cx43-mediated GJ between cancer stem cells (CSC) and BM stromal cells. CDH2 knockdown led to increase in apoptotic genes. CDH2 knockdown increase cell cycle of CSCs and metastasis. CDH2/Cx43 knockdown chemosensitized CSCs.

Similar articles

Cited by

References

    1. Abravanel DL, Belka GK, Pan TC, Pant DK, Collins MA, Sterner CJ, Chodosh LA (2015) Notch promotes recurrence of dormant tumor cells following HER2/neu-targeted therapy. J Clin Invest 125: 2484–2496. 10.1172/JCI74883 - DOI - PMC - PubMed
    1. Alam MS (2018) Proximity ligation assay (PLA). Curr Protoc Immunol 123: e58. 10.1002/cpim.58 - DOI - PMC - PubMed
    1. Albrengues J, Shields MA, Ng D, Park CG, Ambrico A, Poindexter ME, Upadhyay P, Uyeminami DL, Pommier A, Küttner V, et al. (2018) Neutrophil extracellular traps produced during inflammation awaken dormant cancer cells in mice. Science 361: eaao4227. 10.1126/science.aao4227 - DOI - PMC - PubMed
    1. Arai F, Hosokawa K, Toyama H, Matsumoto Y, Suda T (2012) Role of N-cadherin in the regulation of hematopoietic stem cells in the bone marrow niche. Ann N Y Acad Sci 1266: 72–77. 10.1111/j.1749-6632.2012.06576.x - DOI - PubMed
    1. Berry DA (2013) Breast cancer screening: Controversy of impact. Breast 22: S73–S76. 10.1016/j.breast.2013.07.013 - DOI - PMC - PubMed

Publication types