. 2021 Jun 2;7(1):130.
doi: 10.1038/s41420-021-00515-y.

Epigenetic reprogramming promotes the antiviral action of IFNα in HBV-infected cells

Affiliations

Epigenetic reprogramming promotes the antiviral action of IFNα in HBV-infected cells

Luc Gailhouste et al. Cell Death Discov. .

Abstract

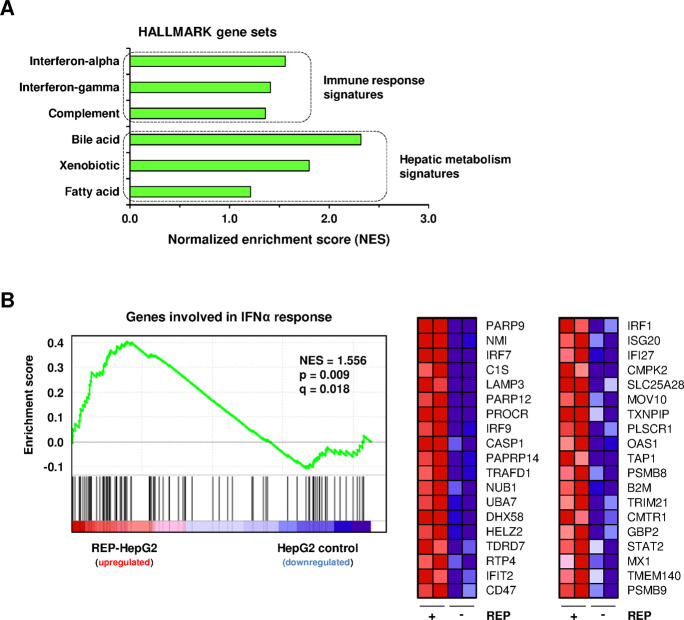
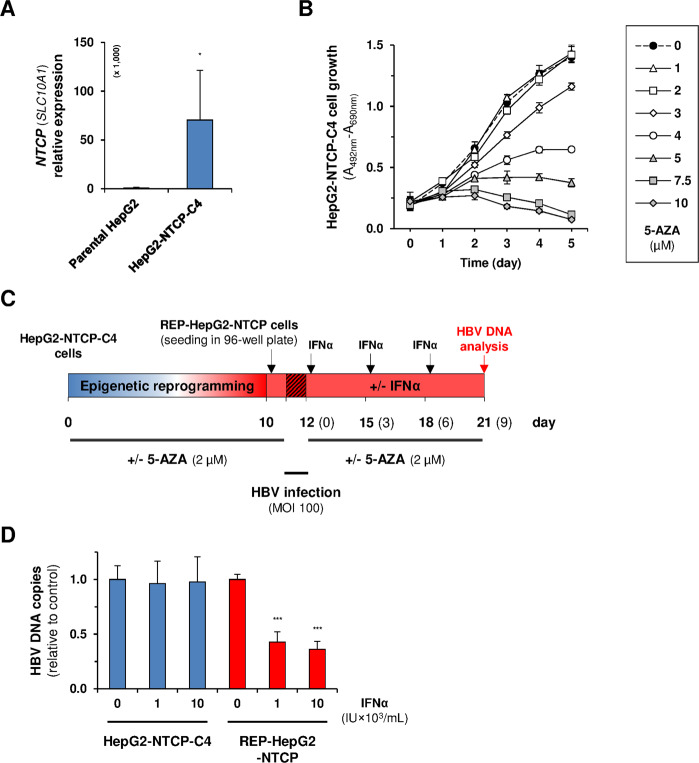
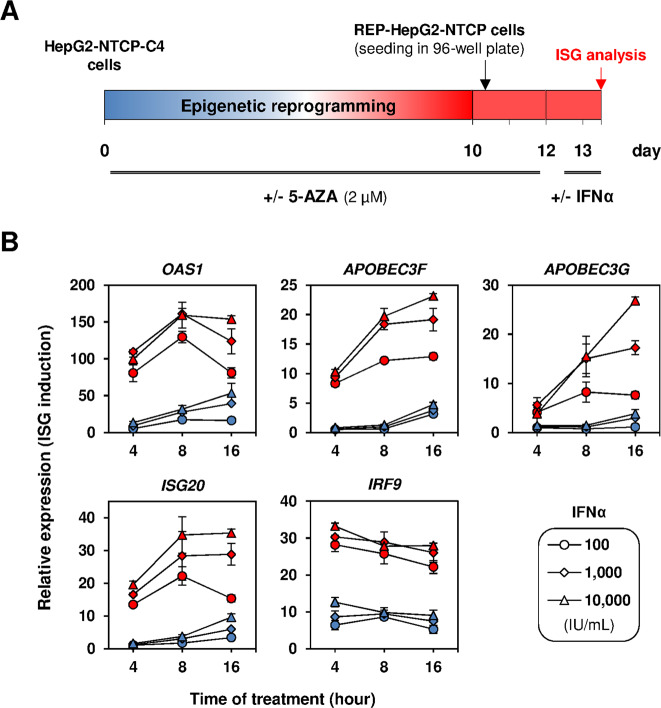
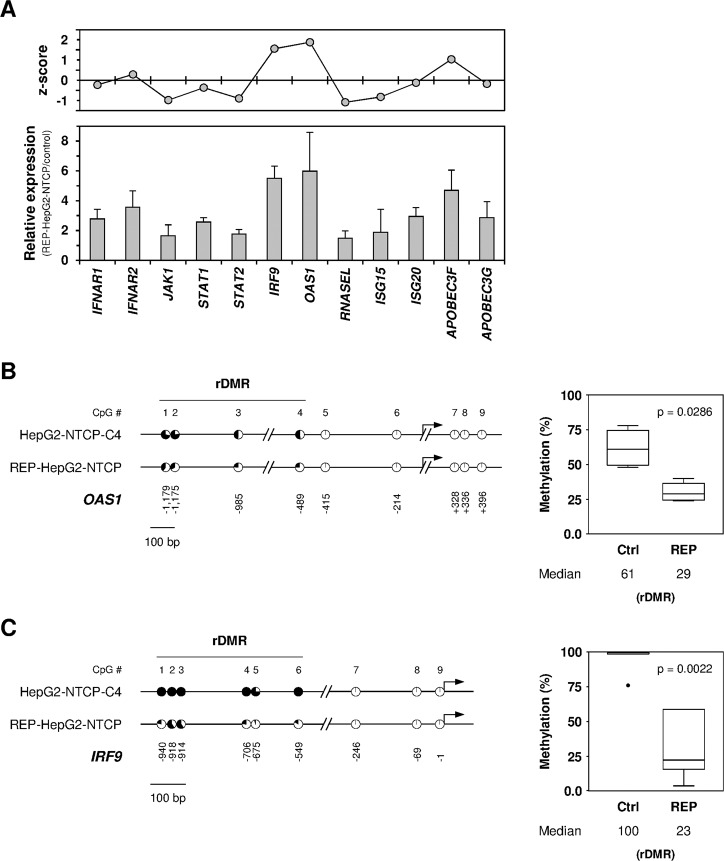
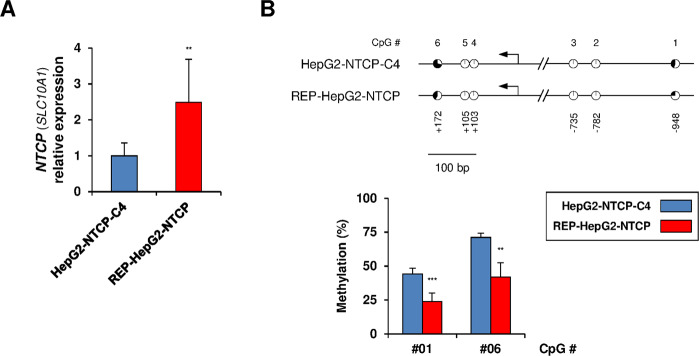
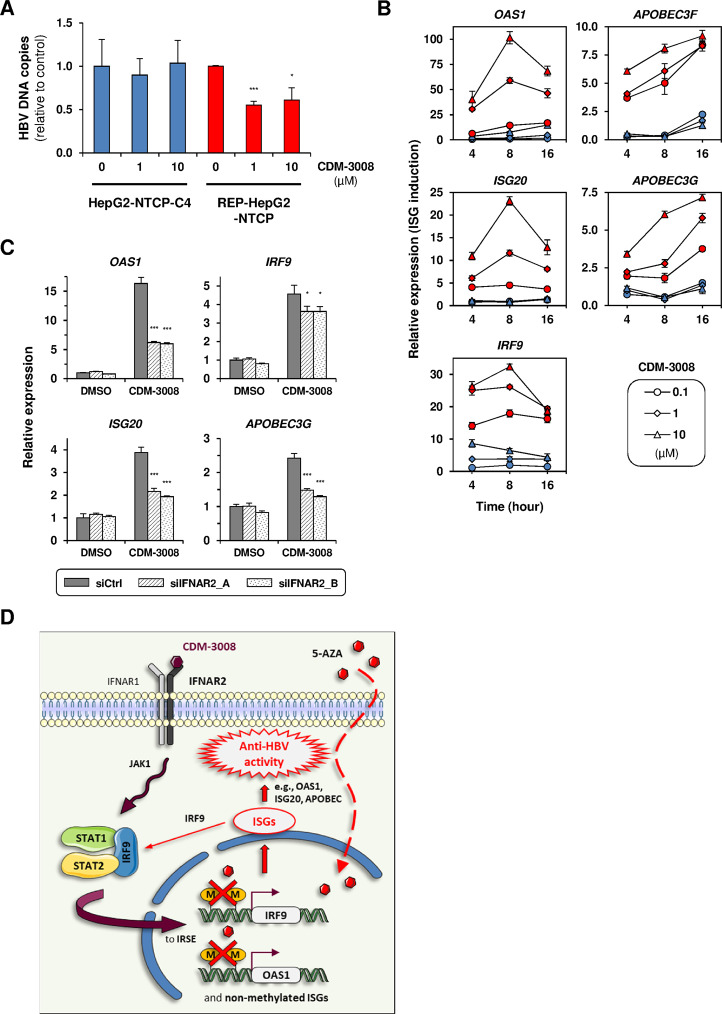
Chronic hepatitis B virus (HBV) infections remain a health burden affecting ~250 million people worldwide. Thus far, available interferon-alpha (IFNα)-based therapies have shown unsatisfactory cure rates, and alternative therapeutic molecules are still required. However, their development has been hampered because accessible cell models supporting relevant HBV replication and appropriate antiviral activity are lacking. Strategies that reverse epigenetic alterations offer a unique opportunity for cell reprogramming, which is valuable for restoring altered cellular functions in human cell lines. This work aimed to investigate the feasibility of converting HepG2 cells that stably overexpress the HBV entry receptor (sodium/taurocholate cotransporting polypeptide, NTCP) toward IFNα-responsive cells using epigenetic reprogramming. Herein, we showed that an epigenetic regimen with non-cytotoxic doses of the demethylating compound 5-azacytidine restored the anti-HBV action of IFNα in epigenetically reprogrammed HepG2-NTCP-C4 cells, named REP-HepG2-NTCP cells. Thus, a significant inhibition in HBV DNA levels was measured in REP-HepG2-NTCP cells after IFNα treatment. This inhibitory effect was associated with the enhancement of IFNα-mediated induction of critical interferon-stimulated genes (ISGs), which was limited in non-reprogrammed cells. In particular, our data indicated that re-expression of 2'-5'-oligoadenylate synthetase 1 (OAS1) and interferon regulatory factor 9 (IRF9) was the result of an epigenetically driven unmasking of these genes in reprogrammed cells. At last, we evaluated the therapeutic potential of the IFN analog CDM-3008 in REP-HepG2-NTCP cells and demonstrated the efficiency of this chemical compound in triggering ISG induction and HBV inhibition. In summary, this study shows that epigenetic reprogramming promotes the IFNα response in HBV-infected cells and is potentially attractive for cell-based experimental screening of IFN-like compounds.


Conflict of interest statement

The authors declare no competing interests.

Figures

Fig. 1
Fig. 1. Gene set enrichment analysis (GSEA) after epigenetic reprogramming of HepG2 cells.
A Relevant gene sets enriched in reprogrammed HepG2 (REP-HepG2) cells. Epigenetic reprogramming of HepG2 cells was achieved with a 2.5 µM 5-AZA regimen for 10 days. Untreated HepG2 cells were used as controls. The ranking of the depicted enriched gene sets was as follows: (#1) bile acid metabolism (molecular signature with the highest enrichment score in the HALLMARK gene datasets), (#3) xenobiotic metabolism, (#5) IFNα response, (#9) IFNγ response, and (#10) complement system. The enrichment of the hepatocyte metabolism signatures was consistent with the promotion of hepatic differentiation in the REP-HepG2 cells. The GSEA was performed using microarray data from the GSE160648 data set. B Enrichment plot and heat map for the genes involved in the IFNα response in the reprogrammed versus non-reprogrammed HepG2 cells (normalized enrichment score [NES] = 1.556; p = 0.009 and q = 0.018). See S. Table 1 for a complete list of the HALLMARK_interferon alpha genes. 1 mM 5-AZA = 244.2 ng/mL.
Fig. 2
Fig. 2. Epigenetic reprogramming of HepG2-NTCP-C4 cells and evaluation of IFNα antiviral activity after HBV infection.
A Relative expression level of NTCP (SLC10A1 gene) in HepG2 and HepG2-NTCP-C4 cells. NTCP was analyzed in samples from HepG2-NTCP-C4 cell cultures at different time-point (n = 6). Parental HepG2 cells were used as controls (n = 4). The histograms show the means ± SD. *p < 0.05 (t test). B Evaluation of 5-AZA cytotoxic effect on HepG2-NTCP-C4 cells. Twenty-four hours after seeding, the cells were treated with 5-AZA at the indicated concentrations for 5 days. HepG2-NTCP-C4 cell viability was determined at the indicated times using an XTT assay. The 5-AZA IC50 was 4.33 µM after 5 days of treatment. The data represent the means ± standard deviation (SD). C Epigenetic reprogramming experimental design. Cells were first treated with 2 µM 5-AZA for 10 days (reprogramming procedure). Twenty-four hours after seeding in 96-well plates, the reprogrammed HepG2-NTCP-C4 (REP-HepG2-NTCP) cells were infected with HBV at an MOI of 100 for 24 h. Next, REP-HepG2-NTCP cells were treated with 1,000 and 10,000 IU/mL IFNα every 3 days. Total DNA was collected for analysis after 9 days of treatment. The 5-AZA-supplemented medium was replaced daily during reprogramming and every 3 days after HBV infection. The numbers in brackets indicate the time after infection. No cytotoxic effect of IFNα was observed in the cells after treatment (S. Figure 1). D Measurement of HBV DNA levels in the HBV-infected cells after IFNα treatment. HBV DNA copies in the REP-HepG2-NTCP cells were determined by real-time quantitative PCR from 50 ng of total DNA. Histograms represent the means ± SD. Statistically significant differences in the HBV DNA levels related to untreated cells were achieved at ***p < 0.001 (t test).
Fig. 3
Fig. 3. ISG expression analysis in IFNα-stimulated REP-HepG2-NTCP cells.
A Experimental design. After epigenetic reprogramming using 2 µM 5-AZA for 10 days, REP-HepG2-NTCP cells were treated with different concentrations of IFNα for 4, 8, and 16 h. B Relative expression levels of 2’-5’-oligoadenylate synthetase 1 (OAS1), interferon-stimulated exonuclease gene 20 (ISG20), apolipoprotein B mRNA-editing enzyme catalytic subunits 3 F and 3 G (APOBEC3F and APOBEC3G), and interferon regulatory factor 9 (IRF9). Total RNA was extracted at the indicated times, and the relative gene expression levels were determined by real-time quantitative PCR. The data obtained from REP-HepG2-NTCP cells and naive HepG2-NTCP-C4 cells are depicted in red and blue, respectively, and show the means ± SD.
Fig. 4
Fig. 4. Analysis of OAS1 and IRF9 methylation after epigenetic reprogramming.
A Relative expression levels of interferon-alpha and interferon-beta receptor subunit 1 and 2 (IFNAR1 and IFNAR2), Janus kinase 1 (JAK1), signal transducer and activator of transcription 1 and 2 (STAT1 and STAT2), ribonuclease L (RNASEL), ISG15 ubiquitin-like modifier (ISG15), ISG20, APOBEC3F, and APOBEC3G. The data show gene expression fold changes in the REP-HepG2-NTCP cells relative to non-reprogrammed control cells and z scores for each gene relative to all analyzed genes (N = 12). B Comparison of OAS1 and C IRF9 methylation profiles between REP-HepG2-NTCP cells and HepG2-NTCP-C4 cells. The COBRA data showed reprogramming DMRs (rDMRs) located from 549 to 940 bp and from 489 to 1179 bp upstream of the OAS1 and IRF9 TSSs, respectively. The black arrows indicate the OAS1 and IRF9 TSSs and the black circles represent the methylation percentage for each analyzed CpG site. The boxplots show the differential methylation levels of OAS1-rDMR and IRF9-rDMR in the REP-HepG2-NTCP cells (REP) compared with those of the control HepG2-NTCP-C4 cells (Ctrl). Significant differences in methylation levels were achieved at **p < 0.01 for OAS1-rDMR and *p < 0.05 for IRF9-rDMR (Mann–Whitney U test).
Fig. 5
Fig. 5. Expression and methylation levels of NTCP in REP-HepG2-NTCP cells.
A Relative expression level of NTCP (SLC10A1 gene) in REP-HepG2-NTCP cells. Non-reprogrammed HepG2-NTCP-C4 cells were used as controls. The histograms show the means ± SD. **p < 0.01 (t test). B Methylation status of the NTCP promoter region as determined by COBRA. Two CpG sites located 948 bp upstream and 172 bp downstream of the NTCP TSS were found to be differentially methylated between the REP-HepG2-NTCP cells and control HepG2-NTCP-C4 cells. A significant difference in CpG methylation levels was reached at p < 0.001 (CpG #01) and p < 0.01 (CpG #06) (t test).
Fig. 6
Fig. 6. Assessment of CDM-3008 activity in REP-HepG2-NTCP cells.
A Measurement of HBV DNA levels in HBV-infected cells after CDM-3008 treatment. Following epigenetic reprogramming (2 µM 5-AZA for 10 days) and HBV infection (MOI of 100 for 24 h), REP-HepG2-NTCP cells were treated with 1 and 10 µM CDM-3008 every 3 days. Total DNA was collected for analysis after 9 days of treatment. No cytotoxic effect was induced by the compound in cells after treatment (S. Figure 1). Statistically significant differences in HBV DNA levels relative to the level in the untreated cells were achieved at ***p < 0.001 and *p < 0.05 with 1 and 10 µM CDM-3008, respectively (t test). B Relative expression levels of OAS1, ISG20, APOBEC3F, APOBEC3G, and IRF9 after CDM-3008 treatment at the indicated times and concentrations. The data from the REP-HepG2-NTCP and naive HepG2-NTCP-C4 cells are depicted in red and blue, respectively. C Relative expression of OAS1, ISG20, APOBEC3G, and IRF9 after IFNAR2 knockdown. Forty-eight hours after transfection with control siRNAs (siCtrl) or IFNAR2 siRNAs (siIFNAR2_A and siIFNAR2_B), REP-HepG2-NTCP cells were treated with 1 µM CDM-3008 for 8 h. Significance related to siCtrl-transfected cells was evaluated by t test: *p < 0.05 and ***p < 0.001. All histograms depicted in the figure represent the means ± SD. D Proposed mechanism by which epigenetic reprogramming of HepG2-NTCP-C4 cells restores, in part, via OAS1 and IRF9 epigenetic unmasking, ISG induction and anti-HBV activity in response to CDM-3008 treatment.

Similar articles

Cited by

References

    1. Schweitzer A, Horn J, Mikolajczyk RT, Krause G, Ott JJ. Estimations of worldwide prevalence of chronic hepatitis B virus infection: a systematic review of data published between 1965 and 2013. Lancet. 2015;386:1546–1555. doi: 10.1016/S0140-6736(15)61412-X. - DOI - PubMed
    1. Forner A, Reig M, Bruix J. Hepatocellular carcinoma. Lancet. 2018;391:1301–1314. doi: 10.1016/S0140-6736(18)30010-2. - DOI - PubMed
    1. Bray F, et al. Global cancer statistics 2018: GLOBOCAN estimates of incidence and mortality worldwide for 36 cancers in 185 countries. CA Cancer J. Clin. 2018;68:394–424. doi: 10.3322/caac.21492. - DOI - PubMed
    1. Tang LSY, Covert E, Wilson E, Kottilil S. Chronic hepatitis B infection: a review. JAMA. 2018;319:1802–1813. doi: 10.1001/jama.2018.3795. - DOI - PubMed
    1. Bhattacharya D, Thio CL. Review of hepatitis B therapeutics. Clin. Infect. Dis. 2010;51:1201–1208. doi: 10.1086/656624. - DOI - PMC - PubMed