. 2021 Jun 2;12(1):3279.
doi: 10.1038/s41467-021-23478-1.

An antibody against L1 cell adhesion molecule inhibits cardiotoxicity by regulating persistent DNA damage

Affiliations

An antibody against L1 cell adhesion molecule inhibits cardiotoxicity by regulating persistent DNA damage

Jae-Kyung Nam et al. Nat Commun. .

Abstract

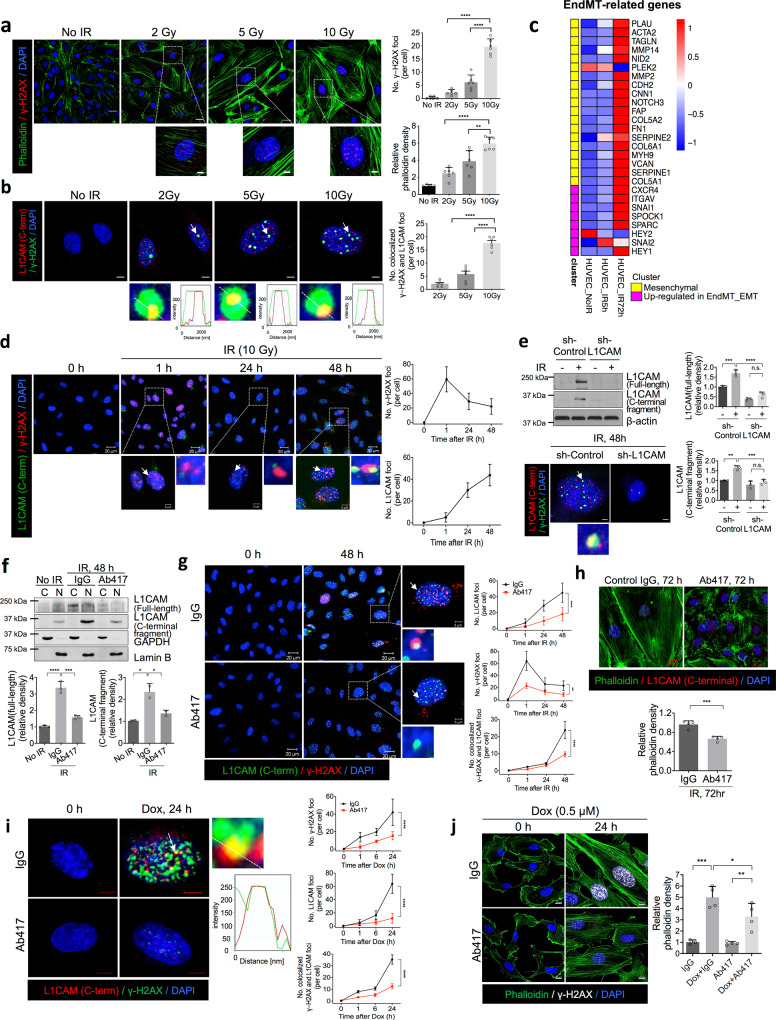
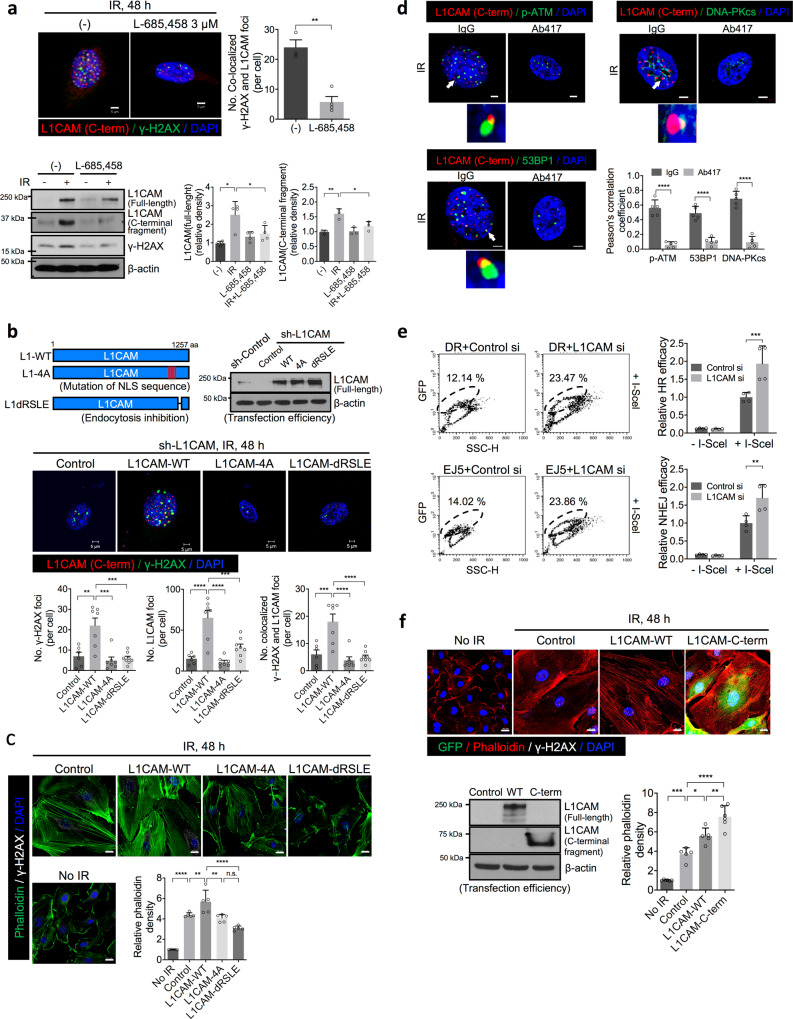
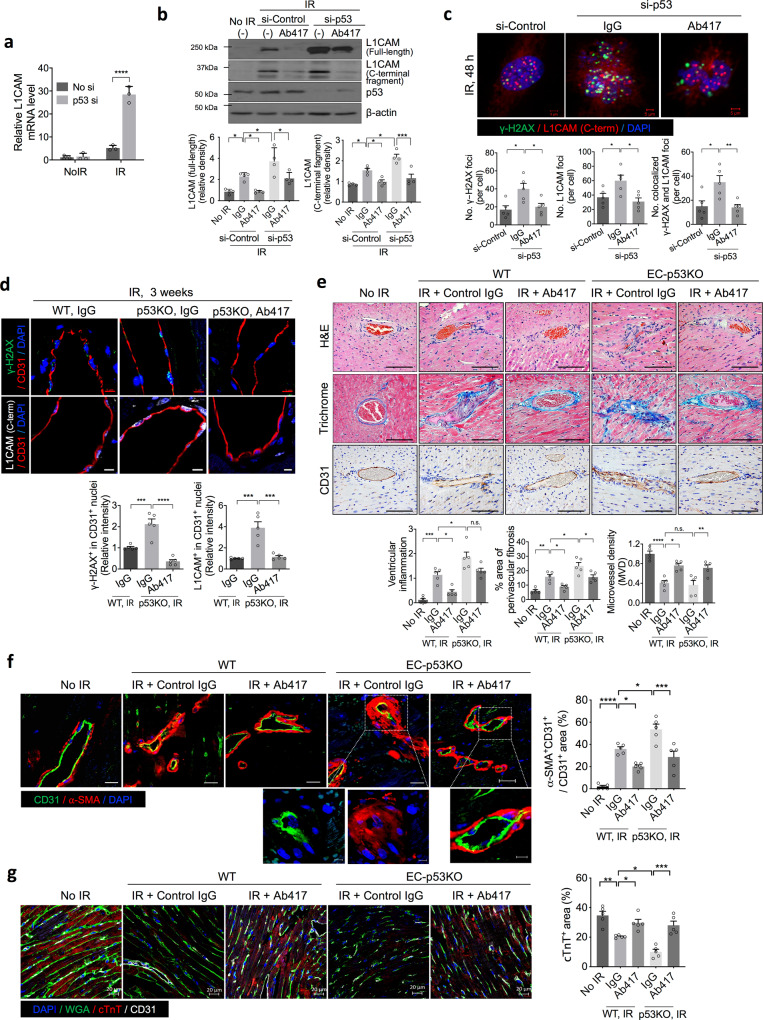
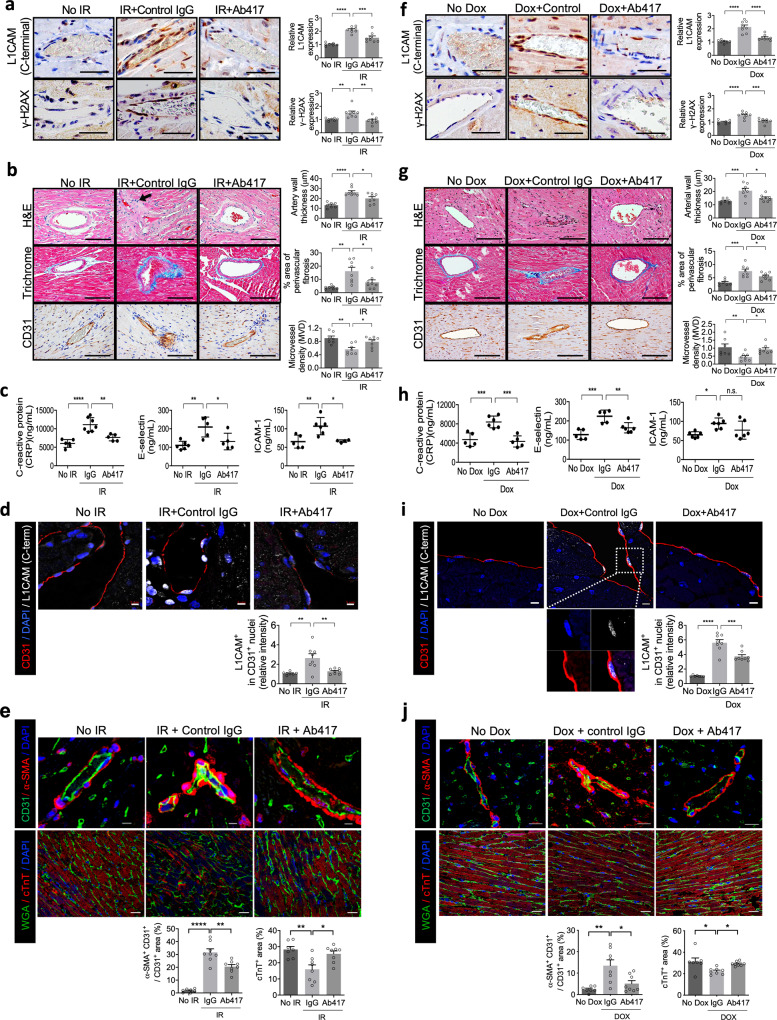
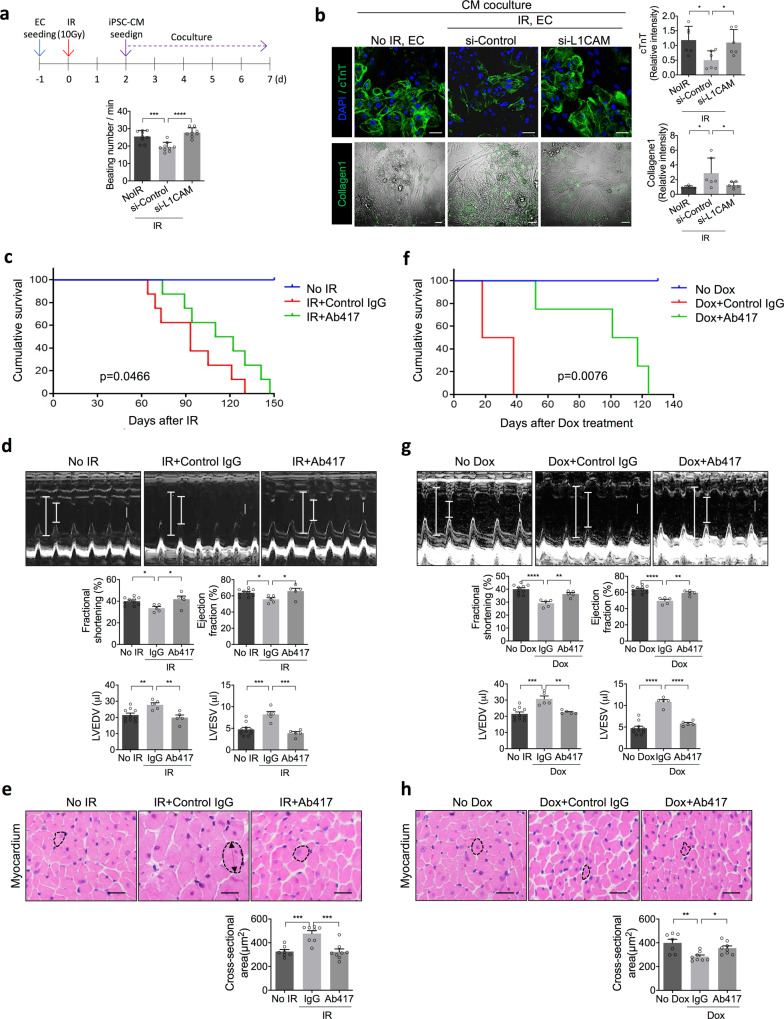
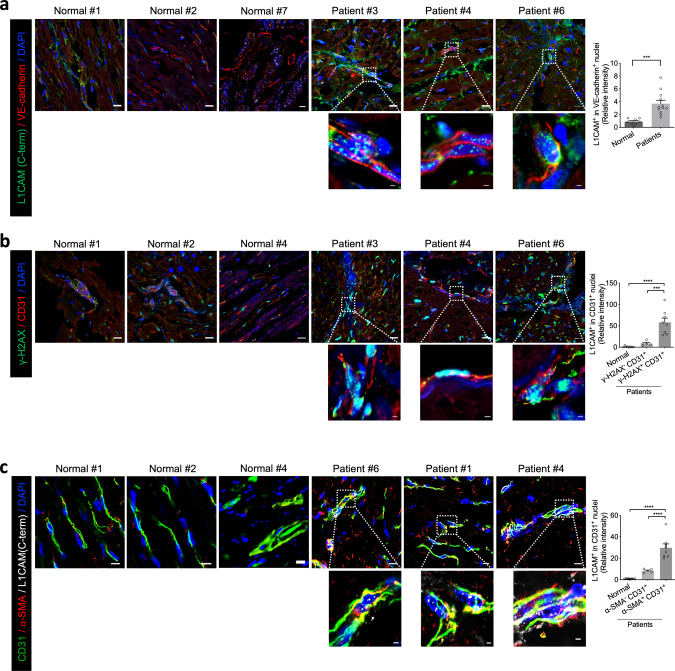
Targeting the molecular pathways underlying the cardiotoxicity associated with thoracic irradiation and doxorubicin (Dox) could reduce the morbidity and mortality associated with these anticancer treatments. Here, we find that vascular endothelial cells (ECs) with persistent DNA damage induced by irradiation and Dox treatment exhibit a fibrotic phenotype (endothelial-mesenchymal transition, EndMT) correlating with the colocalization of L1CAM and persistent DNA damage foci. We demonstrate that treatment with the anti-L1CAM antibody Ab417 decreases L1CAM overexpression and nuclear translocation and persistent DNA damage foci. We show that in whole-heart-irradiated mice, EC-specific p53 deletion increases vascular fibrosis and the colocalization of L1CAM and DNA damage foci, while Ab417 attenuates these effects. We also demonstrate that Ab417 prevents cardiac dysfunction-related decrease in fractional shortening and prolongs survival after whole-heart irradiation or Dox treatment. We show that cardiomyopathy patient-derived cardiovascular ECs with persistent DNA damage show upregulated L1CAM and EndMT, indicating clinical applicability of Ab417. We conclude that controlling vascular DNA damage by inhibiting nuclear L1CAM translocation might effectively prevent anticancer therapy-associated cardiotoxicity.


Conflict of interest statement

The authors declare no competing interests.

Figures

Fig. 1
Fig. 1. L1-CT fragments colocalize with persistent γ-H2AX foci after irradiation (IR) or Dox treatment in HUVECs.
a, b Immunofluorescence staining and quantification of phalloidin, γ-H2AX and L1-CT 48 h post IR (2 Gy, 5 Gy, or 10 Gy) in HUVECs (left panels, magnification, ×400). Scale bar = 20 µm (enlarged, 5 µm). Bar graphs quantifying the number of γ-H2AX foci, the phalloidin density, and the number of colocalized foci (right panels). For quantification of phalloidin density, error bars represent mean ± SEM (2 Gy vs. 10 Gy p < 0.0001; 5 Gy vs. 10 Gy p = 0.0015). For quantification of the number of γ-H2AX foci, error bars represent mean ± SD (****p < 0.0001). Colocalized foci (marked by white arrow) are amplified and graphs represent quantification of L1-CT and γ-H2AX signals in selected regions of dotted lines (bottom panels). Error bars represented mean ± SEM (****p < 0.0001). c Heat map of the RNA-seq analysis results showing radiation-induced EndMT and the mesenchymal phenotype. Total RNA was isolated from HUVECs before and after 10 Gy IR (5 h, 72 h). d Immunofluorescence staining of L1-CT and γ-H2AX in HUVECs at 0, 1, 24, and 48 h post IR (10 Gy; left panels). Quantification of γ-H2AX foci and nuclear L1CAM (magnification, ×400; right panels). The number of γ-H2AX foci with an intensity greater than 40 and a foci diameter of 0.1 μm was counted. Scale bar = 20 µm (enlarged, 5 µm). e Immunoblotting and quantification of full-length L1CAM and L1-CT fragments from HUVECs transfected with lentiviral shRNA targeting L1CAM 48 h after IR (10 Gy; upper panels). Error bars represent mean ± SD (full-length L1CAM: sh-Control IR – vs. + p = 0.0003; sh-Control IR + vs. sh-L1CAM IR +  p < 0.0001, L1-CT fragments: sh-Control IR – vs. + p = 0.0013; sh-Control IR + vs. sh-L1CAM IR + p = 0.0006). Immunofluorescence staining of γ-H2AX and L1-CT 48 h post IR (10 Gy) in HUVECs (magnification, ×400). Scale bar = 5 µm. f Immunoblotting (upper panel) of full-length L1CAM and L1-CT fragments in the cytoplasmic (C) and nuclear (N) fractions of HUVECs 48 h post IR (10 Gy). Quantification of full-length L1CAM in the cytoplasmic fractions and L1-CT fragments in the nuclear fractions. HUVECs were treated with control IgG or Ab417 (20 µg/mL) before IR. GAPDH and lamin B were used as cytoplasmic and nuclear markers, respectively. Error bars represent mean ± SD from independent experiments (full-length L1CAM: No IR vs. IR + IgG p < 0.0001; IR + IgG vs. IR + Ab417 p = 0.0001, L1-CT fragments: No IR vs. IR + IgG p = 0.0228; IR +  IgG vs. IR + Ab417 p = 0.0448). g Immunofluorescence staining for L1-CT and γ-H2AX 0 and 48 h post IR (10 Gy) in HUVECs pre-treated with control IgG or Ab417 (20 µg/mL) (upper panel). Quantification of colocalization of γ-H2AX foci with L1CAM (magnification, ×400) (lower panel). Scale bar = 20 µm (enlarged, 5 µm). h Immunofluorescence staining (upper panel) and quantification (lower panel) of phalloidin and L1-CT 72 h post IR (10 Gy) in HUVECs pre-treated with control IgG or Ab417 (20 µg/mL; magnification, ×400). Scale bar = 20 µm. Error bars represent mean ± SD (p = 0.0007). i Immunofluorescence staining for L1-CT and γ-H2AX at 0 and 24 h after Dox treatment in HUVECs pre-treated with control IgG or Ab417 (20 µg/mL; left panel). Colocalized foci (marked by white arrow) are amplified and graphs represent quantification of L1-CT and γ-H2AX signals in selected regions of dotted lines (middle panels). Quantification of colocalization of γ-H2AX foci with L1CAM (magnification, ×400; right panel). Scale bar = 5 µm. j Immunofluorescence staining and quantification of phalloidin and γ-H2AX 0 and 24 h after Dox treatment in HUVECs pre-treated with control IgG or Ab417 (magnification, ×400). Scale bar = 10 μm. Error bars represent mean ± SD (IgG vs. Dox + IgG p = 0.0002; Dox + IgG vs. Dox + Ab417 p = 0.0482; Ab417 vs. Dox + Ab417 p = 0.0065). For quantification of γ-H2AX foci and γ-H2AX foci colocalized with L1CAM, the foci in each sample were counted at least 70 cells per field (magnification, ×100). The average number of foci/cell was determined from >6 fields (magnification, ×100). Data are representative of three independent experiments. (h: two-talied Student’s t-test, all other panels: one-way ANOVA for multiple comparisons).
Fig. 2
Fig. 2. Nuclear localisation of L1CAM inhibits γ-H2AX foci resolution and DNA repair in HUVECs.
a Immunofluorescence staining and quantification of γ-H2AX foci colocalized with L1-CT (upper left panel; magnification, ×400) and immunoblotting (lower left panel) and quantification (right panels) of full-length L1CAM, L1-CT fragments, and γ-H2AX at 48 h post-irradiation (10 Gy) in HUVECs with or without γ-secretase inhibitor L-685,458 (3 µM) treatment. For quantification of γ-H2AX foci colocalized with L1-CT, error bars represent mean ± SEM (p = 0.0017). For quantification of full-length L1CAM and L1-CT fragments, error bars represent mean ± SD (full-length L1CAM: (-) vs. IR p = 0.0011; IR vs. IR + L-685,458 p = 0.0233, L1-CT fragments: (-) vs. IR p = 0.0017; IR vs. IR + L-685,458 p = 0.0177). b, c HUVECs were transfected with human full-length (L1-WT), NLS-mutated (L1-4A), and endocytosis-deficient (L1-dRSLE) L1CAM vectors after knockdown of endogenous L1CAM. b Scheme of L1-WT, L1-4A and L1-dRSLE constructs (top left panel). Immunoblotting of full-length L1CAM in HUVECs (top right panel) and immunofluorescence staining (middle panels) and quantification (bottom panels) of L1-CT and γ-H2AX in HUVECs 48 h post-irradiation (10 Gy; magnification, ×400). Scale bar = 5 µm. Error bars represent mean ± SEM (No. γ-H2AX foci: Control vs. L1CAM-WT p = 0.001; L1CAM-WT vs. L1CAM-4A p = 0.0001; L1CAM-WT vs. L1CAM-dRSLE p = 0.0002, No. L1-CT foci: ****p < 0.0001; L1CAM-WT vs. L1CAM-dRSLE p = 0.0004, No. colocalized foci: Control vs. L1CAM-WT p = 0.006; ****p < 0.0001). c Immunofluorescence staining and quantification of phalloidin and γ-H2AX in HUVECs 48 h post-irradiation (10 Gy; magnification, ×400). Scale bar = 20 µm. Error bars represent mean ± SD (Control vs. L1CAM-WT p = 0.0096; L1CAM-WT vs. L1CAM-4A p = 0.0014; ****p < 0.0001). d Immunofluorescence staining and pearson’s correlation coefficient of L1-CT colocalized with p-ATM, 53BP1, and DNA-PKcs in the nuclei of Ab417-pre-treated HUVECs 48 h post-irradiation (10 Gy magnification, ×400). Scale bar = 5 µm. Error bars represent mean ± SD (****p < 0.0001). e Flow cytometry analysis of cells with GFP positivity resulting from DNA repair and quantification of HR (upper panel) and NHEJ (lower panel) efficiency in L1CAM-knockdown HUVECs. The HUVECs were transiently transfected with the DR-GFP or EJ5-GFP construct along with control or L1CAM siRNA and were then transfected with a SceI plasmid to induce DNA damage. Error bars represent mean ± SD (HR efficacy p = 0.0005, NHEJ efficacy p = 0.0011). f Immunofluorescence staining (upper panel) for GFP, phalloidin, γ-H2AX in HUVECs 48 h post-irradiation (10 Gy). Quantification of phalloidin is shown (magnification, ×400; right panel). Scale bar = 20 µm. Error bars represent mean ± SD (No IR vs. IR + Control p = 0.0001; IR + Control vs. IR + L1CAM-WT p = 0.0063; IR + L1CAM-WT vs. IR + L1CAM-C-term p = 0.0027, IR + Control vs. IR + L1CAM-C-term p < 0.0001). HUVECs were transfected with L1-WT or L1-CT lentiviral vectors tagged with N-terminal GFP and C-terminal His. Transfection efficiency (left panel) was tested by immunoblotting for L1-WT and L1-CT. For quantification of foci colocalized with L1CAM, the colocalized foci in each sample were counted in a minimum of 70 cells per field (magnification, ×100). The average number of colocalized foci/cell was determined from five fields (magnification, ×100). The data are presented the means ± SDs and ±SEMs from three independent experiments. (a upper left panel: two-talied Student’s t-test; a all other panels and b, c, f: one-way ANOVA for multiple comparisons; d, e two-way ANOVA for multiple comparisons).
Fig. 3
Fig. 3. An anti-L1CAM antibody prevents p53 knockout- and radiation-induced DNA damage in heart ECs.
a RT-qPCR analysis of L1CAM in p53-knockdown HUVECs 48 h post-irradiation (10 Gy). Error bars represent mean ± SD from three independent experiments (p < 0.0001). b Immunoblotting (upper panel) and quantification (lower panel) of full-length L1CAM and L1-CT 48 h post-irradiation (10 Gy) in p53-knockdown HUVECs pre-treated with control IgG or Ab417 (20 µg/mL). Error bars represent mean ± SD from four independent experiments (full-length L1CAM: No IR vs. si-Control IR + IgG p = 0.0468; si-Control IR + IgG vs. si-Control IR + Ab417 p = 0.0468; si-Control IR + IgG vs. si-p53 IR + IgG p = 0.0462; si-p53 IR + IgG vs. si-p53 IR + Ab417 p = 0.0218, L1-CT: No IR vs. si-Control IR + IgG p = 0.0124; si-Control IR + IgG vs. si-Control IR + Ab417 p = 0.0484; si-Control IR + IgG vs. si-p53 IR + IgG p = 0.0206; si-p53 IR + IgG vs. si-p53 IR + Ab417 p = 0.0004). c Immunofluorescence staining (upper panel) and quantification (lower panel) for γ-H2AX and L1-CT. The results of quantification of γ-H2AX foci, nuclear L1CAM, and colocalization of γ-H2AX foci with L1CAM are shown (magnification, ×400). Scale bar = 5 μm. Error bars represent mean ± SEM (No. γ-H2AX foci: si-Control vs. si-p53+IgG p = 0.0107; si-p53+IgG vs. si-p53 + Ab417 p = 0.0242, No. L1-CT foci: si-Control vs. si-p53+IgG p = 0.0425; si-p53+IgG vs. si-p53 + Ab417 p = 0.0119, No. colocalized foci: si-Control vs. si-p53 + IgG p = 0.0131; si-p53 + IgG vs. si-p53 + Ab417 p = 0.0097). For quantification of foci colocalized with L1CAM, the colocalized foci in each sample were counted in at least 70 cells per field (magnification, ×100, n = 5). d, e Wild-type or EC-p53KO mice were injected intravenously with control IgG or Ab417 (10 mg/kg) and subjected to 17.5 Gy thoracic irradiation (n = 5 animals per group). d Immunofluorescence staining (upper panels) for γ-H2AX, L1CAM, and CD31 in heart tissues 3 weeks post-irradiation and quantification (lower panels) of γ-H2AX+ cells and nuclear L1CAM+ cells among CD31+ cells (magnification, ×400). Scale bar = 5 μm. Error bars represent mean ± SEM (γ-H2AX+ in CD31+ nuclei: WT+IR vs. p53KO+IR p = 0.0005; p53KO + IgG vs. p53KO + Ab417 p < 0.0001, L1CAM+ in CD31+ nuclei: WT+IR vs. p53KO+IR p = 0.0001; p53KO+IgG vs. p53KO + Ab417 p = 0.0002). e Haematoxylin and eosin staining, Masson’s trichrome staining, and immunohistochemical detection of CD31 in heart tissues 3 weeks post-irradiation (upper panels) and quantification of ventricular inflammation, perivascular fibrosis area, and microvessel density per field (magnification, ×200; lower panels). Scale bar = 100 μm. Error bars represent mean ± SEM (ventricular inflammation: No IR vs. WT IR + IgG p = 0.0003; WT IR + IgG vs. WT IR + Ab417 p = 0.0125; WT IR + IgG vs. p53KO IR + IgG p = 0.0104, perivascular fibrosis area: No IR vs. WT IR + IgG p = 0.0021; WT IR + IgG vs. WT IR + Ab417 p = 0.0328; WT IR + IgG vs. p53KO IR + IgG p = 0.0203; WT IR + IgG vs. WT IR + Ab417 p = 0.0165, MVD: No IR vs. WT IR + IgG p < 0.0001; WT IR + IgG vs. WT IR + Ab417 p = 0.0055; WT IR + IgG vs. WT IR + Ab417 p = 0.0068). f Immunofluorescence staining (left panels) of α-SMA and CD31 in heart tissues 3 weeks post-irradiation (n = 5 animals per group) and quantification (right panels) of the α-SMA+CD31+ area in the CD31+ area (magnification, ×400). Scale bar = 20 μm. Error bars represent mean ± SEM (No IR vs. WT IR + IgG p < 0.0001; WT IR + IgG vs. WT IR + Ab417 p = 0.0251; WT IR + IgG vs. p53KO IR + IgG p = 0.011; p53KO IR + IgG vs. p53KO IR + Ab417 p = 0.0004). g Immunofluorescence staining (left panel) of WGA, cTnT, and CD31 (n = 5 animals per group) and quantification (right panel) of the cTnT area per field (magnification, ×400). Scale bar = 20 μm. Error bars represent mean ± SEM (No IR vs. WT IR + IgG p = 0.0014; WT IR + IgG vs. WT IR + Ab417 p = 0.0489; WT IR + IgG vs. p53KO IR + IgG p = 0.0253; p53KO IR + IgG vs. p53KO IR + Ab417 p = 0.001). *p < 0.05, **p < 0.01, ***p < 0.001, ****p < 0.0001, ns: not significant (a Two-way ANOVA for multiple comparisons; all other panels: one-way ANOVA for multiple comparisons).
Fig. 4
Fig. 4. An anti-L1CAM antibody (Ab417) inhibits irradiation (IR)- and Dox-induced vascular DNA damage and perivascular fibrosis with L1CAM nuclear localisation, EndMT and cardiac TnT loss.
ae Mice were injected intravenously with control IgG or Ab417 (10 mg/kg) three times a week for 2 weeks and received 16 Gy thoracic IR (No IR n = 7; IR + IgG n = 8; IR + Ab417 n = 8). fj Mice were injected intravenously with control IgG or Ab417 (10 mg/kg) with or without intraperitoneal Dox injection (4 mg/kg) three times a week for 2 weeks (No Dox n = 7; Dox+IgG n = 8; Dox+Ab417 n = 8). a, f Immunohistochemical detection (left panels) of L1-CT and γ-H2AX in heart tissues 1 week post IR (a) and 2 weeks after Dox treatment (f). The quantified L1-CT+ cells and γ-H2AX+ cells among ECs are shown (magnification, ×200; right panels). Scale bar = 50 μm. Error bars represent mean ± SEM (L1-CT: IR + IgG vs. IR + Ab417 p = 0.0004, γ-H2AX: No IR vs. IR + IgG p = 0.0076; IR + IgG vs. IR + Ab417 p = 0.0017; Dox + IgG vs. Dox+Ab417 p = 0.0003, **** p < 0.0001). b, g Haematoxylin and eosin staining, Masson’s trichrome staining, and immunohistochemical detection of CD31 in heart tissues (left panels); and quantification of arterial wall thickness, perivascular fibrosis area, and microvessel density per field in heart tissues (magnification, ×200; right panels). Scale bar = 100 μm. The arrow in b indicates inflammatory cell infiltration. Error bars represent mean ± SEM (Arterial wall thickness: No IR vs. IR + IgG p < 0.0001; IR + IgG vs. IR + Ab417 p = 0.0159; No Dox vs. Dox p = 0.0009; Dox + IgG vs. Dox + Ab417 p = 0.0117, perivascular fibrosis area: No IR vs. IR + IgG p = 0.0011; IR + IgG vs. IR + Ab417 p = 0.0168; No Dox vs. Dox p = 0.0001; Dox + IgG vs. Dox + Ab417 p = 0.0492, MVD: No IR vs. IR + IgG p = 0.0012; IR + IgG vs. IR + Ab417 p = 0.0184; No Dox vs. Dox p = 0.0093; Dox + IgG vs. Dox + Ab417 p = 0.0378). c, h Serum CRP, E-selectin, and ICAM-1 levels 1 week post IR (c) and 1 week after Dox treatment (h). Error bars represent mean ± SD (CRP: No IR vs. IR + IgG p < 0.0001; IR + IgG vs. IR + Ab417 p = 0.0015; No Dox vs. Dox p = 0.0007; Dox+IgG vs. Dox+Ab417 p = 0.0003, E-selectin: No IR vs. IR + IgG p = 0.0031; IR + IgG vs. IR + Ab417 p = 0.02; No Dox vs. Dox p = 0.0003; Dox+IgG vs. Dox+Ab417 p = 0.0082, ICAM-1: No IR vs. IR + IgG p = 0.0053; IR + IgG vs. IR + Ab417 p = 0.01; No Dox vs. Dox p = 0.0154). d, i Immunofluorescence detection (upper panel) of L1-CT and CD31 in mouse heart tissues 1 week post IR (d) and 2 weeks after Dox treatment (i) (magnification, ×400). Scale bar = 5 μm. Quantification of L1CAM in CD31 nuclei (lower panel). Error bars represent mean ± SEM (No IR vs. IR + IgG p = 0.0012; IR + IgG vs. IR + Ab417 p = 0.0033; No Dox vs. Dox p < 0.0001; Dox IgG vs. Dox+Ab417 p = 0.0004). e, j Immunofluorescence staining of α-SMA and CD31 (scale bar = 10 μm) and of WGA and cTnT (scale bar = 20 μm) in heart tissues 1 week post IR (e) and 2 weeks post Dox treatment (j) (magnification, ×400; upper panels). Quantification of the α-SMA+CD31+ area in the CD31+ area and quantification of the cTnT area per field (lower panels). Error bars represent mean ± SEM (SMA+CD31+ area in the CD31+ area: No IR vs. IR + IgG p < 0.0001; IR + IgG vs. IR + Ab417 p = 0.0011; No Dox vs. Dox p = 0.0013; Dox + IgG vs. Dox + Ab417 p = 0.0103, cTnT area: No IR vs. IR + IgG p = 0.0019; IR + IgG vs. IR + Ab417 p = 0.0107; No Dox vs. Dox p = 0.0126; Dox + IgG vs. Dox + Ab417 p = 0.0494, one-way ANOVA for multiple comparisons). Data are representative of three independent experiments.
Fig. 5
Fig. 5. An anti-L1CAM antibody (Ab417) mitigates irradiation (IR)- and Dox-induced cardiotoxicity and increases survival.
a, b Co-culture of iPSC-CMs and irradiated ECs transfected with control or L1CAM siRNA. a Schematic of the procedure for co-culture of iPSC-CMs and irradiated ECs. ECs were transfected with control or L1CAM-specific siRNA and irradiated with 10 Gy. Forty-eight hours after IR, the ECs were co-cultured with iPSC-CMs (top). The beating rates of the iPSC-CMs were examined after 5 days of co-culture with irradiated ECs (bottom). Error bars represent mean ± SD (No IR vs. si-Control+IR p = 0.0005; si-Control+IR vs. si-L1CAM + IR p > 0.0001). b Immunofluorescence staining (left panel) and quantification (right panel) of cTnT expression in cardiomyocytes and the collagen I deposition area in co-cultured cells (magnification, ×200). Scale bar = 50 μm. Error bars represent mean ± SD (cTnT expression: No IR vs. si-Control+IR p = 0.0239; si-Control+IR vs. si-L1CAM + IR p = 0.0475, collagen I deposition: No IR vs. si-Control + IR p = 0.027; si-Control + IR vs. si-L1CAM + IR p = 0492). ce Mice were injected intravenously with control IgG or Ab417 (10 mg/kg) three times a week for 2 weeks and received 16 Gy thoracic IR. fh Mice were injected intravenously with control IgG or Ab417 (10 mg/kg) with or without intraperitoneal Dox injection (4 mg/kg) three times a week for 2 weeks. c, f Cumulative survival analysis measured in days after treatment (n = 8 animals per group). d, g Echocardiography results (upper panels) and quantification (lower panels) of FS (%), LVEF (%), LVESV (μL), and LVEDV (μL) (No IR n = 10; IR + IgG n = 5, IR + Ab417 n = 5; No Dox n = 10; Dox+IgG n = 5, Dox + Ab417 n = 5). Scale bar = 1 mm. Error bars represent mean ± SD (FS: No IR vs. IR + IgG p = 0.0331; IR + IgG vs. IR + Ab417 p = 0.0172; Dox+IgG vs. Dox + Ab417 p = 0.0046, LVEF: No IR vs. IR + IgG p = 0.0284; IR + IgG vs. IR + Ab417 p = 0.0182; Dox + IgG vs. Dox + Ab417 p = 0.0027, LVEDV: No IR vs. IR + IgG p = 0.0099; IR + IgG vs. IR + Ab417 p = 0.0054; No Dox vs. Dox p = 0.0003; Dox + IgG vs. Dox + Ab417 p = 0.003, LVESV: No IR vs. IR + IgG p = 0.0005; IR + IgG vs. IR + Ab417 p = 0.0002, ****p < 0.0001). e, h Haematoxylin and eosin–stained ventricular myocardium (upper panels) and quantification (lower panels) of cardiomyocyte cross-sectional area (No IR n = 7; IR + IgG n = 8; IR + Ab417 n = 8; No Dox n = 7; Dox + IgG n = 8; Dox+Ab417 n = 8) (magnification, ×400). Scale bar = 20 μm. Error bars represent mean ± SEM (No IR vs. IR + IgG p = 0.0003; IR + IgG vs. IR + Ab417 p = 0.0002; No Dox vs. Dos+IgG p = 0.024; Dox + IgG vs. Dox + Ab417 p = 0.0493). (a, d: log-rank Mantel-Cox test; all other panels: one-way ANOVA for multiple comparisons).
Fig. 6
Fig. 6. Nuclear L1CAM localisation with vascular EndMT and γ-H2AX L1CAM colocalization in heart tissues from patients with cardiomyopathy.
a Immunofluorescence staining of L1CAM and VE-cadherin in heart tissues from patients with cardiomyopathy (n = 12) and patients without cardiomyopathy (n = 8) (magnification, ×400). Scale bar = 10 μm (enlarged, 2 μm). Error bars represent mean ± SEM (p = 0.0004). b Immunofluorescence staining of γ-H2AX and CD31 in heart tissues from patients with cardiomyopathy and patients without cardiomyopathy (upper panels) and quantification (lower panel) of nuclear L1CAM+ cells among CD31+ cells (magnification, ×400). Scale bar = 10 μm (enlarged, 2 μm). Error bars represent mean ± SEM (Normal vs. γ-H2AX+ CD31+ p > 0.0001; γ-H2AX CD31+ vs. γ-H2AX+ CD31+ p = 0.0003) c Immunofluorescence staining of L1CAM, α-SMA, and CD31 in heart tissues from patients with cardiomyopathy and from patients without cardiomyopathy (upper panels) and quantification (lower panel) of nuclear L1CAM+ cells among α-SMA-CD31+ and α-SMA+CD31+ cells (magnification, ×400). Scale bar = 10 μm (enlarged, 2 μm). Error bars represent mean ± SEM (p > 0.0001). (a two-tailed student’s t-test; b, c one-way ANOVA for multiple comparisons).

Similar articles

Cited by

References

    1. Moslehi JJ. Cardiovascular toxic effects of targeted cancer therapies. N. Engl. J. Med. 2016;375:1457–1467. doi: 10.1056/NEJMra1100265. - DOI - PubMed
    1. Darby SC, et al. Risk of ischemic heart disease in women after radiotherapy for breast cancer. N. Engl. J. Med. 2013;368:987–998. doi: 10.1056/NEJMoa1209825. - DOI - PubMed
    1. Giordano SH, et al. Risk of cardiac death after adjuvant radiotherapy for breast cancer. J. Natl Cancer Inst. 2005;97:419–424. doi: 10.1093/jnci/dji067. - DOI - PMC - PubMed
    1. Burridge PW, et al. Human induced pluripotent stem cell-derived cardiomyocytes recapitulate the predilection of breast cancer patients to doxorubicin-induced cardiotoxicity. Nat. Med. 2016;22:547–556. doi: 10.1038/nm.4087. - DOI - PMC - PubMed
    1. Lefrak EA, Pitha J, Rosenheim S, Gottlieb JA. A clinicopathologic analysis of adriamycin cardiotoxicity. Cancer. 1973;32:302–314. doi: 10.1002/1097-0142(197308)32:2<302::AID-CNCR2820320205>3.0.CO;2-2. - DOI - PubMed

Publication types

MeSH terms

Substances