. 2021 Jun 2;12(1):3297.
doi: 10.1038/s41467-021-23143-7.

Discovery of widespread transcription initiation at microsatellites predictable by sequence-based deep neural network

Collaborators, Affiliations

Discovery of widespread transcription initiation at microsatellites predictable by sequence-based deep neural network

Mathys Grapotte et al. Nat Commun. .

Erratum in

Abstract

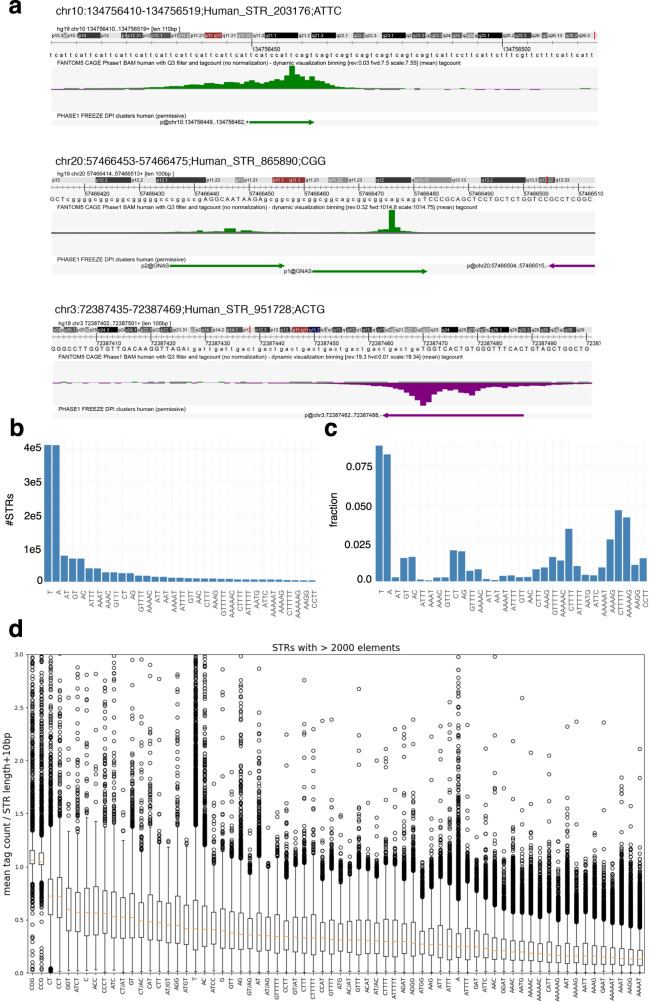
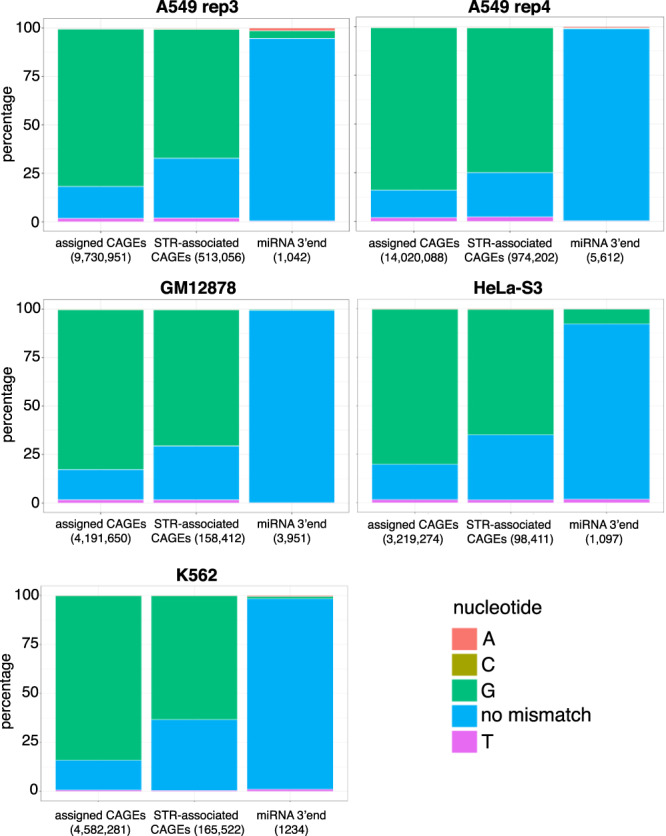
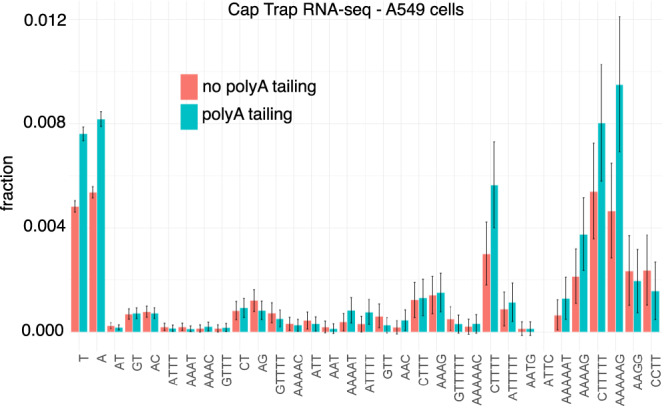
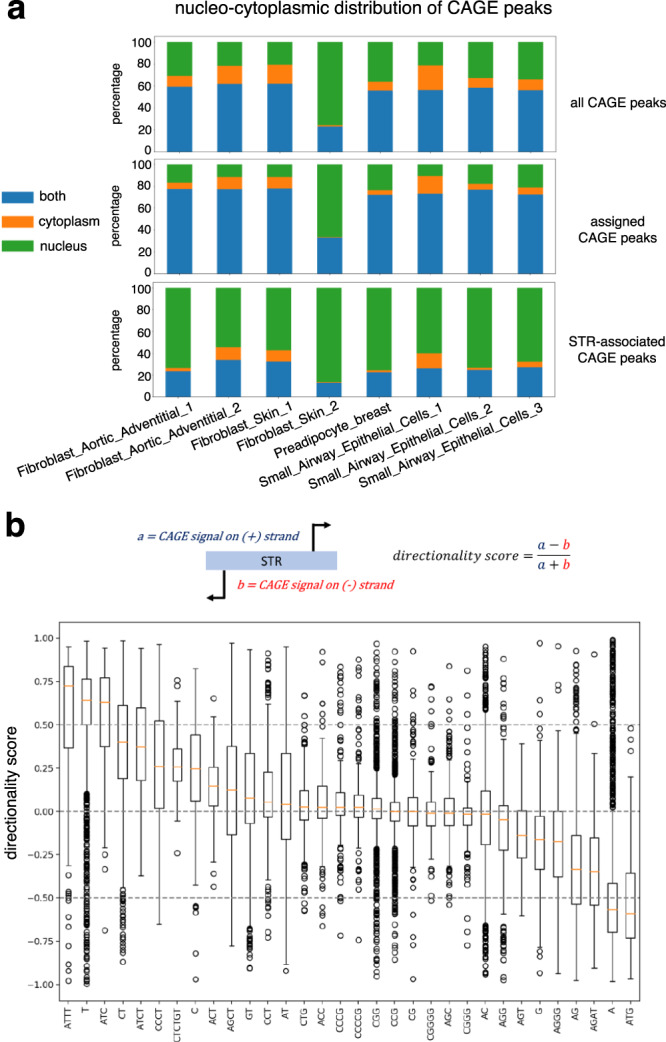
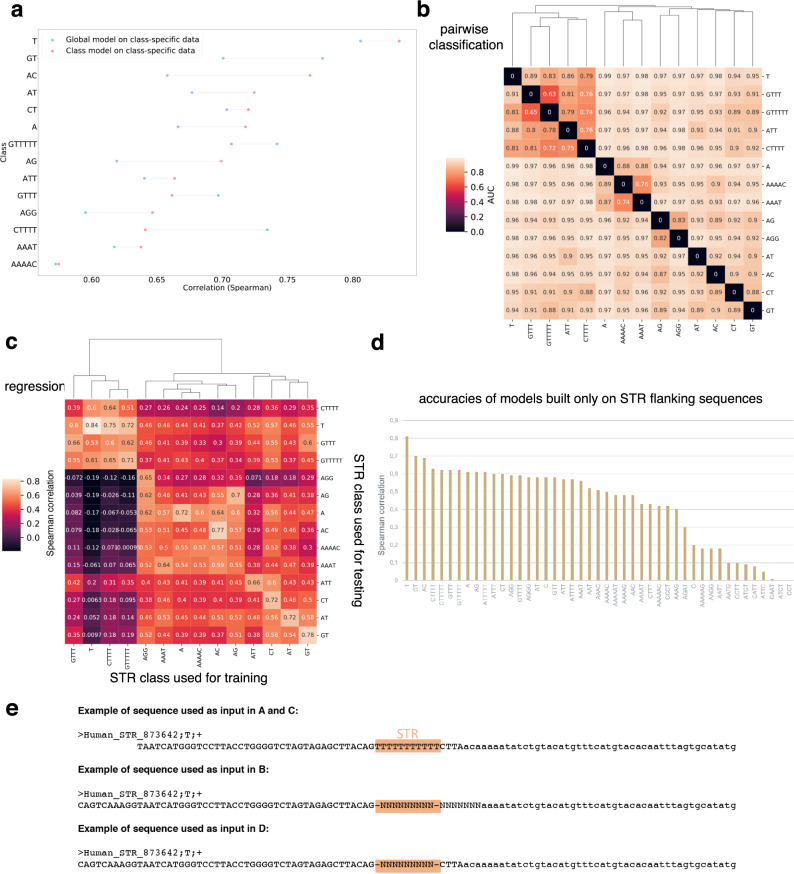
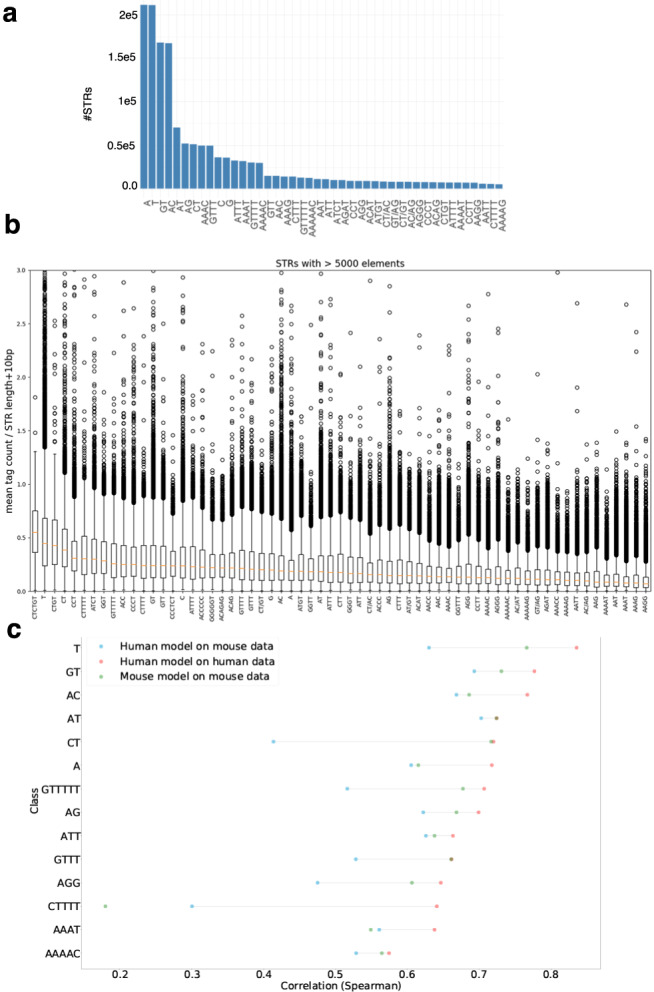
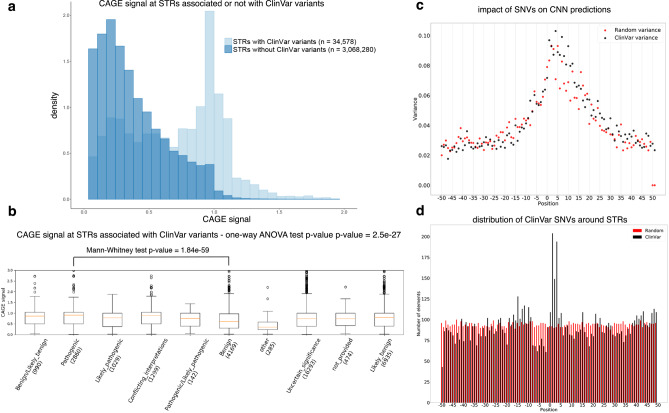
Using the Cap Analysis of Gene Expression (CAGE) technology, the FANTOM5 consortium provided one of the most comprehensive maps of transcription start sites (TSSs) in several species. Strikingly, ~72% of them could not be assigned to a specific gene and initiate at unconventional regions, outside promoters or enhancers. Here, we probe these unassigned TSSs and show that, in all species studied, a significant fraction of CAGE peaks initiate at microsatellites, also called short tandem repeats (STRs). To confirm this transcription, we develop Cap Trap RNA-seq, a technology which combines cap trapping and long read MinION sequencing. We train sequence-based deep learning models able to predict CAGE signal at STRs with high accuracy. These models unveil the importance of STR surrounding sequences not only to distinguish STR classes, but also to predict the level of transcription initiation. Importantly, genetic variants linked to human diseases are preferentially found at STRs with high transcription initiation level, supporting the biological and clinical relevance of transcription initiation at STRs. Together, our results extend the repertoire of non-coding transcription associated with DNA tandem repeats and complexify STR polymorphism.


Conflict of interest statement

The authors declare no competing interests.

Figures

Fig. 1
Fig. 1. CAGE peaks are detected at STRs.
a Three examples of STRs associated with a CAGE peak. The Zenbu browser was used. top track, hg19 genome sequence; middle track, CAGE tag count as mean across 988 libraries (BAM files with Q3 filter were used); bottom track, CAGE peaks as called in ref. . b Number of STRs per STR class. For sake of clarity, only STR classes with >2000 loci are shown. c Fraction of STRs associated with a CAGE peak in all STR classes considered in b. d CAGE signal at STR classes with >2000 loci. CAGE signal was computed as the mean raw tag count of each STR (tag count in STR ± 5 bp) across all 988 FANTOM5 libraries. This tag count was further normalized by the length of the window used to compute the signal (i.e., STR length + 10 bp). The orange bar corresponds to the median value. The lower and upper hinges correspond to the first and third quartiles (the 25th and 75th percentiles). The upper whisker extends from the hinge to the largest value no further than 1.5 × IQR from the hinge (where IQR is the interquartile range or distance between the first and third quartiles). The lower whisker extends from the hinge to the smallest value at most 1.5 × IQR of the hinge. Data beyond the end of the whiskers are plotted individually.
Fig. 2
Fig. 2. CAGE tags initiating at STRs are truly 5’-capped.
G bias in ENCODE CAGE tags (bam files from nuclear fraction, polyA+) was assessed at FANTOM5 CAGE peaks assigned to genes (positive control) and CAGE peaks initiating at STRs. G bias at pre-microRNA 3' ends was also assessed as a negative control. Five libraries were analyzed corresponding to A549 (replicates 3 and 4), GM12878, HeLa-S3, and K562 cells. The number of intersecting tags in each case is indicated in the bracket.
Fig. 3
Fig. 3. CTR-seq confirms the existence of transcription initiation at STRs.
The fractions of STRs associated with at least one CTR-seq long-read start site were computed for all STR classes considered in Fig. 1b. RNAs were collected in A549 cells. Reverse transcription was preceded (blue) or not (red) by polyA tailing. Binomial proportion 95% confidence intervals are indicated and centered on the fraction value (y axis).
Fig. 4
Fig. 4. CAGE peaks at STRs exhibit specific features.
a STR-associated CAGE tags are preferentially detected in the nuclear compartment. For each indicated library (x axis) and each CAGE peak, CAGE expression (TPM) was measured in nuclear and cytoplasmic fractions. Each CAGE peak was then assigned to the nucleus (if only detected in the nucleus), cytoplasm (if only detected in the cytoplasm), or both compartments (if detected in both compartments). The number of CAGE peaks in each class is shown for each sample as a fraction of all detected CAGE peaks. The sample Fibroblast_Skin_2 likely represents a technical artifact. Analyses were conducted considering 201,802 FANTOM5 CAGE peaks (top), 54,001 CAGE peaks assigned to genes (middle), and 14,509 CAGE peaks associated with STRs (bottom). b Boxplots of directionality scores for each STR class with >100 elements. A score of 0 means that the transcription is bidirectional and occurs on both strands. A score of 1 indicates that transcription occurs on the (+) strand, while −1 indicates transcription exclusively on the (−) strand (STRs being defined on the (+) strand in HipSTR catalog). Boxplots are defined as in Fig. 1d.
Fig. 5
Fig. 5. Probing STR sequences with CNN models.
a Comparison of the accuracies of global vs. class-specific models to predict transcription initiation levels at STRs. A model was learned on all STR sequences, irrespective of their class, and tested on each indicated STR class (accuracies obtained in each case, as Spearman ρ, is shown as blue points). Distinct models were also learned for each indicated class, without considering others (accuracies are shown in red). In total, 14 STR classes are shown as representative examples. Example sequence used as input is shown in E. b CNN-based pairwise classification of STRs using only STR flanking sequences (see “Methods” section). The pairs are defined by the line and the column of the matrix (e.g., the bottom left tile represents a classification task between T flanking sequences and GT flanking sequences). The values displayed on the tiles correspond to AUCs measured on the test set with the model trained specifically for the task. Clustering was performed to group pairs of STRs according to AUCs. c CNN performances to predict transcription initiation levels at heterologous STRs evaluated as the Spearman correlation between predicted and observed CAGE signal. The heatmap represents the performance of one model learned on one STR class (rows) and tested either on the same or another class (columns). Clustering is also used to show which models are similar (high correlation) and which ones differ (low correlation). d CNN models were learned on flanking sequences. The models use as an input only the 50-bp-long sequences flanking the STR, with the DNA repeated motif being masked by 9Ns (vectors of zeros in the one-hot encoded matrix). e Example of sequence used as input for each analysis depicted in A, B, C, and D. The pink box highlights the STR. All STRs are replaced by 9Ns in B and D, no matter their lengths. Additional seven bases downstream STR 3' end are masked in B because this window can contain bases corresponding to the DNA repeat motif, a feature that can easily be learned for STR classification. See details in the “Methods” section.
Fig. 6
Fig. 6. STR transcription initiation in mouse.
a Number of mouse STRs per class. For sake of clarity, only STR classes with >5000 loci are shown. b CAGE signal at mouse STR classes with >5000 loci. CAGE signal was computed as in Fig. 1d. Boxplots are defined as in Fig. 1d. c Testing the accuracy of CNN models built in human and tested in mouse for different STR classes. Performances of the models are assessed by computing the Spearman ρ between (i) CAGE signal observed in mouse and signal predicted by a model learned in human (blue dots), (ii) CAGE signal observed in mouse and signal predicted by a model learned in mouse (green dots), and (iii) CAGE signal observed in human and signal predicted by a model learned in human (red dots).
Fig. 7
Fig. 7. ClinVar variants at STRs.
a CAGE signal distribution of STRs associated (light blue) or not (dark blue) with at least one ClinVar variant. The number of STRs considered in each case is indicated in the bracket. b CAGE signal (y axis) at STRs associated with ClinVar variants ordered according to their clinical significance (x axis). The number of variants considered for each ClinVar class is indicated in the bracket. A one-way ANOVA test was used to assess overall statistical differences (P value = 2.5e-27). Pairwise comparisons using one-sided Mann–Whitney rank tests were also performed (P values are indicated in Supplementary Fig. 12). Boxplots are defined as in Fig. 1d. c Impact of the changes induced by ClinVar (black) and random (red) variants on CNN predictions. Predictions are made on the hg19 reference sequence and on a mutated sequence, containing the genetic variants. Changes are then computed as the difference between these two predictions (reference - mutated, Supplementary Fig. 13) and their impact is measured as their variance at each position around STR 3' end (x axis). To keep sequences aligned, only single nucleotide variants (SNVs) were considered. d Distribution of ClinVar (black) and random (red) variants around STR 3' end. The number of variants and their position relative to STR 3' end (position 0) are indicated on the y axis and x axis, respectively. A Kolmogorov–Smirnov test was used to assess statistical significance between the distribution of ClinVar variants and that of random variations (P value = 2.95e-11).

References

    1. Dunham I, et al. An integrated encyclopedia of DNA elements in the human genome. Nature. 2012;489:57–74. - PMC - PubMed
    1. Forrest AR, et al. A promoter-level mammalian expression atlas. Nature. 2014;507:462–470. - PMC - PubMed
    1. Andersson R, et al. An atlas of active enhancers across human cell types and tissues. Nature. 2014;507:455–461. - PMC - PubMed
    1. Hon CC, et al. An atlas of human long non-coding RNAs with accurate 5’ ends. Nature. 2017;543:199–204. - PMC - PubMed
    1. Birney E, et al. Identification and analysis of functional elements in 1% of the human genome by the ENCODE pilot project. Nature. 2007;447:799–816. - PMC - PubMed

Publication types