. 2021 Jun 2;12(1):3281.
doi: 10.1038/s41467-021-23531-z.

Engineered reproductively isolated species drive reversible population replacement

Affiliations

Engineered reproductively isolated species drive reversible population replacement

Anna Buchman et al. Nat Commun. .

Abstract

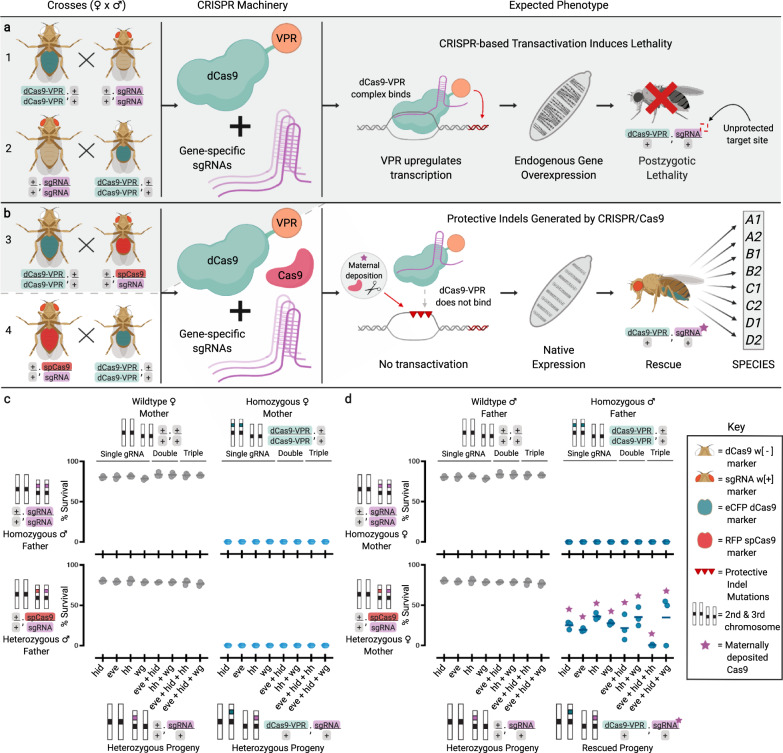
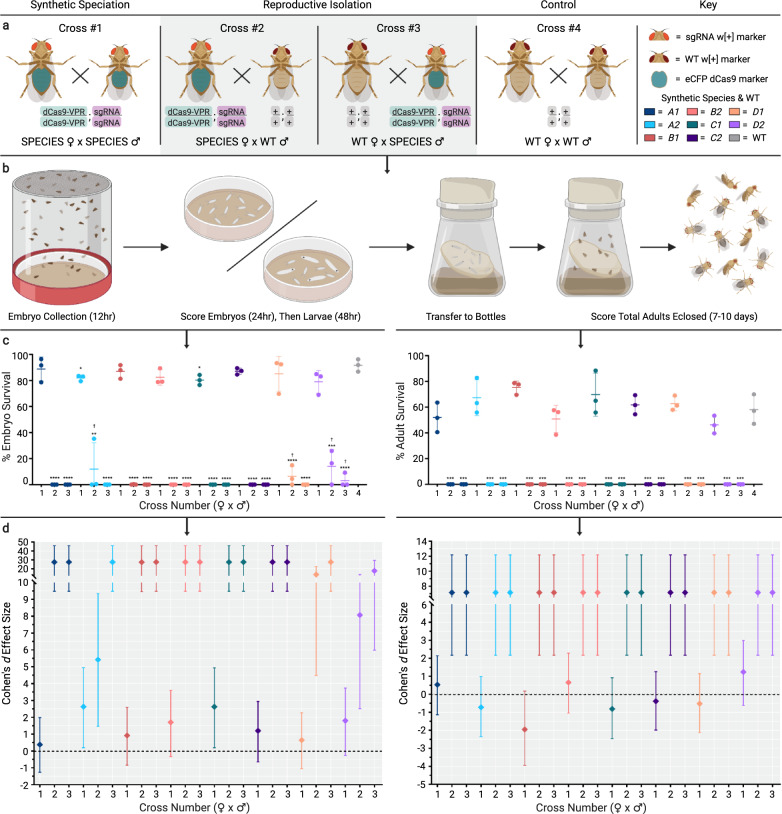
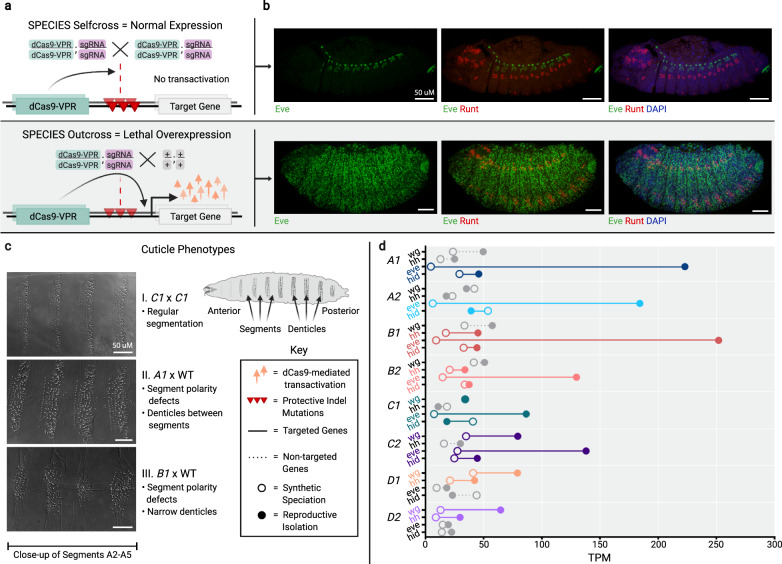
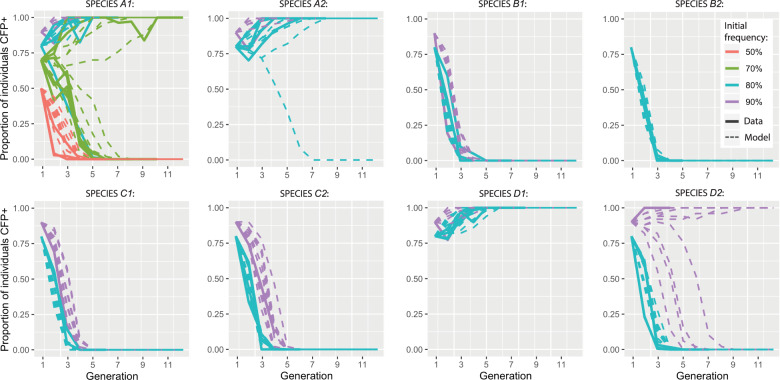
Engineered reproductive species barriers are useful for impeding gene flow and driving desirable genes into wild populations in a reversible threshold-dependent manner. However, methods to generate synthetic barriers are lacking in advanced eukaryotes. Here, to overcome this challenge, we engineer SPECIES (Synthetic Postzygotic barriers Exploiting CRISPR-based Incompatibilities for Engineering Species), an engineered genetic incompatibility approach, to generate postzygotic reproductive barriers. Using this approach, we create multiple reproductively isolated SPECIES and demonstrate their reproductive isolation and threshold-dependent gene drive capabilities in D. melanogaster. Given the near-universal functionality of CRISPR tools, this approach should be portable to many species, including insect disease vectors in which confinable gene drives could be of great practical utility.


Conflict of interest statement

O.S.A. and A.B. have a patent pending on this technology. Patent applicant—University of California, UCSD. Name of inventor(s)—A.B. and O.S.A. Application number—Invention 2020-184. Status of application—Pending. Specific aspect of manuscript covered in patent application—Using multiplexed dCas9/Cas9/gRNA combinations to generate reproductive isolation that can be used for population control. O.S.A. is co-founder and serves on the scientific advisory board of Agragene. All other authors declare no significant competing financial, professional, or personal interests that might have influenced the performance or presentation of the work described.

Figures

Fig. 1
Fig. 1. Development of synthetic reproductive barriers.
a Homozygous dCas9-VPR flies were crossed bidirectionally to homozygous sgRNA flies. Shaded gray background indicates expected lethal crosses. b Homozygous dCas9-VPR individuals were crossed bidirectionally to heterozygous spCas9/sgRNA individuals. Surviving individuals were repeatedly inbred to generate SPECIES. c, d Plots depicting % progeny survival from the crosses depicted in A and B. N = 3 biologically independent replicates for each gRNA combination (eight total combinations). Middle lines indicate mean. Gray dots indicate homozygous sgRNA and heterozygous spCas9/sgRNA flies crossed to wildtype flies. Light and dark blue dots indicate homozygous sgRNA and heterozygous spCas9/sgRNA flies crossed to homozygous dCas9-VPR mothers and fathers, respectively. Purple stars indicate the presence of maternally deposited Cas9. Source data are provided as a Source Data file.
Fig. 2
Fig. 2. Embryo and adult viability determination.
a Crosses used to determine embryo and adult viability. (Cross #1) Homozygous dCas9-VPR;sgRNA “SPECIES” females crossed to homozygous dCas9-VPR;sgRNA SPECIES males. (Cross #2) Homozygous dCas9-VPR;sgRNA SPECIES females crossed to wildtype (WT) males. (Cross #3) WT females crossed to homozygous dCas9-VPR;sgRNA SPECIES males. Gray shaded background indicates expected lethal crosses. (Cross #4) WT females crossed to WT males. Each cross type was performed for all eight generated SPECIES (Fig. S3). b Schematic detailing the methods of determining embryo and adult survival compared to WT. c % embryo and adult survival was calculated and plotted. The number below each x-axis group indicates cross number (#1–4). N = 3 biologically independent replicates for each cross number. ✝ indicates that embryos did not survive past L1/L2 stages. Unpaired two-tailed t-tests were performed for each SPECIES compared to WT (*p < 0.05, **p < 0.01, ***p < 0.001, and ****p < 0.0001). Middle lines indicate mean, while error bars represent standard deviation. The color of the dots represent each species as indicated in figure key. d Embryo (left graph) and adult (right graph) Cohen’s d effect sizes compared to WT. N = 6 observations per cross number per SPECIES (effect size based on mean comparison between three replicates of each experimental cross (#1–3) to control cross (#4)). Error bars represent 95% confidence interval. The color of the dots represent each species as indicated in figure key. Source data are provided as a Source Data file.
Fig. 3
Fig. 3. Visualization and quantification of target gene overexpression.
a Schematic demonstrating reproductive barriers. The homozygous progeny of intercrossed SPECIES contain two copies of protected indel mutations, preventing lethal overexpression. The heterozygous progeny of SPECIES outcrossed to WT inherit only one copy of the protected indel mutations, which cannot prevent lethal overexpression of the target genes. Gray shaded background indicates expected lethality. b Antibody stains for Eve (green) and Runt (red) in stage-13 embryos. DAPI (blue) stains all nuclei. Top row shows A1 × A1. Bottom row shows A1 × WT SPECIES outcross and Eve overexpression. c Cuticle preparations showing denticle belts in self cross vs. outcross. Representative embryos and larval cuticles shown in Fig. 3b, c. Separate crosses produced animals with similar expression patterns and phenotypes (two crosses per genotype, N > 30 embryos or larval cuticles examined per cross). d Normalized embryo RNA-seq data (transcripts per kilobase million, TPM) for each species either self-crossed (open circles) or outcrossed to WT (closed circles), indicating expected target gene overexpression (colored) (Supplementary Table 2). Source data are provided as a Source Data file.
Fig. 4
Fig. 4. Population experiments and model fits for eight SPECIES demonstrating threshold-dependent population replacement.
Population experiments mated SPECIES individuals with WT individuals, producing first generation SPECIES population frequencies of 50, 70, 80, and 90% for system A1; 80 and 90% for systems A2, B1, C1, C2, D1, and D2; and 90% for system B2. Results are shown as solid lines, while fitted model predictions are dashed lines. Observed data are consistent with fitness costs of SPECIES strains relative to WT (Supplementary Table 6). Ten stochastic model predictions are shown for each release frequency, assuming a population size of 50. Proportion of individuals CFP+ represents the percentage of SPECIES individuals at each generation. Source data are provided as a Source Data file.
Fig. 5
Fig. 5. Population dynamics of underdominant systems in a single population.
a Discrete generation model of a SPECIES-like extreme underdominant system with a fitness cost of 10% released at population frequencies of 45–60%. A release threshold is apparent between 50 and 55% (simulations confirm a threshold of 52.8%). b The release threshold increases with fitness cost, from 50% for no fitness cost, to 83.3% for an 80% fitness cost. c Extreme underdominant systems spread quickly, reaching a population frequency of 99% (including heterozygotes and homozygotes) within 3–4 generations of a release at a frequency of 65% for fitness costs between 0 and 20%. d Discrete generation model of reciprocal chromosomal translocations with a fitness cost of 10% released at population frequencies of 50–65%. A release threshold is apparent between 55 and 60% (simulations confirm a threshold of 56.1%). e The release threshold increases with fitness cost, from 50% for no fitness cost, to 62.4% for a 20% fitness cost. Translocations cannot spread for fitness costs greater than 66.3%. f Translocations spread less quickly, reaching a population frequency of 99% (including heterozygotes and homozygotes) within 7–13 generations of a release at a frequency of 65% for fitness costs between 0 and 20%. g Discrete generation model of two-locus engineered underdominance with a fitness cost of 10% released at population frequencies of 25–40%. A release threshold is apparent between 30 and 35% (simulations confirm a threshold of 31.2%). h The release threshold increases with fitness cost, from 26.9% for no fitness cost, to 35.9% for a 20% fitness cost. Two-locus engineered underdominance cannot spread for fitness costs greater than 72.7%. i Two-locus engineered underdominant systems spread slightly less quickly, reaching a population frequency of 99% (including heterozygotes and homozygotes) within 4–5 generations of a release at a frequency of 65% for fitness costs between 0 and 20%.
Fig. 6
Fig. 6. Population dynamics of underdominant systems in two populations.
a Discrete generation model of a SPECIES-like extreme underdominant system released at 60% in population A and initially absent from population B. Population A exchanges migrants with population B at a rate of 1% per individual per generation. For a fitness cost of 10%, the system reaches near-fixation in population A within seven generations but only spreads to 0.01% in population B. b As the migration rate increases, the SPECIES system reaches a higher frequency in population B, exceeding 4%; however, for migration rates above 16.6% per individual per generation, it is eliminated from both populations through dilution of population A with wild types from population B. c For the two-population model, there is a migration threshold below which the construct fixes in population A and persists at a low level in population B and above which it is lost in both populations. For the source model, extreme underdominance displays threshold behavior with respect to migration rate. d Discrete generation model of reciprocal chromosomal translocations released at 60% in population A and initially absent from population B. Population A exchanges migrants with population B at a rate of 1% per individual per generation. For a fitness cost of 10%, the system reaches near-fixation in population A within 22 generations and spreads to 3.6% in population B. e As the migration rate increases, the translocations reach a higher frequency in population B, exceeding 15%; however, for migration rates above 5.0% per individual per generation, they are eliminated from both populations through dilution of population A with wild types from population B. f For the two-population model, there is a migration threshold below which translocations fix in population A and persist at a low level in population B, and above which they are lost in both populations. For the source model, translocations display threshold behavior with respect to migration rate. g Discrete generation model of two-locus engineered underdominance released at 60% in population A and initially absent from population B. Population A exchanges migrants with population B at a rate of 1% per individual per generation. For a fitness cost of 10%, the system reaches near-fixation in population A within eight generations and spreads to 3.2% in population B. h As the migration rate increases, the system reaches a higher frequency in population B, exceeding 21.2%; however, for migration rates above 4.2% per individual per generation, the system becomes fixed in both populations. i Two-locus engineered underdominance displays threshold behavior with respect to migration rate.

Similar articles

Cited by

References

    1. Maselko M, Heinsch SC, Chacón JM, Harcombe WR, Smanski MJ. Engineering species-like barriers to sexual reproduction. Nat. Commun. 2017;8:883. doi: 10.1038/s41467-017-01007-3. - DOI - PMC - PubMed
    1. Lajoie MJ, et al. Genomically recoded organisms expand biological functions. Science. 2013;342:357–360. doi: 10.1126/science.1241459. - DOI - PMC - PubMed
    1. Boeke JD, et al. GENOME ENGINEERING. The Genome Project-Write. Science. 2016;353:126–127. doi: 10.1126/science.aaf6850. - DOI - PubMed
    1. Moreno E. Design and construction of ‘Synthetic Species’. PLoS One. 2012;7:e39054. doi: 10.1371/journal.pone.0039054. - DOI - PMC - PubMed
    1. Waters AJ, Capriotti P, Gaboriau DCA, Papathanos PA, Windbichler N. Rationally-engineered reproductive barriers using CRISPR & CRISPRa: an evaluation of the synthetic species concept in Drosophila melanogaster. Sci. Rep. 2018;8:13125. doi: 10.1038/s41598-018-31433-2. - DOI - PMC - PubMed

Publication types

Substances

LinkOut - more resources