. 2021 Jun 2;12(1):3285.
doi: 10.1038/s41467-021-23552-8.

Prohibitin 1 is essential to preserve mitochondria and myelin integrity in Schwann cells

Affiliations

Prohibitin 1 is essential to preserve mitochondria and myelin integrity in Schwann cells

Gustavo Della-Flora Nunes et al. Nat Commun. .

Abstract

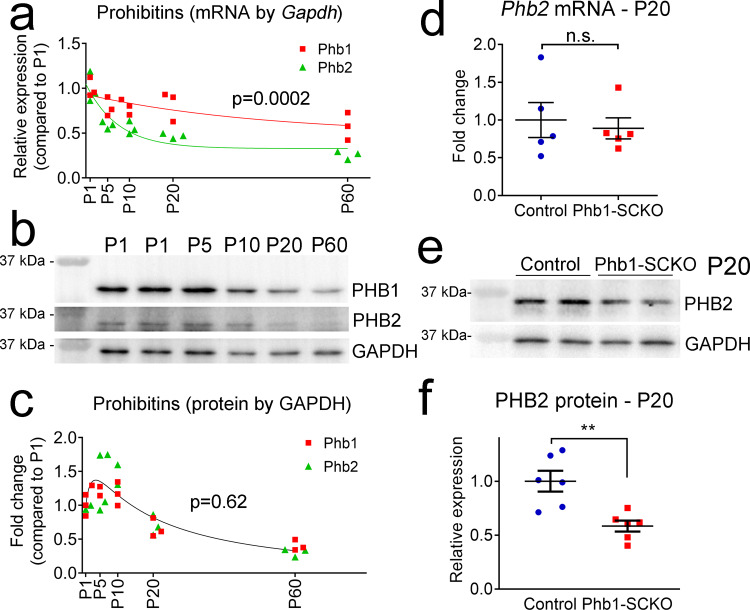
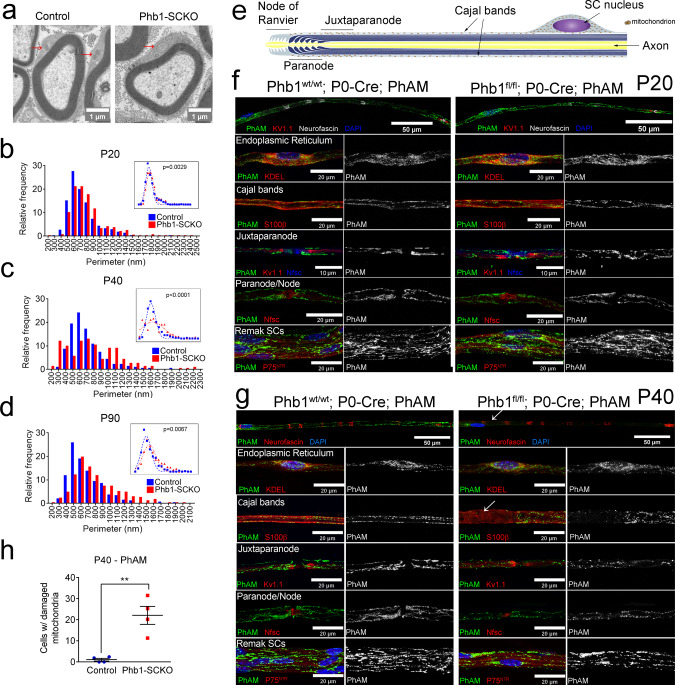
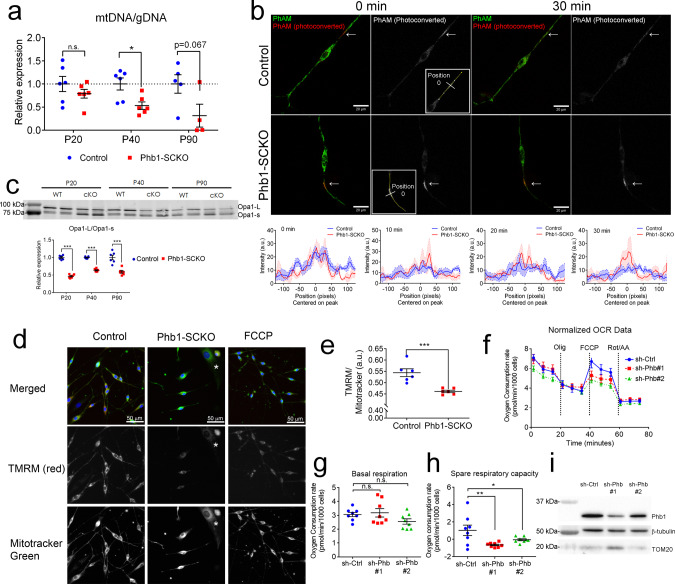
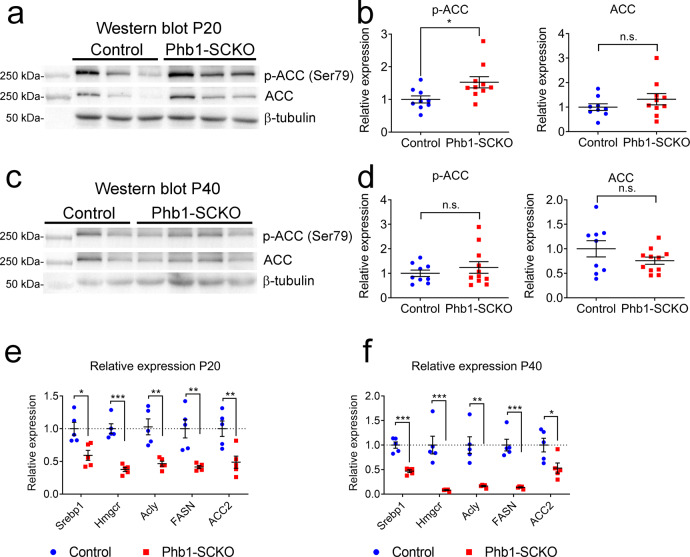
In peripheral nerves, Schwann cells form myelin and provide trophic support to axons. We previously showed that the mitochondrial protein prohibitin 2 can localize to the axon-Schwann-cell interface and is required for developmental myelination. Whether the homologous protein prohibitin 1 has a similar role, and whether prohibitins also play important roles in Schwann cell mitochondria is unknown. Here, we show that deletion of prohibitin 1 in Schwann cells minimally perturbs development, but later triggers a severe demyelinating peripheral neuropathy. Moreover, mitochondria are heavily affected by ablation of prohibitin 1 and demyelination occurs preferentially in cells with apparent mitochondrial loss. Furthermore, in response to mitochondrial damage, Schwann cells trigger the integrated stress response, but, contrary to what was previously suggested, this response is not detrimental in this context. These results identify a role for prohibitin 1 in myelin integrity and advance our understanding about the Schwann cell response to mitochondrial damage.


Conflict of interest statement

The authors declare no competing interests.

Figures

Fig. 1
Fig. 1. A progressive demyelination and axonal degeneration affect Phb1-SCKO animals.
a Schematic representation of the floxed Phb1 allele. Exons 4 and 5 of the Phb1 gene are deleted upon Cre expression. Primers p1 and p2 were used for genotyping, while primers p1 and p3 were used to evaluate recombination. Square (exon), triangle (loxP site), blue half-arrow (primer). b Recombination PCR on DNA isolated from sciatic nerves reveals a ∼260 bp recombined band in Phb1-SCKO animals, while unrecombined DNA is too long to generate an amplicon with our PCR conditions. The experiment was repeated independently twice with identical results. c RT-qPCR analyses show a significant reduction in the level of Phb1 mRNA in sciatic nerve lysates of postnatal day 20 (P20) Phb1-SCKO mice (red) compared to controls (blue). N = 4–5 animals per genotype. Unpaired two-tailed t-test (t = 4.295, df = 7, p = 0.0036). d Representative images of cross sections of sciatic nerves. N = 3–4 animals per genotype. e The number of myelinated axons per sciatic nerve is greatly reduced in Phb1-SCKO animals starting at postnatal day 40 (P40) (middle). The decline can be explained both by demyelination (bottom) and axonal degeneration, evidenced by the reduction in the total number of axons (top). N = 3–4 animals per genotype. Unpaired two-tailed t-test corrected for multiple comparisons using the Holm-Sidak method. Total axons [P20 (t = 0.816, df = 4, p = 0.46), P40 (t = 6.508, df = 5, p = 0.0038), P60 (t = 8.08, df = 5, p = 0.0022), P90 (t = 5.257, df = 4, p = 0.012), P120 (t = 10.608, df = 4, p = 0.0022)]; myelinated axons [P20 (t = 1.053, df = 4, p = 0.35), P40 (t = 7.885, df = 5, p = 0.0016), P60 (t = 8.635, df = 5, p = 0.0014), P90 (t = 6.572, df = 4, p = 0.0055), P120 (t = 20.281, df = 4, p = 0.00017)]; amyelinated axons [P20 (t = 5.608, df = 4, 0.0099), P40 (t = 6.832, df = 5, p = 0.0041), P60 (t = 6.371, df = 5, p = 0.0042), P90 (t = 10.346, df = 4, p = 0.0024), P120 (t = 2.643, df = 4, p = 0.057)]. f Representative electron micrographs demonstrating the presence of degenerating axons (arrows), amyelinated/demyelinated axons (arrowheads) and SCs degrading their own myelin (star). N = 3 animals per genotype. g Sparse labeling of axons in the tibial nerve using the Thy1-YFP reporter mouse indicates the presence of axonal swelling at P20 (arrowheads) and axon fragmentation at P40 (arrows). N = 3–4 animals per genotype. h A functional decline is detected in Phb1-SCKO animals by electrophysiological measurements, with a reduction in nerve conduction velocity as early as P20 and decreased CMAP amplitude at P40. N = 4–8 animals per genotype. Unpaired two-tailed t-test. Velocity [P20 (t = 6.387, df = 8, p = 0.0002), P40 (t = 23.76, df = 8, p < 0.0001)]; Amplitude [P20 (t = 1.574, df = 14, p = 0.14), P40 (t = 5.635, df = 8, p = 0.0005)]. Data are presented as mean ± SEM. *p < 0.05, **p < 0.01, ***p < 0.001. n.s. = non-significant.
Fig. 2
Fig. 2. Levels of Phb1 and Phb2 are mostly but not completely interdependent.
a Developmental trajectory of Phb1 (red) and Phb2 (green) mRNA in sciatic nerves. N = 3 animals per time point. Non-linear regression modeled from a one-phase decay function followed by extra sum-of-squares F test; F (3, 24) = 10.24. b Western blots of sciatic nerve lysates at the indicated ages. c Quantification of the changes in expression of PHB1 and PHB2 in sciatic nerves over time. N = 3 samples per time point. Samples at postnatal day 1 (P1) and P5 were pooled from 4 and 2 animals, respectively. Non-linear regression modeled from a lognormal function followed by extra sum-of-squares F test; F (3, 24) = 0.6188. d RT-qPCR from P20 sciatic nerves show that Phb2 mRNA levels are not altered by deletion of Phb1. N = 5 animals per genotype. Unpaired two-tailed t-test; t = 0.4075, df = 8. e Western blot from sciatic nerve lysates of P20 Phb1-SCKO mice illustrating the reduction of PHB2 levels. f Quantification of (e). N = 6 animals per genotype. Unpaired two-tailed t-test; t = 3.825, df = 10, p = 0.0033. Data are presented as mean ±  SEM. **p < 0.01. n.s. non-significant.
Fig. 3
Fig. 3. Ablation of Prohibitin 1 in Schwann cells results in altered mitochondrial morphology.
a Representative electron micrographs highlighting the enlargement of mitochondria in sciatic nerves of Phb1-SCKO animals at postnatal day 20 (P20) (arrows). N = 3 animals per genotype. (b-d) Mitochondria in SCs of PHB1-SCKO mice (red) have a larger perimeter compared to mitochondria of control animals (blue) at P20 (b), P40 (c), and P90 (d). At P40, there is also a population of mitochondria that has a reduced perimeter, suggesting mitochondrial fragmentation. This population is lost at P90, suggesting that the fragmented mitochondria disappear. N = 3 animals per genotype; at least 100 mitochondria from each animal were evaluated. Insets: non-linear regression using a Gaussian curve followed by extra sum-of-squares F test [F(3,42) P20 = 5.482, F(3,38) P40 = 19.48, F(3,34) P90 = 4.813). e Schematic representation of the distribution of mitochondria in a myelinating SC. fg Confocal z-projections of teased fibers of sciatic nerves of Phb1-SCKO mice and controls illustrating the morphology of Schwann cell mitochondria as labeled by the PhAM reporter (green) near different cellular structures (red). DAPI is indicated in blue. f At P20, there are changes in mitochondrial size. N = 4 animals per genotype. g At P40, some cells lack PhAM expression away from the cell body. N = 3 animals per genotype. h PhAM is not detectable in about 20% of the myelin internodes of Phb1-SCKO animals at P40. N = 4 animals per genotype. Unpaired two-tailed t-test (t = 4.866, df = 6, p = 0.0028). Data are presented as mean ± SEM. **p < 0.01.
Fig. 4
Fig. 4. Mitochondria of Phb1-SCKO are dysfunctional.
a The mitochondrial DNA (mtDNA) content is decreased in Phb1-SCKO mice (red) compared to controls (blue) starting at postnatal day 40 (P40). N = 4–6 animals per genotype. Unpaired two-tailed t-test corrected for multiple comparisons using the Holm-Sidak method [P20 (t = 1.114, df = 10, p = 0.29), P40 (t = 3.068, df = 10, p = 0.012), P90 (t = 2.174, df = 7, p = 0.066)]. b Mitochondrial dynamics is affected by deletion of Phb1 in primary mouse SCs. Top: PhAM fluorescence was photoconverted using a focal laser stimulation and dynamics of the photoconverted mitochondria (arrows) were observed for 30 min. While the PhAM (photoconverted) signal quickly dissipated in the control SCs, it remained stagnant in Phb1-SCKO SCs. Inset: position 0 represents the center of the stimulated area. Bottom: quantification of PhAM (photoconverted) signal around the stimulated area at different time points. Mean (line) and SEM (shaded area) of the signal is reported. A.u. =  arbitrary units. N = 6–7 cells per genotype. c Processing of the mitochondrial fusion protein Opa1 is increased in Phb1-SCKO mice. N = 6 animals per genotype. Unpaired two-tailed t-test [P20 (t = 16.664, df = 10, p < 0.000001), P40 (t = 17.015, df = 10, p < 0.000001), P90 (t = 5.335, df = 10, p = 0.00033)]. d Ablation of Phb1 leads to reduced mitochondrial membrane potential in primary SCs of P40 PHB1-SCKO mice as compared to controls. e Quantification of (d). N = 6 wells per genotype. Unpaired two-tailed t-test (t = 4.583, df = 10, p = 0.001). Asterisk: fibroblast. fh In primary rat SCs, Seahorse analyses indicate that Phb1 knockdown with either sh-Phb #1 (red) or sh-Phb #2 (green) does not change basal mitochondrial respiration (One-way ANOVA. F (2, 21) = 2.195, p = 0.1363) (g), but impairs the spare respiratory capacity (h). Timing of injection of oligomycin (Olig), FCCP, and rotenone (Rot) + antimycin A (AA) are indicated in (f). i Western blot illustrating the reduction in levels of PHB1 upon treatment with shRNAs (63% and 21% reduction in PHB1/β-tubulin ratio for sh-Phb #1 and sh-Phb #2, respectively). N = 8 wells per condition. One-way ANOVA. F (2,21) = 5.594, p = 0.0113; psh-Phb1#1 = 0.0068; psh-Phb1#2 = 0.0456. Data are presented as mean ± SEM. *p < 0.05, **p < 0.01, ***p < 0.001. n.s. non-significant.
Fig. 5
Fig. 5. Deletion of Phb1 in SCs triggers a mitochondrial stress response.
a p-eIF2α is upregulated in sciatic nerve lysates of PHB1-SCKO mice (red) compared to controls (blue), indicating activation of the ISR. N = 6–7 animals per genotype. Unpaired two-tailed t-test. p-eIF2α [P20 (t = 3.068, df = 10, p = 0.013), P40 (t = 4.948, df = 10, p = 0.0019), P90 (t = 6.088, df = 12, p = 0.0029)]; eIF2α [P20 (t = 0.759, df = 10, p = 0.091), P40 (t = 4.532, df = 10, p = 0.023), P90 (t = 3.582, df = 12, p = 0.018)]. b Representative western blot for CLPP, a protease involved in the UPRmt response (left) and quantification of relative expression levels at different time points (right). N = 6-10 animals per genotype. Unpaired two-tailed t-test [P20 (t = 1.616, df = 18, p = 0.12), P40 (t = 1.416, df = 10, p = 0.19), P90 (t = 0.696, df = 12, p = 0.5)]. c Representative immunoblot for HSPD1, a chaperone participating in the UPRmt cascade (left) and quantification of relative expression levels at different time points (right). N = 4–5 animals per genotype. Unpaired two-tailed t-test [P20 (t = 1.46, df = 6, p = 0.19), P40 (t = 0.057, df = 8, p = 0.96), P90 (t = 1.46, df = 10, p = 0.17)]. d RT-qPCR analysis of gene expression of Clpp, Hspd1 and Hspe1 (Hsp10). N = 4–5 animals per genotype. Unpaired two-tailed t-test Clpp [P20 (t = 1.013, df = 7, p = 0.34), P40 (t = 2.642, df = 7, p = 0.033)]; Hspd1 [P20 (t = 0.217, df = 7, p = 0.83), P40 (t = 0.9, df = 7, p = 0.4)]; Hspe1 [P20 (t = 0.899, df = 7, p = 0.4), P40 (t = 1.472, df = 7, p = 0.18)]. e The mitochondrial stress response involves ATF4, as suggested by the upregulation of its targets: Asgn (aspargine synthetase), Chac1 (cation transport regulator-like protein 1), Pck2 (phosphoenolpyruvate carboxykinase 2), Dddit3 (DNA damage-inducible transcript 3), Psph (phosphoserine phosphatase). N = 4–5 animals per genotype. Unpaired two-tailed t-test. Atf4 [P20 (t = 0.456, df = 7, p = 0.66), P40 (t = 0.288, df = 7, p = 0.78)]; Asns [P20 (t = 12.772, df = 7, p = 0.00095), P40 (t = 5.459, df = 7, 0.000004)]; Chac1 [P20 (t = 8.361, df = 7, 0.000069), P40 (t = 7.134, df = 7, p = 0.00019)]; Pck2 [P20 (t = 6.84, df = 7, p = 0.00024), P40 (t = 5.897, df = 7, p = 0.0006)]; Psph [P20 (t = 0.051, df = 7, p = 0.96), P40 (t = 1.79, df = 7, p = 0.12)]; Ddit3 [P20 (t = 2.292, df = 7, p = 0.056), P40 (t = 5.113, df = 7, p = 0.0014)]. Data are presented as mean ± SEM. *p < 0.05, **p < 0.01, ***p < 0.001. n.s. non-significant.
Fig. 6
Fig. 6. Deletion of Phb1 affects lipid metabolism.
Western blot (a) and quantification (b) of Acetyl-CoA carboxylase (ACC) and phosphorylated ACC (p-ACC) expression at P20. N = 6–7 animals per genotype. Unpaired two-tailed t-test [p-ACC (t = 0.4627, df = 11, p = 0.021), ACC (t = 1.355, df = 11, p = 0.26)]. Western blot (c) and quantification (d) of ACC and p-ACC expression at P40. N = 6–8 animals per genotype [p-ACC (t = 0.5447, df = 12, p = 0.42), ACC (t = 1.153, df = 12, p = 0.17)]. Unpaired two-tailed t-test. By RT-qPCR, we identified a significant downregulation of many enzymes involved with lipid biosynthesis at both P20 (e) and P40 (f): sterol regulatory element-binding protein 1 (Srebp1), 3-hydroxy-3-methylglutaryl-CoA reductase (Hmgcr), ATP citrate lyase (Acly), fatty acid synthase (FASN), acetyl-CoA carboxylase 2 (ACC2), N = 5 animals per genotype. Unpaired two-tailed t-test P20 [Srebp1 (t = 3.26, df = 8, p = 0.012), Hmgcr (t = 7.63, df = 8, p = 0.000061), Acly (t = 4.418, df = 8, 0.0022), FASN (t = 4.109, df = 8, p = 0.0034), ACC2 (t = 3.408, df = 8, p = 0.0092)]; P40 [Srebp1 (t = 7.551, df = 8, p = 0.000066), Hmgcr (t = 5.091, df = 8, p = 0.00094), Acly (t = 4.934, df = 8, p = 0.0011), FASN (t = 7.186, df = 8, p = 0.000094), ACC2 (t = 2.697, df = 8, p = 0.027)]. Data are presented as mean ± SEM. *p < 0.05; **p < 0.01; ***p < 0.001. n.s. non-significant.
Fig. 7
Fig. 7. Induction of the ISR in Phb1-SCKO mice may be protective against demyelination.
a Schematic of the mechanism of action of ISRIB, an inhibitor of the integrated stress response (ISR). Animals received daily intraperitoneal injections of 2.5 mg/Kg ISRIB or vehicle (Veh) from P20 to P40. b ISRIB does not affect eIF2α expression or phosphorylation (western blot from sciatic nerve lysates). N = 4-6 animals per group. Two-way ANOVA corrected for multiple comparisons using the Holm-Sidak method. p-eIF2αː F (1,18) group =  32.43, p < 0.0001; F (1,18) interaction = 7.815, p = 0.012; pControl+Veh_Phb1SCKO+Veh = 0.0001; pControl+Veh_Phb1SCKO+ISRIB = 0.005; pControl+ISRIB_Phb1SCKO+Veh = 0.0026. eIF2αː F (1,18) group = 11.29; p < 0.01. c RT-qPCR analyses indicate that the expression levels of several ATF4 genes are reduced upon ISRIB treatment. N = 5–6 animals per group. Two-way ANOVA corrected for multiple comparisons using the Holm-Sidak method. Asns: F (1,18) group = 156.4, p < 0.001; F (1,18) treatment = 18.3, p < 0.001; F (1,18) interaction =  19.3, p < 0.001; pControl+Veh_Phb1SCKO+Veh < 0.0001; pControl+Veh_Phb1SCKO+ISRIB < 0.0001; pControl+ISRIB_Phb1SCKO+Veh < 0.0001; pControl+ISRIB_Phb1SCKO+ISRIB < 0.0001; pPhb1SCKO+Veh_Phb1SCKO+ISRIB < 0.0001. Chac1: F (1,18) group = 179.7, p < 0.001; F (1,18) treatment = 90.61, p < 0.001; F (1,18) interaction = 92.79, p < 0.001; pControl+Veh_Phb1SCKO+Veh < 0.0001; pControl+Veh_Phb1SCKO+ISRIB = 0.035; pControl+ISRIB_Phb1SCKO+Veh < 0.0001; pControl+ISRIB_Phb1SCKO+ISRIB = 0.0353; pPhb1SCKO+Veh_Phb1SCKO+ISRIB < 0.0001. Pck2: F (1,18) group = 34.35, p < 0.001; pControl+Veh_Phb1SCKO+Veh = 0.0013; pControl+Veh_Phb1SCKO+ISRIB = 0.013; pControl+ISRIB_Phb1SCKO+Veh = 0.0005; pControl+ISRIB_Phb1SCKO+ISRIB = 0.006. Ddit3: F (1,18) group = 84.51, p < 0.001; F (1,18) treatment =  32.15, p < 0.001; F (1,18) interaction = 31.04, p < 0.001; pControl+Veh_Phb1SCKO+Veh < 0.0001; pControl+Veh_Phb1SCKO+ISRIB = 0.045; pControl+ISRIB_Phb1SCKO+Veh < 0.0001; pControl+ISRIB_Phb1SCKO+ISRIB = 0.045; pPhb1SCKO+Veh_Phb1SCKO+ISRIB < 0.0001. d Representative semithin images of tibial nerves. Insets show magnified images. Degenerating axons (arrowhead), demyelinated axons (arrows), myelin degradation (myelinophagy; stars). N = 5–6 animals per group. e ISRIB treatment leads to increased demyelination and myelinophagy in Phb1-SCKO mice. N = 5–6 animals per group. Two-way ANOVA corrected for multiple comparisons using the Holm-Sidak method. Myelinated: F (1,19) group = 98.01, p < 0.001; pControl+Veh_Phb1SCKO+Veh < 0.0001; pControl+Veh_Phb1SCKO+ISRIB < 0.0001; pControl+ISRIB_Phb1SCKO+Veh < 0.0001; pControl+ISRIB_Phb1SCKO+ISRIB < 0.0001. Demyelinated: F (1,19) group = 85.58, p < 0.001; F (1,19) treatment = 6.836, p < 0.05; F (1,19) interaction =  6.469, p < 0.05; pControl+Veh_Phb1SCKO+Veh = 0.0007; pControl+Veh_Phb1SCKO+ISRIB < 0.0001; pControl+ISRIB_Phb1SCKO+Veh = 0.0007; pControl+ISRIB_Phb1SCKO+ISRIB < 0.0001; pPhb1SCKO+Veh_Phb1SCKO+ISRIB = 0.0041. Myelinophagy: F (1,19) group = 43.77, p < 0.001; F (1,19) treatment = 9.938, p < 0.01; F (1,19) interaction = 9.838,   < 0.01; pControl+Veh_Phb1SCKO+Veh = 0.078; pControl+Veh_Phb1SCKO+ISRIB < 0.0001; pControl+ISRIB_Phb1SCKO+Veh = 0.078; pControl+ISRIB_Phb1SCKO+ISRIB < 0.0001; pPhb1SCKO+Veh_Phb1SCKO+ISRIB = 0.0014. Degenerating: F (1,19) group = 32.17, p < 0.001; pControl+Veh_Phb1SCKO+Veh = 0.001; pControl+Veh_Phb1SCKO+ISRIB = 0.013; pControl+ISRIB_Phb1SCKO+Veh = 0.0008; pControl+ISRIB_Phb1SCKO+ISRIB = 0.012. f Phb1-SCKO mice treated with ISRIB were the worst performing group in the rotarod test. Controls are significantly different from Phb1-SCKO mice (irrespectively of treatment; omitted for clarity). N = 5–6 animals per group. Repeated measures two-way ANOVA corrected for multiple comparisons using the Holm-Sidak method. F (3,19) group = 38.06, p < 0.001; F (3,57) time = 37.24, p < 0.001; F (9,57) interaction  = 7.511, p < 0.001; (pPhb1SCKO+ISRIB_Phb1-SCKO+Veh: Day 2 = 0.0936, Day 3 = 0.0979, Day 4 = 0.0723). g Schematic representation of the phenotype seen in Phb1-SCKO mice. Data are presented as mean ±  SEM. *p < 0.05, **p < 0.01, ***p < 0.001. Non-significant results omitted for clarity.

Similar articles

Cited by

References

    1. Webster HD. The geometry of peripheral myelin sheaths during their formation and growth in rat sciatic nerves. J. Cell Biol. 1971;48:348–367. doi: 10.1083/jcb.48.2.348. - DOI - PMC - PubMed
    1. Nave KA. Myelination and the trophic support of long axons. Nat. Rev. Neurosci. 2010;11:275–283. doi: 10.1038/nrn2797. - DOI - PubMed
    1. Pareyson D, Piscosquito G, Moroni I, Salsano E, Zeviani M. Peripheral neuropathy in mitochondrial disorders. Lancet Neurol. 2013;12:1011–1024. doi: 10.1016/S1474-4422(13)70158-3. - DOI - PubMed
    1. Ino D, Iino M. Schwann cell mitochondria as key regulators in the development and maintenance of peripheral nerve axons. Cell Mol. Life Sci. 2017;74:827–835. doi: 10.1007/s00018-016-2364-1. - DOI - PMC - PubMed
    1. Funfschilling U, et al. Glycolytic oligodendrocytes maintain myelin and long-term axonal integrity. Nature. 2012;485:517–521. doi: 10.1038/nature11007. - DOI - PMC - PubMed

Publication types

MeSH terms