Comparative Study
. 2021 Jun 2;12(1):3282.
doi: 10.1038/s41467-021-23588-w.

RNA atlas of human bacterial pathogens uncovers stress dynamics linked to infection

Affiliations
Comparative Study

RNA atlas of human bacterial pathogens uncovers stress dynamics linked to infection

Kemal Avican et al. Nat Commun. .

Abstract

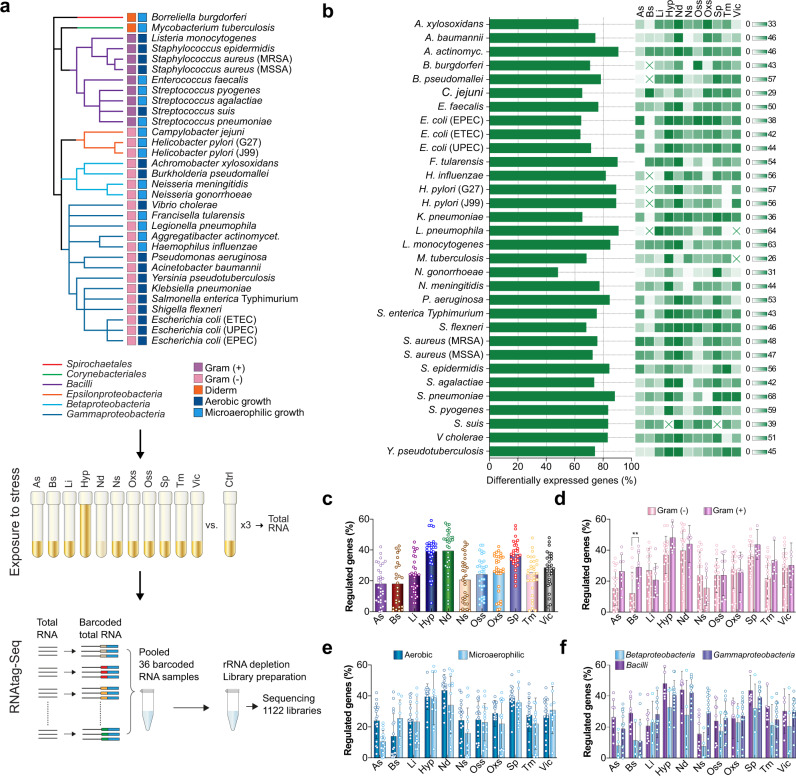
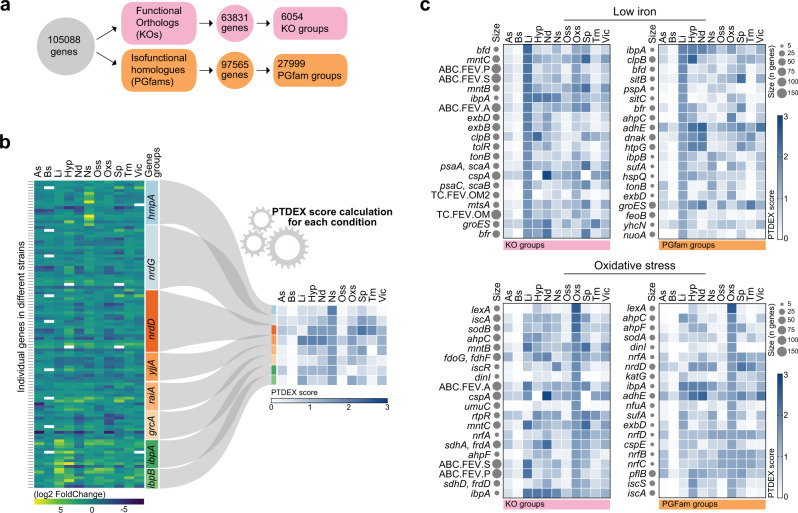
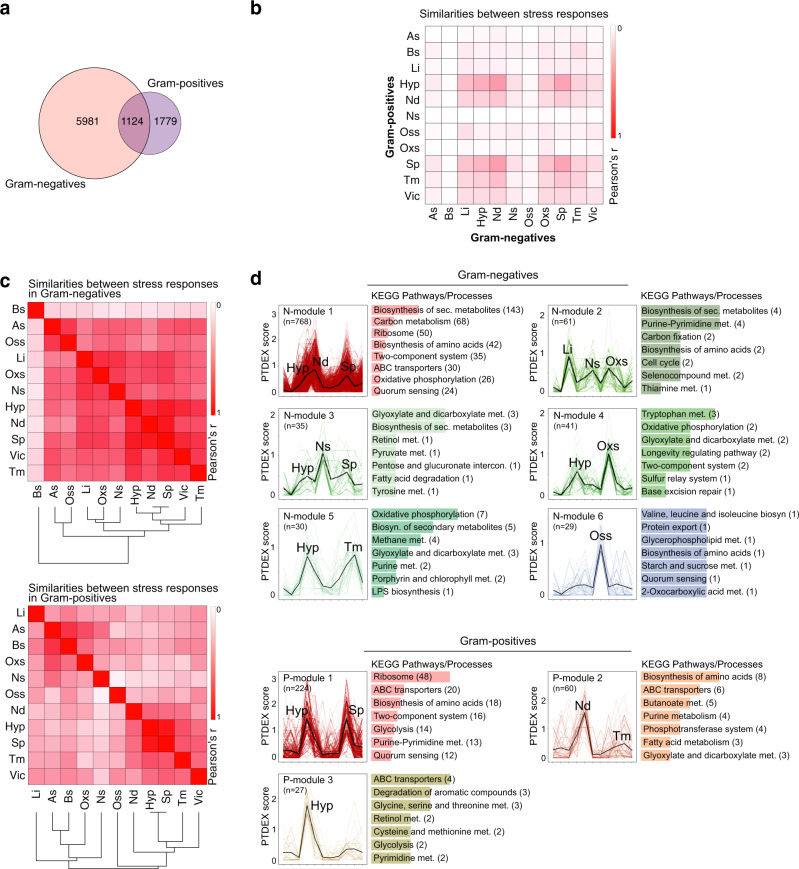
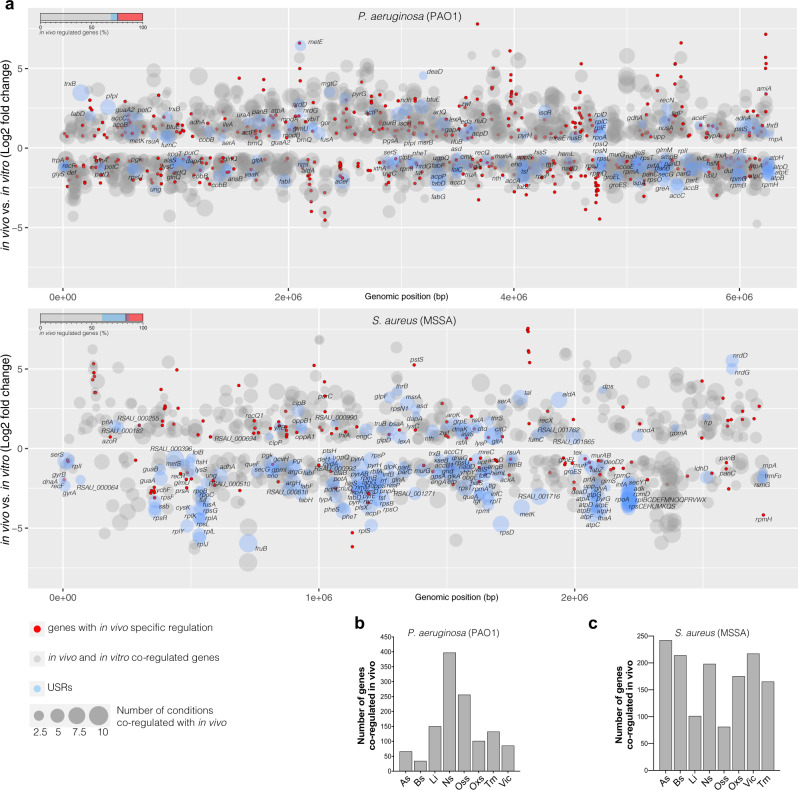
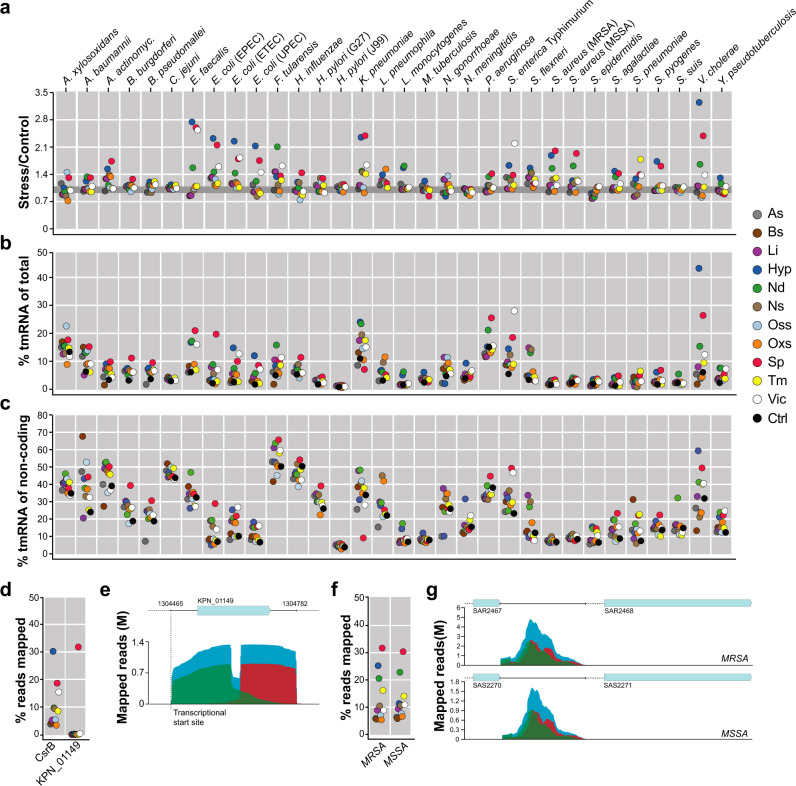
Bacterial processes necessary for adaption to stressful host environments are potential targets for new antimicrobials. Here, we report large-scale transcriptomic analyses of 32 human bacterial pathogens grown under 11 stress conditions mimicking human host environments. The potential relevance of the in vitro stress conditions and responses is supported by comparisons with available in vivo transcriptomes of clinically important pathogens. Calculation of a probability score enables comparative cross-microbial analyses of the stress responses, revealing common and unique regulatory responses to different stresses, as well as overlapping processes participating in different stress responses. We identify conserved and species-specific 'universal stress responders', that is, genes showing altered expression in multiple stress conditions. Non-coding RNAs are involved in a substantial proportion of the responses. The data are collected in a freely available, interactive online resource (PATHOgenex).


Conflict of interest statement

The authors declare no competing interests.

Figures

Fig. 1
Fig. 1. Stress responses of cross-microbial human pathogens.
a Phylogenetic clustering of bacterial species included in the study together with a schematic illustration of the experimental setup for 11 infection-related stress exposures (see also Table 1) and RNA-seq library preparation with RNAtag-Seq allowing multiple samples (36 in this study) per library used for obtaining 1122 transcriptomes deposited in the PATHOgenex RNA atlas. Phylogenetic orders, Gram staining groups, and oxygen dependency are indicated by color. b Proportion of genes differentially regulated in at least one of the conditions for each species. The linked heat maps show proportions of regulated genes for each stress condition. The scales to the right show the span from zero (white) to the highest (green) proportion (%) of regulated genes in the stress condition with the highest percentage of regulated genes. Heat map squares marked with a cross indicate that RNA-seq was not performed for that specific condition. c Dot plot showing the percentages of genes differentially regulated in each condition for all included species, d for Gram-negative and -positive bacteria, e for bacterial groups with aerobic and microaerophilic growth, f for three main phylogenetical orders included in this study. n = 32 species were examined for As, Li, Nd, Ns, Oss, and Oxs; n = 26 were examined for Bs; n = 31 were examined for Hyp; n = 31 were examined for Sp; n = 30 were examined for Vic in c. n = 21 Gram-negative and n = 8 Gram-positive; n = 17 aerobic and n = 15 microaerophilic bacterial species were examined in d and e, respectively. n = 4, n = 14, and n = 8 bacterial species from Betaproteobacteria, Gammaprotobacteria, and Bacilli were examined in e. Data are presented as mean values in c and as mean values ± SD in d, e, and f. The significance between the groups in d, e, and f was calculated with two-tailed Multiple t-test using Holm-Sidak method by Prism Graphpad version 8.2.0. ** indicates p-value = 0.0033. Source data are provided as a Source Data file.
Fig. 2
Fig. 2. Transformation of differential expression to PTDEX scores for cross-microbial comparisons.
a Schematic illustration of clustering of 105,088 genes based on functional orthology (KO) and isofunctional homology (PGFam) and resulting KO and PGFam gene groups. b Illustration of the transformation of differential expression values of genes from many pathogens that are clustered in one gene group into a PTDEX score for each stress condition. Eight gene groups with highest PTDEX scores in nitrosative stress condition are shown as example. White rectangles indicate no differential expression. c Heat maps showing the 20 KO (left) and PGFam (right) groups with highest PTDEX scores in low iron (top) and oxidative stress (bottom) conditions. The size of gray dots after the gene name relates to the number of genes in the gene groups. Source data are provided as a Source Data file.
Fig. 3
Fig. 3. Gram-negative and -positive bacteria exhibit distinct responses.
a Venn diagram of individual and shared PGFam groups with a PTDEX score >0 in at least one of the stress conditions. Venn diagram was generated with http://bioinformatics.psb.ugent.be/webtools/Venn/. b Heat map showing degree of similarity between responses to different stresses in Gram-negative and -positive bacteria. The similarity was calculated using the Pearson correlation coefficient of PGFam groups PTDEX scores in each condition. c Heat map showing degree of similarity between responses to different stress conditions in Gram-negative and -positive bacteria. Similarities were calculated as in b and the similarity distances shown in a dendrogram. d Modules generated by CemiTool showing conditions that involve similar regulation of gene groups with high PTDEX scores in Gram-negative and -positive bacteria. n indicates number of PGFam groups within each module. The most enriched KEGG pathways/processes for each module are shown with the number of gene groups indicated in brackets. See also Supplementary Data 5 and 6.
Fig. 4
Fig. 4. Stress responses identified in PATHOgenex are relevant for infection in vivo and can be used for determination of environmental stresses for pathogens at different infection niches.
a Differentially expressed genes obtained from differential expression analysis of in vivo transcriptomes of P. aeruginosa in cystic fibrosis lungs and S. aureus (MSSA) during acute murine osteomyelitis were mapped to in vitro stress responses of the corresponding species. Log2 fold changes in vivo vs. in vitro (control) are shown with genomic localization of genes for each species. The genes that are co-regulated (up/up or down/down) between in vivo and in vitro stress conditions are shown in gray or blue (conserved USRs) bubbles where the size of the bubble indicates number of conditions showing co-regulation with in vivo. Genes with in vivo specific regulation, which has no co-regulation at any of the stress conditions, are shown with red bubbles. The bars in the upper left corner of each bubble plot indicate the proportion of genes that are similarly regulated in vivo and in vitro (grey and blue, where blue indicate USRs) and proportion of genes showing in vivo specific regulation (red). b The number of genes that are co-regulated during infection for each of the PATHOgenex in vitro stress conditions for P. aeruginosa and c, for S. aureus. Hypoxia, nutritional downshift, and stationary phase were not included due to the presence of variety of stress responses under those conditions. Source data are provided as a Source Data file.
Fig. 5
Fig. 5. Complex stress conditions commonly involve differential expression from non-coding regions.
a Ratio of percent of reads mapped to non-CDSs under each stress condition in comparison to control for all tested strains. Different stress conditions are indicated by color (right). The gray line indicates Stress/Control value equal to one. b Proportion of reads mapped to tmRNA sequences of total number of mapped reads under each stress condition for all tested strains. c Proportion of reads mapped to tmRNA sequences of total number of reads mapped to non-CDSs under each stress condition for all tested strains. d Proportion of reads mapped to the K. pneumoniae CsrB and to the region covering KPN_01149 CDS with 5′-UTR and 3′-UTR sequences under each stress condition. e Number and alignments of reads mapped to KPN_01149 and its UTRs in stationary phase. Green indicates forward reads, red indicates reverse reads, and blue indicates paired reads. The vertical dashed line indicates the position of the TSS of KPN_01149. f Proportion of reads mapped to SRS42 in S. aureus MRSA and MSSA genomes under each stress condition. g Number and alignments of reads mapped to SRS42 in S. aureus MRSA and MSSA strains in stationary phase. Colors represent reads as noted in e. Different stress conditions are indicated with colored dots on the right. The means of three replicates in each condition were used for the calculation in ad, and f. Source data are provided as a Source Data file.

Similar articles

Cited by

References

    1. Malachowa N, Kobayashi SD, Sturdevant DE, Scott DP, DeLeo FR. Insights into the Staphylococcus aureus-host interface: global changes in host and pathogen gene expression in a rabbit skin infection model. PLoS ONE. 2015;10:e0117713. doi: 10.1371/journal.pone.0117713. - DOI - PMC - PubMed
    1. Mandlik A, et al. RNA-Seq-based monitoring of infection-linked changes in Vibrio cholerae gene expression. Cell Host Microbe. 2011;10:165–174. doi: 10.1016/j.chom.2011.07.007. - DOI - PMC - PubMed
    1. Avican K, et al. Reprogramming of Yersinia from virulent to persistent mode revealed by complex in vivo RNA-seq analysis. PLoS Pathog. 2015;11:e1004600. doi: 10.1371/journal.ppat.1004600. - DOI - PMC - PubMed
    1. Nuss AM, et al. Tissue dual RNA-seq allows fast discovery of infection-specific functions and riboregulators shaping host-pathogen transcriptomes. Proc. Natl Acad. Sci. USA. 2017;114:E791–E800. doi: 10.1073/pnas.1613405114. - DOI - PMC - PubMed
    1. Klinkert B, Narberhaus F. Microbial thermosensors. Cell Mol. Life Sci. 2009;66:2661–2676. doi: 10.1007/s00018-009-0041-3. - DOI - PMC - PubMed

Publication types

MeSH terms