. 2021 Jun 2;5(1):46.
doi: 10.1038/s41698-021-00186-z.

Identification of gastric cancer subtypes based on pathway clustering

Affiliations

Identification of gastric cancer subtypes based on pathway clustering

Lin Li et al. NPJ Precis Oncol. .

Abstract

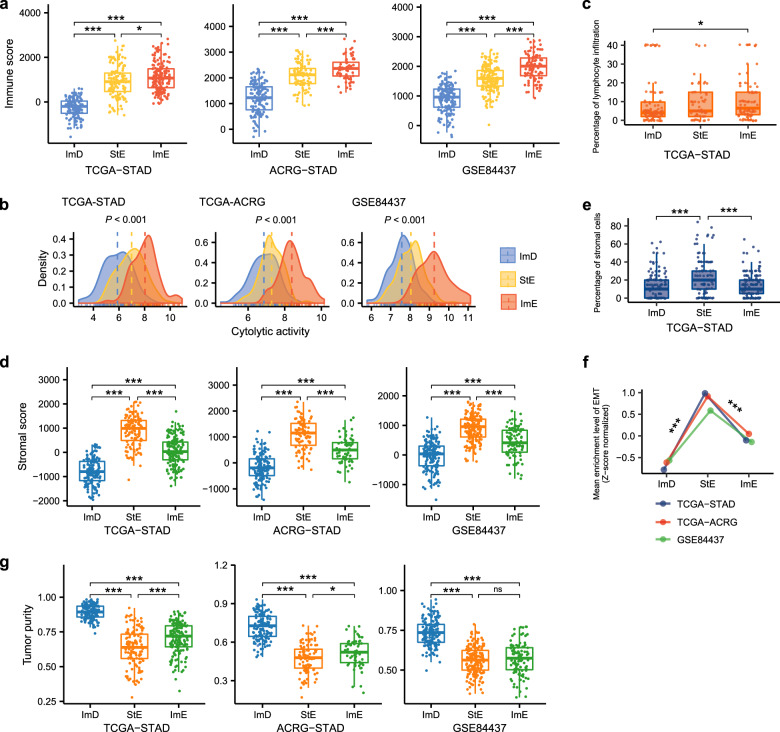
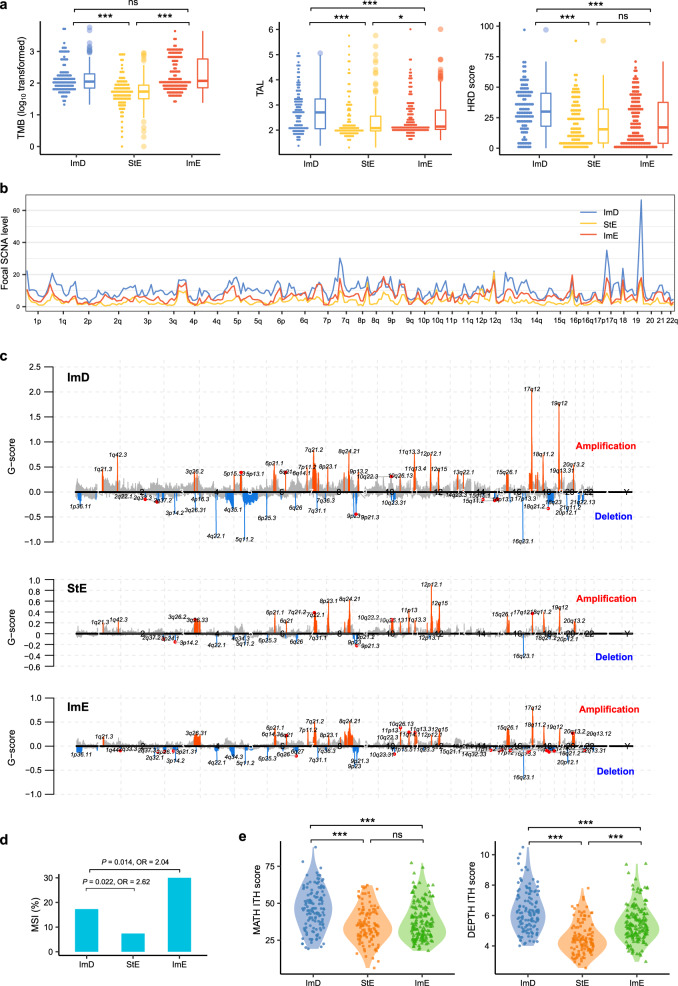
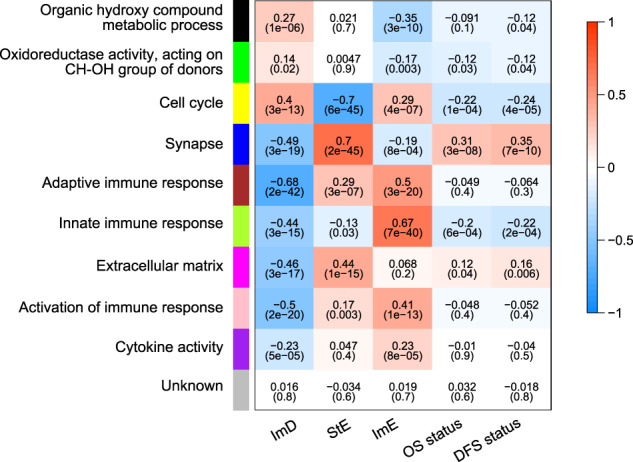
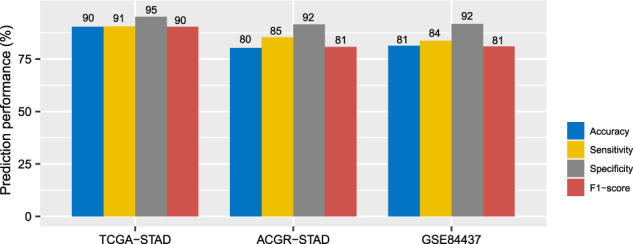
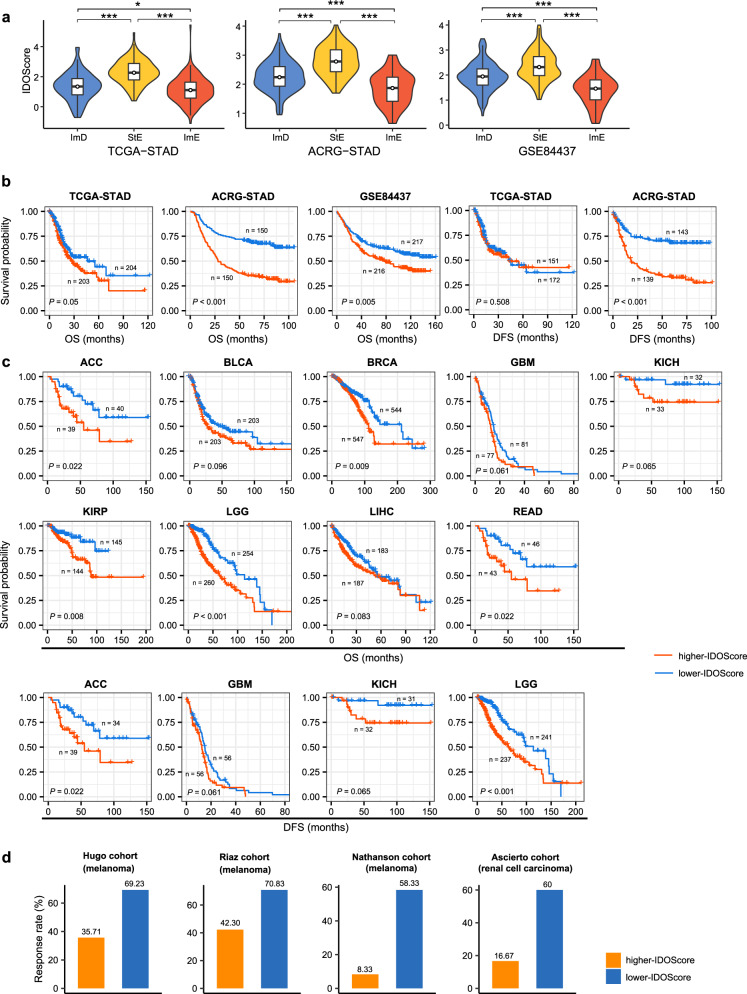
Gastric cancer (GC) is highly heterogeneous in the stromal and immune microenvironment, genome instability (GI), and oncogenic signatures. However, a classification of GC by combining these features remains lacking. Using the consensus clustering algorithm, we clustered GCs based on the activities of 15 pathways associated with immune, DNA repair, oncogenic, and stromal signatures in three GC datasets. We identified three GC subtypes: immunity-deprived (ImD), stroma-enriched (StE), and immunity-enriched (ImE). ImD showed low immune infiltration, high DNA damage repair activity, high tumor aneuploidy level, high intratumor heterogeneity (ITH), and frequent TP53 mutations. StE displayed high stromal signatures, low DNA damage repair activity, genomic stability, low ITH, and poor prognosis. ImE had strong immune infiltration, high DNA damage repair activity, high tumor mutation burden, prevalence of microsatellite instability, frequent ARID1A mutations, elevated PD-L1 expression, and favorable prognosis. Based on the expression levels of four genes (TAP2, SERPINB5, LTBP1, and LAMC1) in immune, DNA repair, oncogenic, and stromal pathways, we developed a prognostic model (IDOScore). The IDOScore was an adverse prognostic factor and correlated inversely with immunotherapy response in cancer. Our identification of new GC subtypes provides novel insights into tumor biology and has potential clinical implications for the management of GCs.


Conflict of interest statement

The authors declare no competing interests.

Figures

Fig. 1
Fig. 1. Identification of subtypes of gastric cancer based on pathway clustering.
a Consensus clustering of gastric cancer (GC) identifies three subtypes (ImD, StE, and ImE) based on the enrichment levels of 15 pathways in 3 different datasets (TCGA-STAD, ACRG-STAD, and GSE84437). The enrichment levels of the pathways were evaluated by ssGSEA of all genes involved in them. The 15 pathways are associated with immune, DNA damage repair, oncogenic, and stromal signatures. b PCA confirms that GCs can be clearly separated into three subgroups based on the ssGSEA scores of the pathways. ImD immunity-deprived, StE stroma-enriched, ImE immunity-enriched, MSI microsatellite instable, MSS microsatellite stable, MSI-H high microsatellite instability, MSI-L low microsatellite instability, EMT epithelial–mesenchymal transition (These also apply to the following figures).
Fig. 2
Fig. 2. Comparisons of immune and stromal signatures and tumor purity between the three GC subtypes.
The immune scores (a), cytolytic activity (b), and percentages of lymphocyte infiltration (c) are the highest in ImE and the lowest in ImD. The stomal scores (d), percentages of stromal cells (e), and activity of EMT (f) are the highest in StE and the lowest in ImD. g ImD has the highest tumor purity, and StE has the lowest tumor purity. The immune and stomal scores and tumor purity were evaluated by ESTIMATE. The cytolytic activity is the average expression level of two marker genes (GZMA and PRF1). The activity of EMT is the ssGSEA score of its marker genes. The one-tailed Mann–Whitney U test P values are indicated. *P < 0.05, **P < 0.01, ***P < 0.001.
Fig. 3
Fig. 3. Comparisons of genome instability and intratumor heterogeneity between the three GC subtypes in TCGA-STAD.
a Comparisons of TMB, TAL, and HRD scores between the three GC subtypes. b, c ImD and StE have the highest and lowest levels of SCNAs, respectively. The SCNA levels and G-scores were calculated by GISTIC2. d ImE and StE harbor the highest and lowest proportion of MSI cancers, respectively. The Fisher’s exact test P values and odds ratios are shown. e ImD and StE display the highest and lowest ITH, respectively. The one-tailed Mann–Whitney U test P values are indicated in (a) and (e). The MATH and DEPTH algorithms were used to evaluate ITH at the DNA and mRNA levels, respectively. TMB tumor mutation burden, TAL tumor aneuploidy level, HRD homologous recombination deficiency, SCNAs somatic copy number alterations, OR odds ratio, ITH intratumor heterogeneity, ns, not significant, *P < 0.05, **P < 0.01, ***P < 0.001.
Fig. 4
Fig. 4. Comparisons of mutation profiles between the three GC subtypes.
a Eight genes showing significantly different mutation frequencies between the three GC subtypes in TCGA-STAD. b Five genes more frequently mutated in ImE than ImD and StE, whose mutations are correlated with better OS in the Samstein cohort (gastrointestinal cancer) receiving immune checkpoint inhibitor treatment (log-rank test, P ≤ 0.1), but have no a significant correlation with OS in TCGA-STAD without such treatment. Kaplan–Meier curves are used to compare the survival time, and the log-rank test P values are shown. OS overall survival. c Comparisons of PD-L1 expression levels between the three GC subtypes. The one-way ANOVA test P values are shown.
Fig. 5
Fig. 5. Comparisons of DNA methylation profiles between the three GC subtypes in TCGA-STAD.
a The EMT-promoting, EMT-inhibiting, and DNA mismatch repair genes displaying significantly different methylation levels between the three GC subtypes. The one-tailed Mann–Whitney U test P values are indicated. b Correlations between expression levels and methylation levels of the genes whose methylation levels are significantly different between the three GC subtypes. c 17 CpG sites within MLH1 CpG islands having significantly lower methylation levels in StE than ImD and ImE. The methylation levels (average β values) are shown. d Spearman correlations between MLH1 expression levels and the methylation levels of its 17 CpG sites, which have significantly lower methylation levels in StE than ImD and ImE. e Spearman correlations between TMB and MLH1 methylation levels and expression levels. *P < 0.05, **P < 0.01, ***P < 0.001.
Fig. 6
Fig. 6. Comparisons of protein expression profiles between the three GC subtypes in TCGA-STAD.
a Heatmap showing that the proteins maintaining genomic stability, correlating with oncogenic and stromal signatures, and regulating the Hippo pathway display significantly higher expression levels in StE than ImD and ImE (two-tailed Student’s t test, false discovery rate < 0.05). b The DNA repair, cellular adhesion, and tumor suppression proteins displaying significantly lower expression levels in StE than ImD and ImE. c, d Comparisons of the expression levels of p53, FoxM1, HER2, Annexin-1, Bax, Caspase-7, GAPDH, and Jak2 between the three GC subtypes, and Spearman correlations between Annexin-1 expression levels and immune signature scores. The two-tailed Student’s t test P values are indicated in (bd). *P < 0.05, **P < 0.01, ***P < 0.001.
Fig. 7
Fig. 7. Comparisons of clinical features between the three GC subtypes.
a Kaplan–Meier curves showing that ImE and StE tend to have the best and worst survival prognosis, respectively. The log-rank test P values are shown. DFS disease-free survival. b StE harbors a higher proportion of advanced (large size/extent (T3–4), lymph nodes involved (N1–3), metastatic (M1), or late-stage (stage III–IV)) tumors than ImD and ImE. The Fisher’s exact test P values are shown. c Comparisons of the response (complete or partial response) rates of chemotherapy (30 drugs combined) and four individual chemotherapies (doxorubicin, oxaliplatin, capecitabine, and cisplatin) between the GC subtypes. ImE showing the highest response rate of chemotherapy (combined), doxorubicin, oxaliplatin, and capecitabine; ImD showing the highest response rate to cisplatin. d ImE and StE having the highest and lowest response rates to immune checkpoint inhibitors, respectively, predicted by the TIDE algorithm. Fisher’s exact test P values are shown.
Fig. 8
Fig. 8. Nine gene modules significantly differentiating gastric cancers by the subtypes in ACRG-STAD.
WGCNA showing that the immune responses are highly enriched in ImE and are deprived in ImD; the extracellular matrix is highly enriched in StE, and the cell cycle is downregulated in this subtype. Survival prognosis has positive correlations with the cell cycle and innate immune response and negative correlations with the synapse and extracellular matrix. The P values are shown in parenthesis.
Fig. 9
Fig. 9. Comparisons between the pathway-based subtyping and other subtyping methods in GC.
Intestinal and Diffuse are histological subtypes based on the pathohistological classification. The TCGA subtypes identified by integration of multi-omics data, including somatic mutations, SCNAs, CpG methylation, mRNA, miRNA, and protein expression. The ACRG subtypes identified based on the gene expression profiles of EMT, MSI, and TP53 signatures. Intestinal is enriched with ImD and ImE, and Diffuse is dominated by StE. ImD contains CIN, StE contains GS and EMT, and ImE contains MSI and EBV-associated GCs, respectively. Chi-square test, P < 0.001.
Fig. 10
Fig. 10. Prediction performance of the pathway-based GC classification method. TCGA-STAD as the training set and ACRG-STAD and GSE84437 as test sets to predict the three subtypes by XGBoost.
The prediction accuracies and weighted sensitivity, specificity, and F1-scores in TCGA-STAD (tenfold cross-validation), ACRG-STAD, and GSE84437 are shown.
Fig. 11
Fig. 11. The prognostic model (IDOScore) developed based on the expression levels of four genes (TAP2, SERPINB5, LTBP1, and LAMC1) involved in immune, DNA damage repair, oncogenic, and stromal pathways.
a Comparisons of the IDOScore values between the three GC subtypes. The one-tailed Mann–Whitney U test P values are indicated. Kaplan–Meier curves showing that the IDOScore is inversely correlated with survival prognosis in GC (b) and nine other cancer cohorts in TCGA (c) (log-rank test, P < 0.1). d Lower-IDOScore (< median) cancers showing significantly higher response rates than higher-IDOScore (>median) cancers in four cancer cohorts receiving immune checkpoint inhibitor treatment. ACC adrenocortical carcinoma, BLCA bladder urothelial carcinoma, BRCA breast invasive carcinoma, GBM glioblastoma multiforme, KICH kidney chromophobe, KIRP kidney renal papillary cell carcinoma, LGG brain lower grade glioma, LIHC liver hepatocellular carcinoma, READ rectum adenocarcinoma. *P < 0.05, **P < 0.01, ***P < 0.001.
Fig. 12
Fig. 12. A summary of molecular and clinical features of the three GC subtypes.
The three GC subtypes display significantly different molecular and clinical features. The figure was created with BioRender.com.

References

    1. Ye XS, et al. Genomic alterations and molecular subtypes of gastric cancers in Asians. Chin. J. Cancer. 2016;35:42. doi: 10.1186/s40880-016-0106-2. - DOI - PMC - PubMed
    1. Moore MA. Cancer control programs in East Asia: evidence from the international literature. J. Prev. Med Public Health. 2014;47:183–200. doi: 10.3961/jpmph.2014.47.4.183. - DOI - PMC - PubMed
    1. Chen T, Xu XY, Zhou PH. Emerging molecular classifications and therapeutic implications for gastric cancer. Chin. J. Cancer. 2016;35:49. doi: 10.1186/s40880-016-0111-5. - DOI - PMC - PubMed
    1. Berlth F, et al. Pathohistological classification systems in gastric cancer: diagnostic relevance and prognostic value. World J. Gastroenterol. 2014;20:5679–5684. doi: 10.3748/wjg.v20.i19.5679. - DOI - PMC - PubMed
    1. Cancer Genome Atlas Research, N. Comprehensive molecular characterization of gastric adenocarcinoma. Nature. 2014;513:202–209. doi: 10.1038/nature13480. - DOI - PMC - PubMed