. 2021 Jun 2;11(1):11659.
doi: 10.1038/s41598-021-91293-1.

SOG1 transcription factor promotes the onset of endoreduplication under salinity stress in Arabidopsis

Affiliations

SOG1 transcription factor promotes the onset of endoreduplication under salinity stress in Arabidopsis

Kalyan Mahapatra et al. Sci Rep. .

Retraction in

Abstract

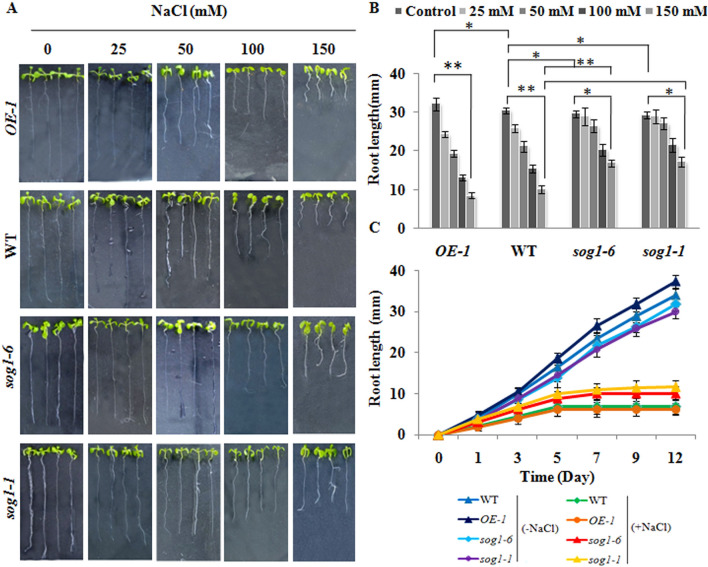
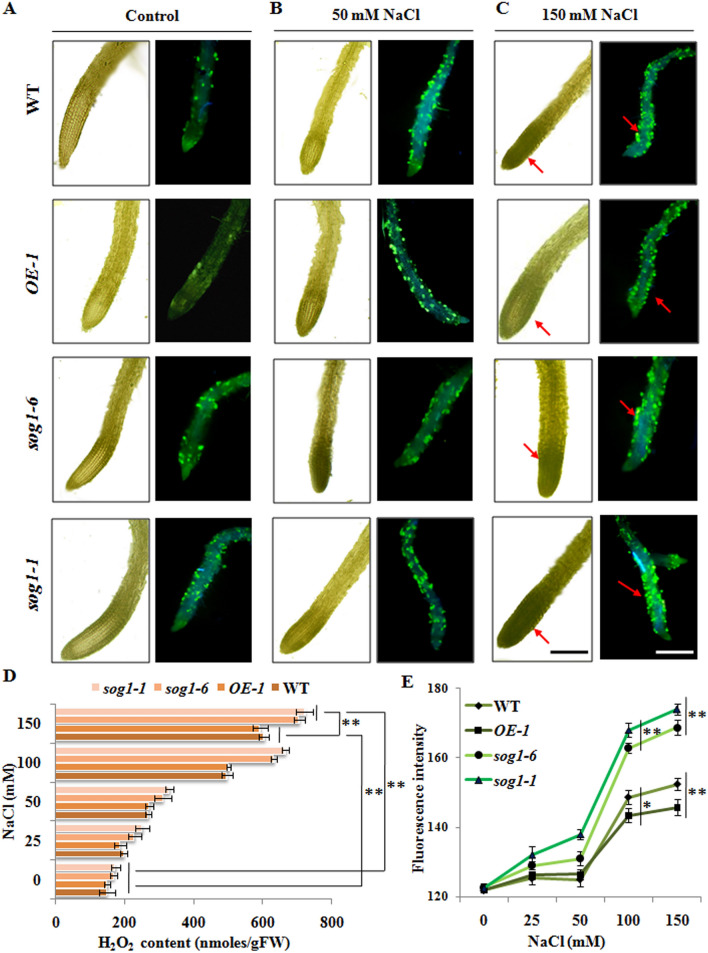
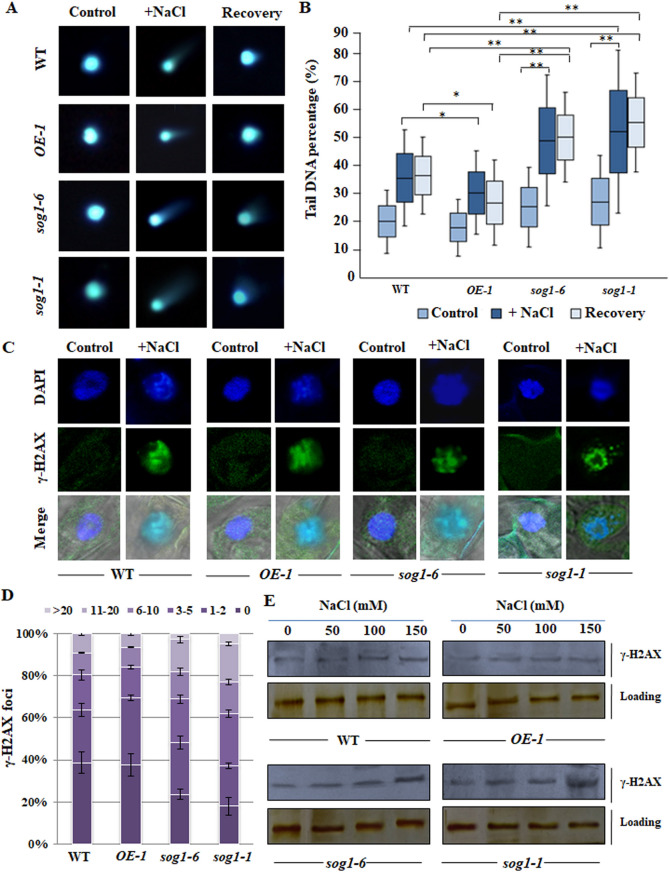
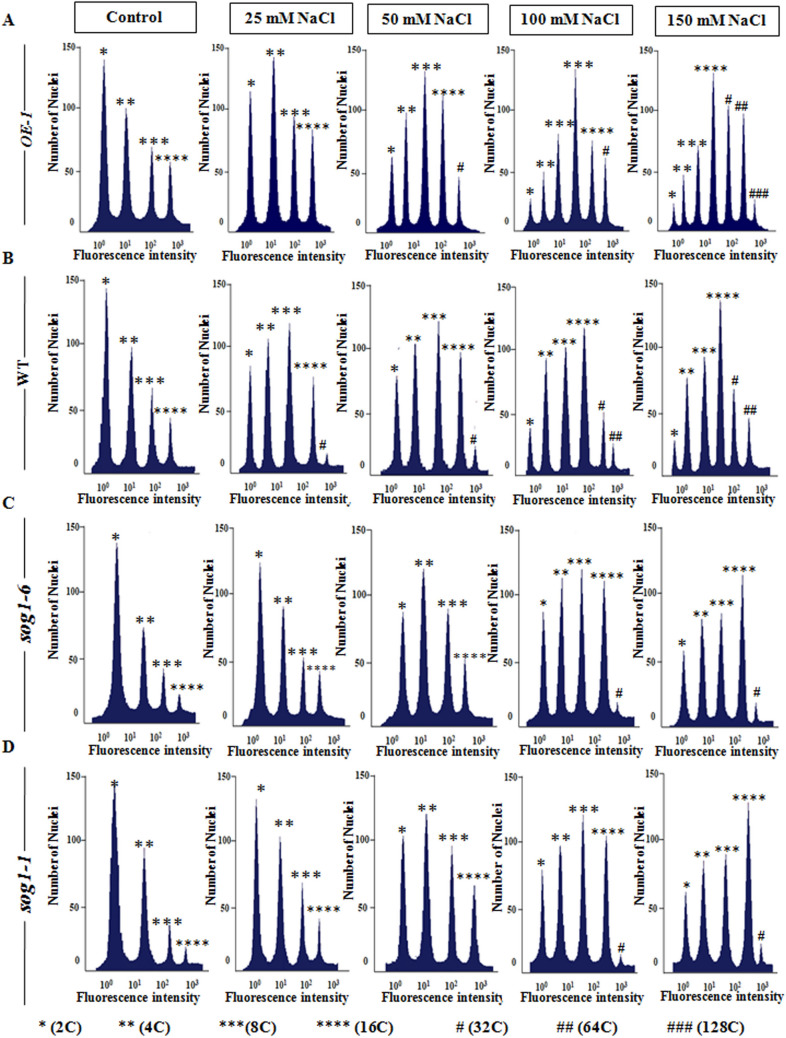
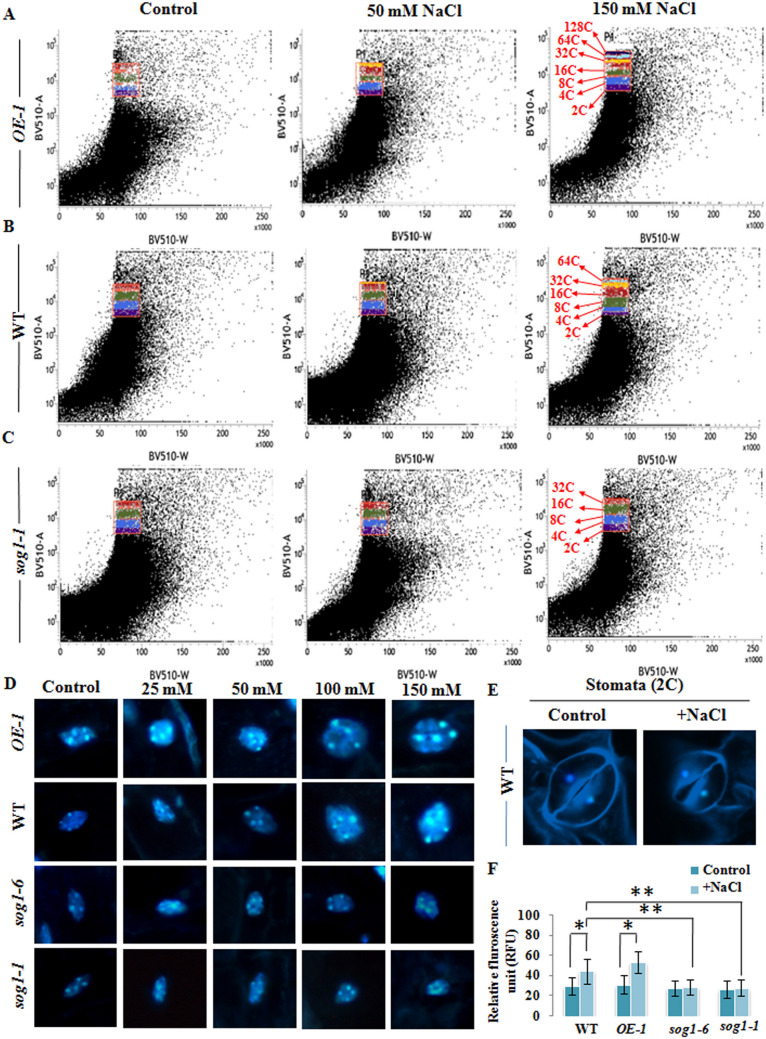
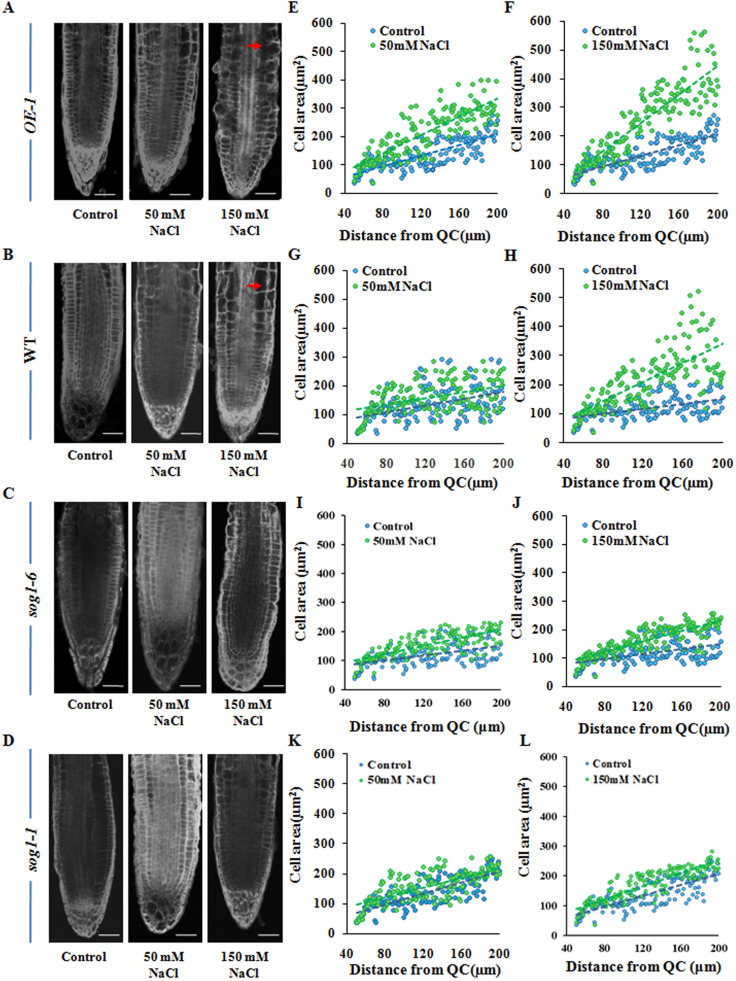
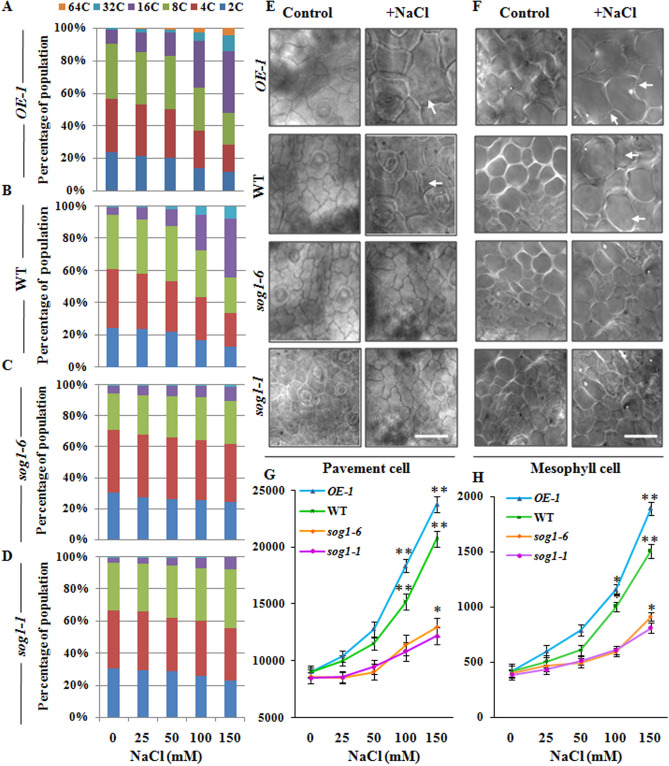
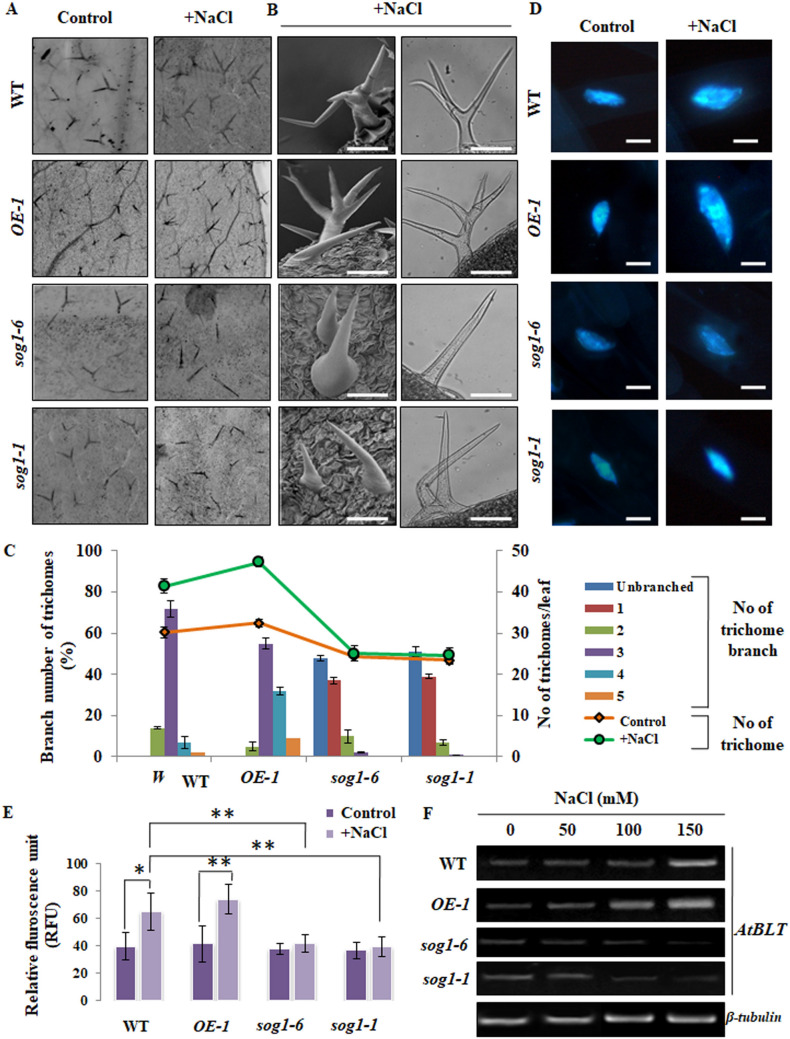
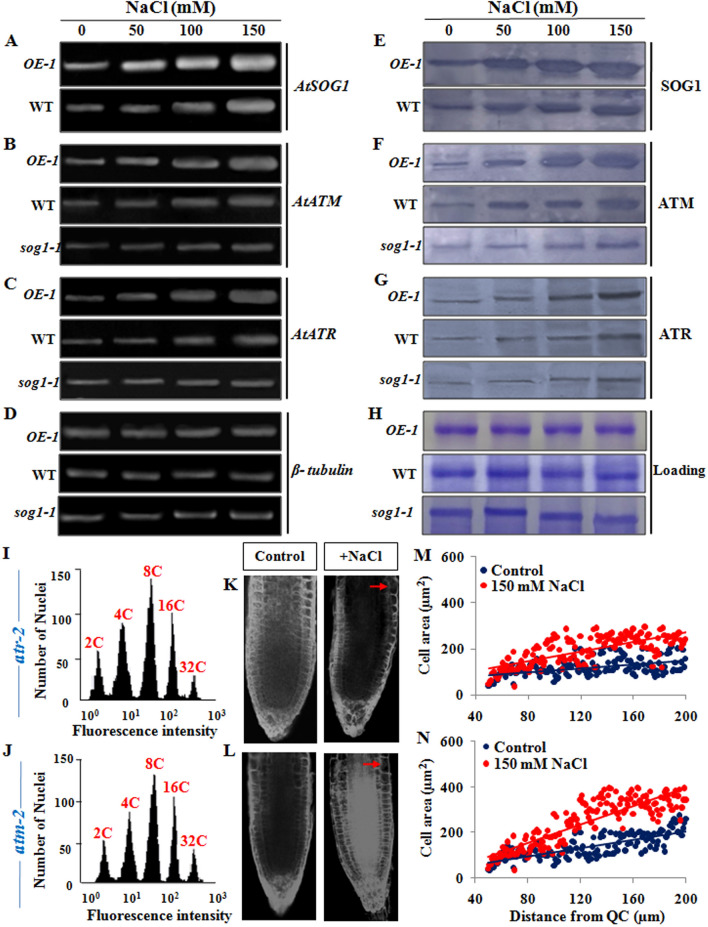
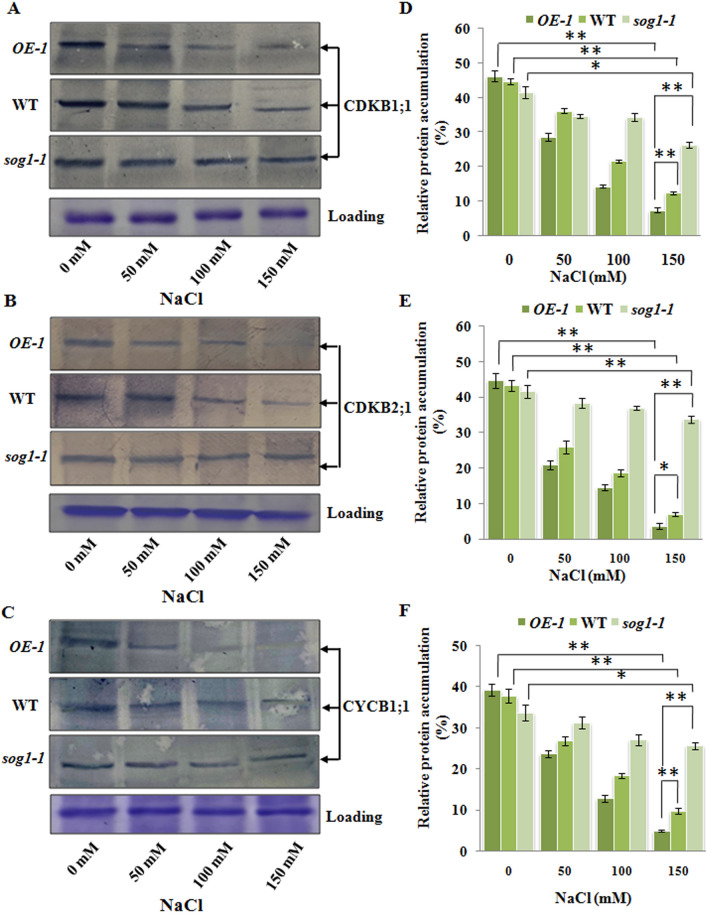
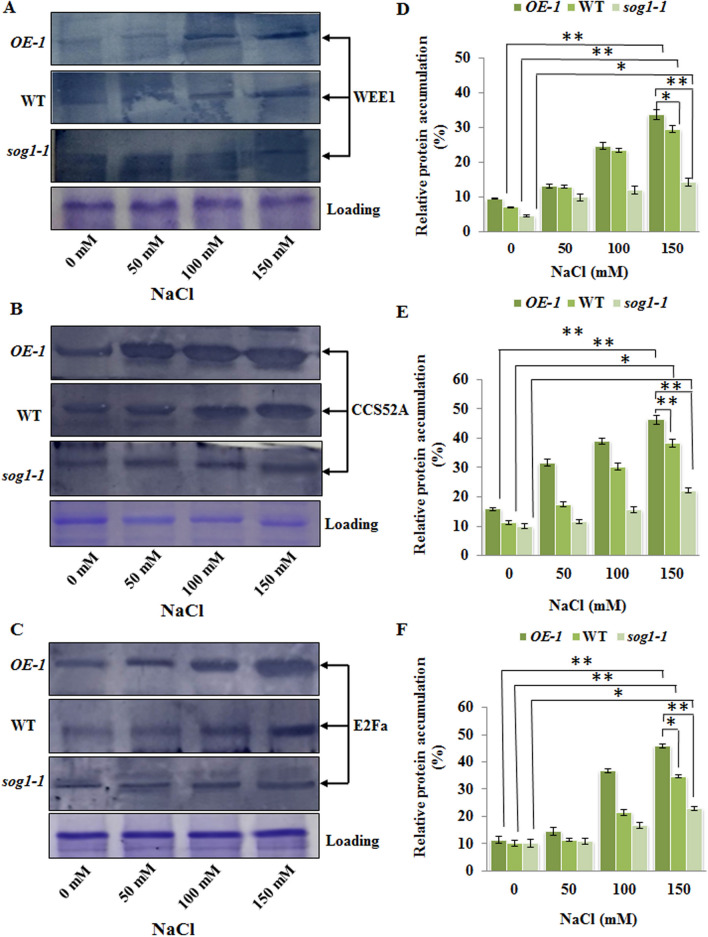
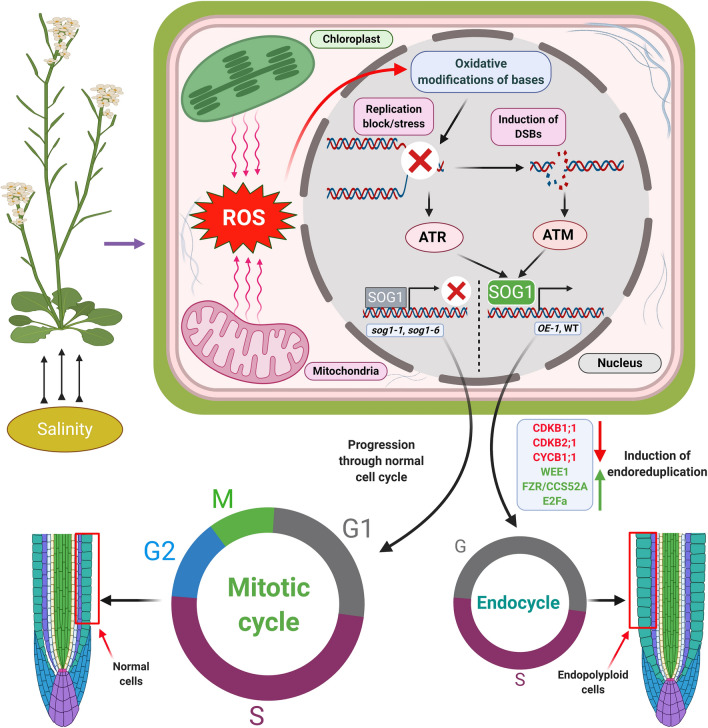
As like in mammalian system, the DNA damage responsive cell cycle checkpoint functions play crucial role for maintenance of genome stability in plants through repairing of damages in DNA and induction of programmed cell death or endoreduplication by extensive regulation of progression of cell cycle. ATM and ATR (ATAXIA-TELANGIECTASIA-MUTATED and -RAD3-RELATED) function as sensor kinases and play key role in the transmission of DNA damage signals to the downstream components of cell cycle regulatory network. The plant-specific NAC domain family transcription factor SOG1 (SUPPRESSOR OF GAMMA RESPONSE 1) plays crucial role in transducing signals from both ATM and ATR in presence of double strand breaks (DSBs) in the genome and found to play crucial role in the regulation of key genes involved in cell cycle progression, DNA damage repair, endoreduplication and programmed cell death. Here we report that Arabidopsis exposed to high salinity shows generation of oxidative stress induced DSBs along with the concomitant induction of endoreduplication, displaying increased cell size and DNA ploidy level without any change in chromosome number. These responses were significantly prominent in SOG1 overexpression line than wild-type Arabidopsis, while sog1 mutant lines showed much compromised induction of endoreduplication under salinity stress. We have found that both ATM-SOG1 and ATR-SOG1 pathways are involved in the salinity mediated induction of endoreduplication. SOG1was found to promote G2-M phase arrest in Arabidopsis under salinity stress by downregulating the expression of the key cell cycle regulators, including CDKB1;1, CDKB2;1, and CYCB1;1, while upregulating the expression of WEE1 kinase, CCS52A and E2Fa, which act as important regulators for induction of endoreduplication. Our results suggest that Arabidopsis undergoes endoreduplicative cycle in response to salinity induced DSBs, showcasing an adaptive response in plants under salinity stress.


Conflict of interest statement

The authors declare no competing interests.

Figures

Figure 1
Figure 1
Phenotypic responses in presence of increasing salinity. (A,B) Determination of root growth in 12-days old OE-1, wild-type (WT), sog1-6 and sog1-1 mutant lines under untreated condition and in response to increasing salinity. (C) 12-days old seedlings of wild-type, OE-1, sog1-6 and sog1-1 were treated without or with 150 mM NaCl and root growth was measured in 1-day interval. Three independent biological replicates for each genotype, each containing at least 10 plants, were analysed. The mean value of root length in individual experiment was determined and averaged subsequently for the three biological replicates. Error bar in the graphs represents ± SD. Asterisks represent statistically significant differences within a 5 and 1% confidence interval (*p < 0.05, **p < 0.01), respectively based on one-way ANOVA factorial analysis indicating the genotype that differs significantly in primary root growth.
Figure 2
Figure 2
Salinity mediated induction of oxidative stress. (AC, left panels) Qualitative analysis of H2O2 accumulation levels in the roots of 7-days old wild-type, OE-1, sog1-6and sog1-1 mutant lines in the absence and presence of 50 and 150 mM NaCl, respectively. (AC, right panels) Localization of superoxide radicals by ROS imaging using CM-H2DCFDA in root tips of all the genotypes in absence and presence of NaCl. Dark regions and green patches indicated by the arrow heads showing H2O2 accumulation and ROS generation, respectively. Representative images from at least three independent experiments with similar results are shown. (D,E) Quantitative estimation of H2O2 content and total ROS in the roots of 7-days old wild-type, OE-1, sog1-6 and sog1-1 mutant line seedlings, either untreated or treated with increasing concentrations of NaCl. Quantitative data has been represented as the mean value of three independent biological replicates. Error bars represent standard deviation. Asterisks represent statistically significant differences (*p < 0.05, **p < 0.01) relative to controls.
Figure 3
Figure 3
Salinity induced accumulation of DSBs. (A) Representative Comet images of 7-days old wild-type, OE-1, sog1-6 and sog1-1 mutant plants incubated without NaCl for 1 h (control) and incubated with 150 mM NaCl for 12 h and then transferred to medium without NaCl for 5 h (recovery) (left, middle and right panel respectively). (B) Box plot of percentages of tail DNA of 7-days old wild-type, OE-1, sog1-6 and sog1-1 mutant plants. DNA percentage in the comet tails were determined by using TriTek Comet Score software. Box plots are based on analysis of approximately 100 cells per experimental sample from random microscopic fields of three independent biological replicates. Each box represents the interquartile range (IQR) of DNA damage, the line across each box represents the median value and the whiskers represent 5–95 percentile values. Brackets connect box plots of sample groups with significant statistical difference (*p < 0.05, **p < 0.01). (C) Immunostaining of γ-H2AX foci in the root cells of wild-type, overexpressor line and mutant line plants after 12 h of treatment without and with 150 mM NaCl, respectively. (D) Counted numbers of γ-H2AX foci per cell detected after 12 h of treatment with 150 mM NaCl in plants of all the genotypes. According to their number of γ-H2AX foci, approximately 100 nuclei for each sample were grouped into six classes; cell with 0, 1–2, 3–5, 6–10, 11–20 and > 20 foci per nuclei. (E) Detection of γ-H2AX accumulation by immunoblot analysis using the total histone protein isolated from untreated and NaCl treated of 7-days old wild-type, OE-1, sog1-6 and sog1-1 mutant plants, respectively. The blots were cut prior to incubation with the primary antibody. Replicates of the protein gel blots have been presented in Supplementary Fig. S11.
Figure 4
Figure 4
Salinity induced endoreduplication in the root cells. (AD) Flowcytometric analysis of ploidy level in the DAPI-stained root cell nuclei of 7-days old OE-1, wild-type, sog1-6 and sog1-1 mutant plants treated without or with increasing concentrations of NaCl. A total of 10,000 events were recorded for each run and the data were analysed by FlowJo v. 10.0.6 (Tree Star, Inc.) software. All flow cytometric analyses were repeated with at least three independent biological replicates and representative ploidy distributions of total nuclei are given at the top of each peak.
Figure 5
Figure 5
Salinity induced endoreduplication and nuclear area expansion. (AC) Scatter plots showing DNA ploidy distribution in root tip nuclei of 7-days old OE-1, wild-type and sog1-1 mutant plants treated without or with 50 and 150 mM NaCl. (D) Confocal imaging of DAPI-stained nuclei in the root cells of 7-days old OE-1, wild-type, sog1-6 and sog1-1 mutant seedlings (first, second, third and fourth panel, respectively); Scale bar: 10 μm. (E) The nuclei in a pair of wild-type stomata cells represent 2C. Strongly stained dots in each nucleus correspond to centromeres. (F) Measurement of in-situ fluorescence in DAPI-stained root tip nuclei of wild-type, OE-1, sog1-6 and sog1-1 mutant seedlings. Each bar represents the mean value of three independent replicates. Error bar indicates standard deviation. Asterisks indicate significant statistical differences (*p < 0.05, **p < 0.01) from control (without NaCl treatment) using one-way ANOVA factorial analysis.
Figure 6
Figure 6
Salinity induced cell area expansion in the root tip epidermal cells. (AD) Propidium iodide stained root tip cells of 7-days old OE-1, wild-type, sog1-6 and sog1-1 mutant seedlings respectively, either treated without or with 50 and 150 mM NaCl. Red arrows showing increase in cell size. Scale bar: 50 μm. (EL) Measurement of area of root tip cells situated between 40 and 200 μm from the quiescent centre (QC) using ImageJ software (NIH). Regression lines included in (EL); For OE-1 (E,F), R2 = 0.421 (Control), 0.598 (50 mM), 0.787 (150 mM); for wild-type (G,H), R2 = 0.507 (Control), 0.617 (50 mM), 0.713 (150 mM); for sog1-6 (I,J), R2 = 0.228 (Control), 0.236 (50 mM), 0.354 (150 mM) and for sog1-1 (K,L), R2 = 0.181 (Control), 0.191 (50 mM), 0.204 (150 mM). The F value was found to be < 0.001 for all regression analyses.
Figure 7
Figure 7
Induction of endopolyploidy in leaf epidermal and mesophyll cells. (AD) Flowcytometric analysis of ploidy level in the nuclei isolated from the first and second pair of leaves of SOG1 overexpressor line OE-1, wild-type, sog1-6 and sog1-1 mutant plants exposed to increasing concentrations of NaCl. (E,F) Change in cell surface area of epidermal pavement cells (Scale bar: 100 μm) and mesophyll cells (Scale bar: 50 μm) of SOG1 overexpressor line OE-1, wild- type, sog1-6 and sog1-1 mutant plants, either in absence or presence of NaCl. Leaf epidermal pavement cells and mesophyll cells in the basal region of primary leaves were photographed. White arrows indicating enlarged pavement and mesophyll cells. (G,H) Measurement of cell surface area of leaf pavement and mesophyll cells in leaves of all the four genotypes exposed to increasing concentrations of NaCl. Leaf surface areas were measured using ImageJ software (NIH). Data of the leaf surface area presented are the mean value of three independent biological replicates. Error bar represents ± SD (n = 40). Asterisks indicate a significant difference between untreated control and treated samples for each genotype based on one-way ANOVA factorial analysis (*p < 0.05, **p < 0.01).
Figure 8
Figure 8
Change in trichome density, branch number and ploidy level in response to salinity stress. (A) Distribution of leaf trichome in 7-days old wild-type, OE-1, sog1-6 and sog1-1mutant plants, either untreated or treated with 150 mM NaCl. (B) SEM and bright field micrographs of mature trichomes with three branches in wild-type, five branches in OE-1 and unbranched in sog1-6 and sog1-1mutant line plants following NaCl treatment. Scale bar: 100 μm (C) Determination of leaf trichome density and branch number in all the four genotypes. (D) Representative images of DAPI-stained nuclei of 7-days old untreated or NaCl-treated wild-type, OE-1, sog1-6 and sog1-1 mutant plants. Scale bar: 100 μm (E) Measurement of in-situ fluorescence in DAPI-stained trichome nuclei of wild-type, OE-1, sog1-6 and sog1-1 mutant seedlings. (F) Semi quantitative RT-PCR showing expression level of AtBLT gene in all genotypes in response to increasing NaCl concentrations. β-tubulin served as the internal control. Each column represents the mean value of three independent replicates. Images of full-length gels have been presented in Supplementary Fig. S12. Error bars indicate standard deviation. Asterisks indicate significant statistical differences (*p < 0.05, **p < 0.01) from control (without NaCl treatment) using one-way ANOVA factorial analysis.
Figure 9
Figure 9
Salinity induced activation of ATM-SOG1 and ATR-SOG1 pathways. (A) Semi-quantitative reverse transcription-PCR analysis showing expression level of AtSOG1 in OE-1 and wild-type seedlings exposed to increasing concentrations of NaCl for 12 h. (BD) Transcript accumulation levels of AtATM, AtATR and β-tubulin genes, respectively in OE-1, wild-type and sog1-1 seedlings exposed to increasing concentrations of NaCl for 12 h. β-tubulin served as the housekeeping gene. Quantitative analyses of relative expression of AtSOG1, AtATM and AtATR genes have been presented in Supplementary Fig. S7. Images of full-length gels have been presented in Supplementary Fig. S13. (E) Detection of protein accumulation level of SOG1 in OE-1 and wild-type seedlings exposed to increasing concentrations of NaCl for 12 h. (FG) Detection of protein accumulation levels of key DNA damage response transducers, including ATM and ATR, respectively in 7-days old OE-1, wild-type and sog1-1 seedlings exposed to increasing concentrations of NaCl. The blots were cut prior to incubation with the respective primary antibodies. (H) Respective loading control of total protein extracts from OE-1, wild-type and sog1-1 seedlings respectively. Immunoblotting was performed by using ~ 50 µg of total protein extracts. Representative gel blot images from at least three independent experiments are shown. Replicates of the protein gel blots have been presented in Supplementary Fig. S14. (I,J) Flowcytometric analysis of ploidy level in the propidium iodide DAPI-stained root cell nuclei of 7-days old atr-2 and atm-2 mutant plants treated without or with 150 mM NaCl. (K,L) Propidium iodide stained root tips of 7-days old atr-2 and atm-2 mutant seedlings respectively, either treated without or with 150 mM NaCl. Red arrows showing enlarged root epidermal cells. Scale bar: 50 μm. (M,N) Measurement of area of root tip cells situated between 40 and 200 μm from the quiescent centre (QC) using ImageJ software (NIH). Regression lines included in (M,N); for atr-2 (M) R2 = 0.224 (Control), 0.506 (150 mM) and for atm-2 (N) R2 = 0.597 (control), 0.744 (150 mM).
Figure 10
Figure 10
SOG1 is found to control the entry into M-phase and induce cell cycle arrest under salinity stress. (AC) Detection of protein accumulation levels of key regulators of cell cycle progression and endoreduplication including CDKB1;1 (A), CDKB2;1 (B), CYCB1;1 (C), respectively in 7-days old OE-1, wild-type and sog1-1 seedlings exposed to increasing concentrations of NaCl for 12 h. Loading control of total protein extracts has been presented in the lowermost panel. Immunoblotting was performed by using ~ 50 µg of total protein extracts. The blots were cut prior to incubation with the respective primary antibody\ies. Representative gel blot images from at least three independent experiments are shown. Replicates of the protein gel blots have been presented in Supplementary Fig. S15. (DF) Quantification of band intensity to determine the accumulation levels of CDKB1;1 (D), CDKB2;1 (E), CYCB1;1 (F) proteins as detected by immunoblotting. Densitometry analysis was carried out by ImageJ software (NIH). Error bar indicates standard deviation. Asterisks indicate significant statistical differences (*p < 0.05, **p < 0.01) from control (without NaCl treatment) using one-way ANOVA factorial analysis.
Figure 11
Figure 11
SOG1 is important in controlling cell cycle progression and entry into endocycle in response to salinity stress. (AC) Detection of protein accumulation levels of key regulators of cell cycle progression and endoreduplication including WEE1 (A), CCS52A (B) and E2Fa (C), respectively in 7-days old OE-1, wild-type and sog1-1 seedlings exposed to increasing concentrations of NaCl for 12 h. The blots were cut prior to incubation with the respective primary antibody. Loading control of total protein extracts has been presented in the lowermost panel. Representative gel blot images from at least three independent experiments are shown. Replicates of the protein gel blots have been presented in Supplementary Fig. S16. (DF) Quantification of band intensity for determining the accumulation levels of WEE1 (D) CCS52A (E), E2Fa (F) proteins as detected by immunoblotting. Densitometry analysis was carried out by ImageJ software (NIH). Error bar indicates standard deviation. Asterisks indicate significant statistical differences (*p < 0.05, **p < 0.01) from control (without NaCl treatment) using one-way ANOVA factorial analysis.
Figure 12
Figure 12
Salinity induced onset of endoreduplication in Arabidopsis thaliana is mediated by SOG1. Increasing salinity induces replication stress via oxidative modifications of bases, resulting into accumulations of DSBs. ATR-SOG1 and ATM-SOG1 pathways are activated following replication stress and accumulation of DSBs and regulate the expression of various regulators of cell cycle progression and endoreduplication including, CDKB1;1, CDKB2;1, CYCB1;1, CCS52A, WEE1 and E2Fa, resulting in entry into the endocycle. The figure has been created with BioRender.com.

Similar articles

Cited by

References

    1. Flowers TJ. Improving crop salt tolerance. J. Exp. Bot. 2004;55:1–13. doi: 10.1093/jxb/erh003. - DOI - PubMed
    1. Gupta B, Huang B. Mechanism of salinity tolerance in plants: Physiological, biochemical, and molecular characterization. Int. J. Genom. 2014 doi: 10.1155/2014/701596. - DOI - PMC - PubMed
    1. Hasegawa PM, Bressan RA, Zhu JK, Bohnert HJ. Plant cellular and molecular responses to high salinity. Annu. Rev. Plant Physiol. Plant Mol. Biol. 2000;51:463–499. doi: 10.1146/annurev.arplant.51.1.463. - DOI - PubMed
    1. Zhu JK. Salt and drought stress signal transduction in plants. Annu. Rev. Plant Biol. 2002;53:247–273. doi: 10.1146/annurev.arplant.53.091401.143329. - DOI - PMC - PubMed
    1. Isayenkov S, Maathuis FJM. Plant salinity stress: Many unanswered questions remain. Front. Plant Sci. 2019;10:80. doi: 10.3389/fpls.2019.00080. - DOI - PMC - PubMed

Publication types

MeSH terms