. 2021 Jun 2;11(1):11616.
doi: 10.1038/s41598-021-91220-4.

COVID-19 transmission in group living environments and households

Affiliations

COVID-19 transmission in group living environments and households

Tetsuya Akaishi et al. Sci Rep. .

Abstract

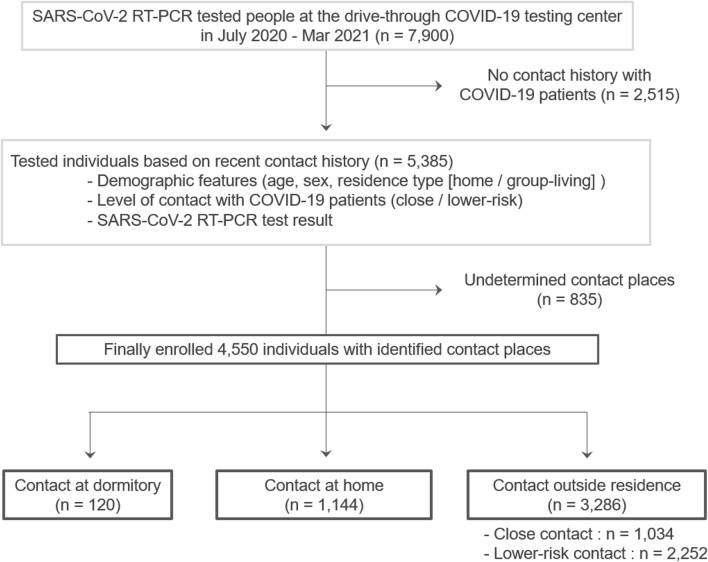
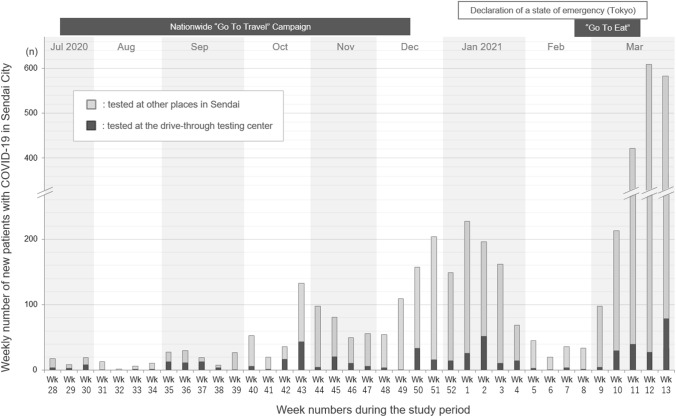
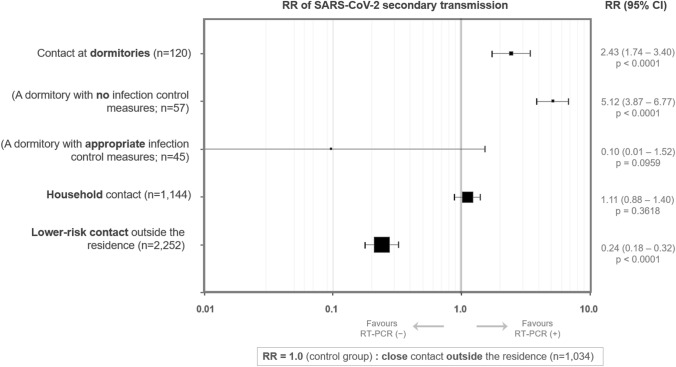
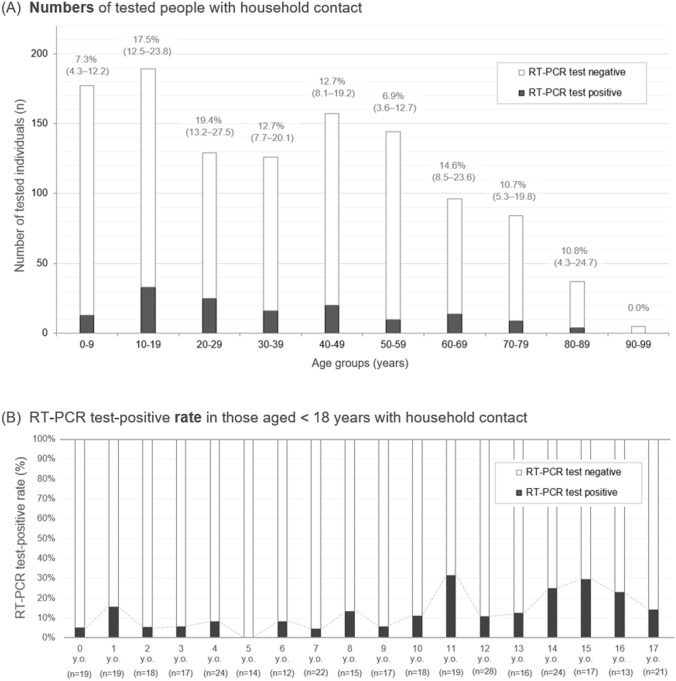
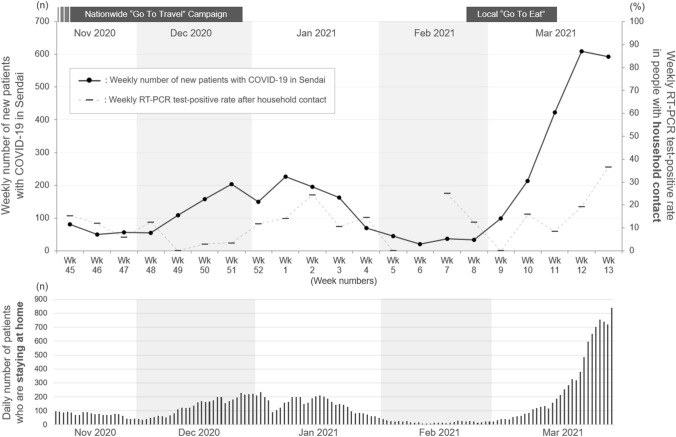
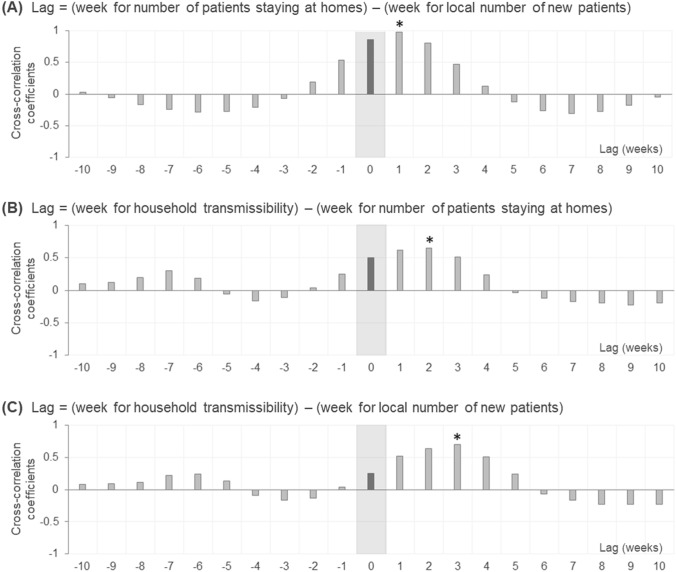
The coronavirus disease 2019 (COVID-19) pandemic caused by severe acute respiratory syndrome coronavirus 2 (SARS-CoV-2) is currently the world's largest public health concern. This study evaluated COVID-19 transmission risks in people in group living environments. A total of 4550 individuals with a history of recent contact with patients at different places (dormitory/home/outside the residences) and levels (close/lower-risk) were tested for SARS-CoV-2 viral RNA using a nasopharyngeal swab test between July 2020 and May 2021. The test-positive rate was highest in individuals who had contact in dormitories (27.5%), but the rates were largely different between dormitories with different infrastructural or lifestyle features and infection control measures among residents. With appropriate infection control measures, the secondary transmission risk in dormitories was adequately suppressed. The household transmission rate (12.6%) was as high as that of close contact outside the residences (11.3%) and accounted for > 60% of the current rate of COVID-19 transmission among non-adults. Household transmission rates synchronized to local epidemics with changed local capacity of quarantining infectious patients. In conclusion, a group living environment is a significant risk factor of secondary transmission. Appropriate infection control measures and quarantine of infectious residents will decrease the risk of secondary transmission in group living environments.


Conflict of interest statement

The authors declare no competing interests.

Figures

Figure 1
Figure 1
Study design flowchart with three groups at different contact places. The flowchart illustrates the inclusion and exclusion processes of the study and the categorization into three groups according to the different places of contact (dormitory, home, and outside residence) with the COVID-19 patients. COVID-19, coronavirus disease; RT-PCR, reverse transcription polymerase chain reaction; SARS-CoV-2, severe acute respiratory syndrome coronavirus 2.
Figure 2
Figure 2
Weekly number of new patients with COVID-19 in Sendai City from July 2020 to March 2021. The black bars illustrate the weekly number of patients newly diagnosed with COVID-19 tested at a drive-through COVID-19 testing center and were initially recruited for this study. The gray bars above the black bars represent the weekly number of patients newly diagnosed with COVID-19 tested at other testing facilities in Sendai City who were not enrolled in this study. The local government announced the daily numbers of new local patients. COVID-19, coronavirus disease; RT-PCR, reverse transcription polymerase chain reaction.
Figure 3
Figure 3
Relative risks of acquiring the COVID-19 infection by place of contact with COVID-19 patients. The figure shows subgroup-specific risk ratios (RR) for subjects in different groups divided by the places and levels of recent contact history with COVID-19 patients. The crude RR for each subgroup is plotted as a black square, and the size of each plot is proportional to the number of subjects in each subgroup. Error bars represent 95% confidence intervals of the RR. Individuals with recent close contact outside their residences (n = 1034) were considered as the control group, corresponding to an RR value of 1.0 (the solid vertical line). The values of RR above 1.0 indicate that people in each group are more likely to have a positive SARS-CoV-2 RT-PCR test result. An RR value of < 1.0 indicates a lower RT-PCR test positivity rate. The calculated RR are plotted on a logarithmic scale. COVID-19, coronavirus disease; RR, risk ratios; RT-PCR, reverse transcription polymerase chain reaction; SARS-CoV-2, severe acute respiratory syndrome coronavirus 2.
Figure 4
Figure 4
Histogram of tested individuals after household contact with a patient with COVID-19 by age group. The figures present (A) a histogram of the number (n) of tested individuals after household contact with a family member with COVID-19 separated into 10-year age intervals among all 1144 enrolled individuals with household contact. (B) RT-PCR test-positive rate (%) by age after household contact in 333 non-adults aged < 18 years. Black bars represent the proportion of positive RT-PCR test results, and white bars above the black bars illustrate the proportion of negative RT-PCR test results. The percentage and range shown in panel (A) indicate the proportion of positive RT-PCR tests and the 95% confidence interval in each age group, respectively.
Figure 5
Figure 5
Change in local epidemic status and transmissibility of COVID-19 following household contacts. The black solid line represents the weekly number of newly diagnosed cases of COVID-19 in Sendai City. The gray broken line represents the weekly RT-PCR test-positive rate in people with a household contact who were tested at the drive-through COVID-19 testing center. The change in COVID-19 transmissibility after household contact appeared to be delayed by several weeks from the changes in local epidemic status. The lower half of the table shows the chronological change in the daily total number of infectious patients staying at their homes in Miyagi Prefecture (i.e., the prefecture where Sendai City is located).
Figure 6
Figure 6
Cross-correlograms between local epidemics, number of patients staying at home, and household COVID-19 transmissibility. The local COVID-19 epidemic status is represented by the weekly number of newly diagnosed COVID-19 patients. The gray filled areas show the cross-correlations between two simultaneous variables with no time lag. The asterisk indicates the lag that produces the largest cross-correlation coefficient, suggesting a time delay between the two assessed variables.

Similar articles

Cited by

References

    1. Fauci AS, Lane HC, Redfield RR. Covid-19—navigating the uncharted. N. Engl. J. Med. 2020;382:1268–1269. doi: 10.1056/NEJMe2002387. - DOI - PMC - PubMed
    1. Gates B. Responding to Covid-19—a once-in-a-century pandemic? N. Engl. J. Med. 2020;382:1677–1679. doi: 10.1056/NEJMp2003762. - DOI - PubMed
    1. Mizumoto K, Kagaya K, Zarebski A, Chowell G. Estimating the asymptomatic proportion of coronavirus disease 2019 (COVID-19) cases on board the Diamond Princess cruise ship, Yokohama, Japan, 2020. Euro Surveill. 2020 doi: 10.2807/1560-7917.Es.2020.25.10.2000180. - DOI - PMC - PubMed
    1. Moriarty LF, et al. Public health responses to COVID-19 outbreaks on cruise ships—worldwide, February–March 2020. MMWR Morb. Mortal. Wkly. Rep. 2020;69:347–352. doi: 10.15585/mmwr.mm6912e3. - DOI - PMC - PubMed
    1. Frieden TR, Lee CT. Identifying and Interrupting superspreading events-implications for control of severe acute respiratory syndrome coronavirus 2. Emerg. Infect. Dis. 2020;26:1059–1066. doi: 10.3201/eid2606.200495. - DOI - PMC - PubMed